
Welcome to CivilGEO Knowledge Base
Welcome to CivilGEO Knowledge Base
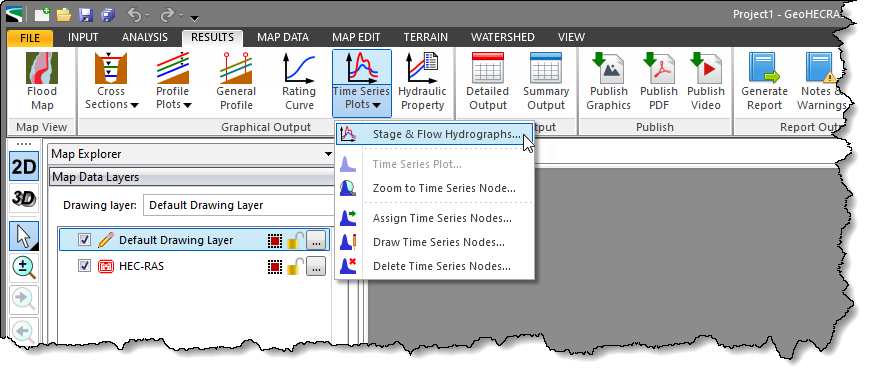
The GeoHECRAS software can generate stage and flow hydrographs of the HEC‑RAS unsteady flow computational results for various node types such as Bridges/Culverts, Inline Structures, Lateral Structures, and Storage Areas. In addition, the hydrographs can be copied to the Windows clipboard and printed for later use.
If the user has performed an unsteady flow analysis, then stage and flow hydrographs will be available for viewing.
To view a stage and/or flow hydrograph, follow these steps:
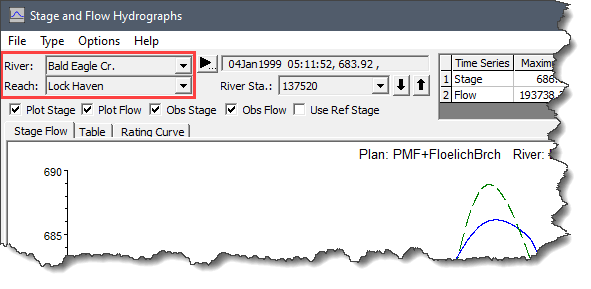
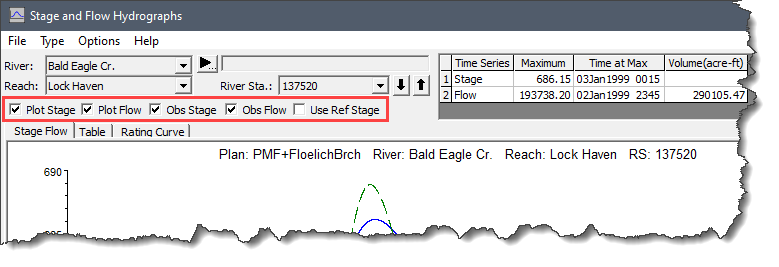
For an HEC‑RAS model with multiple river reaches, the user can select one or more river reaches to plot. The River and Reach dropdown combo boxes display a listing of the river and corresponding reaches contained within the model. The user can select the preferred river reach using these dropdown combo boxes.
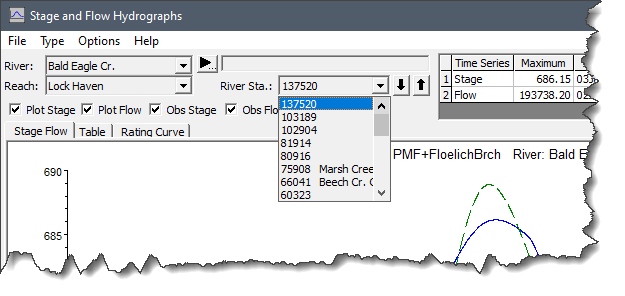
The River Station (River Sta.) dropdown combo box displays a listing of all the river stations contained within the selected reach. The user can select the river station to plot the hydrograph. To move to the next downstream river station, click the [↓] button. To move upstream, click the [↑] button.
The Type menu of the Stage and Flow Hydrograph dialog box allows the user to select the specific node type to be viewed.
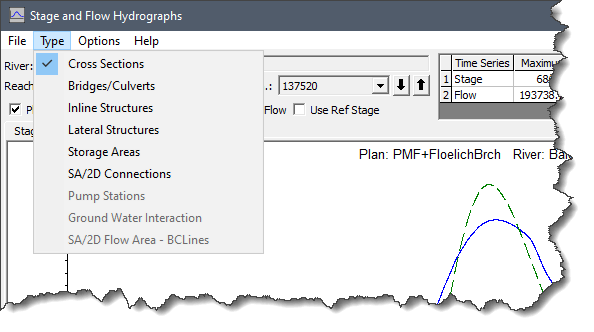 By default, the plot comes up with a node type of cross section selected. This allows the user to view hydrographs at cross sections only.
Other available node types include:
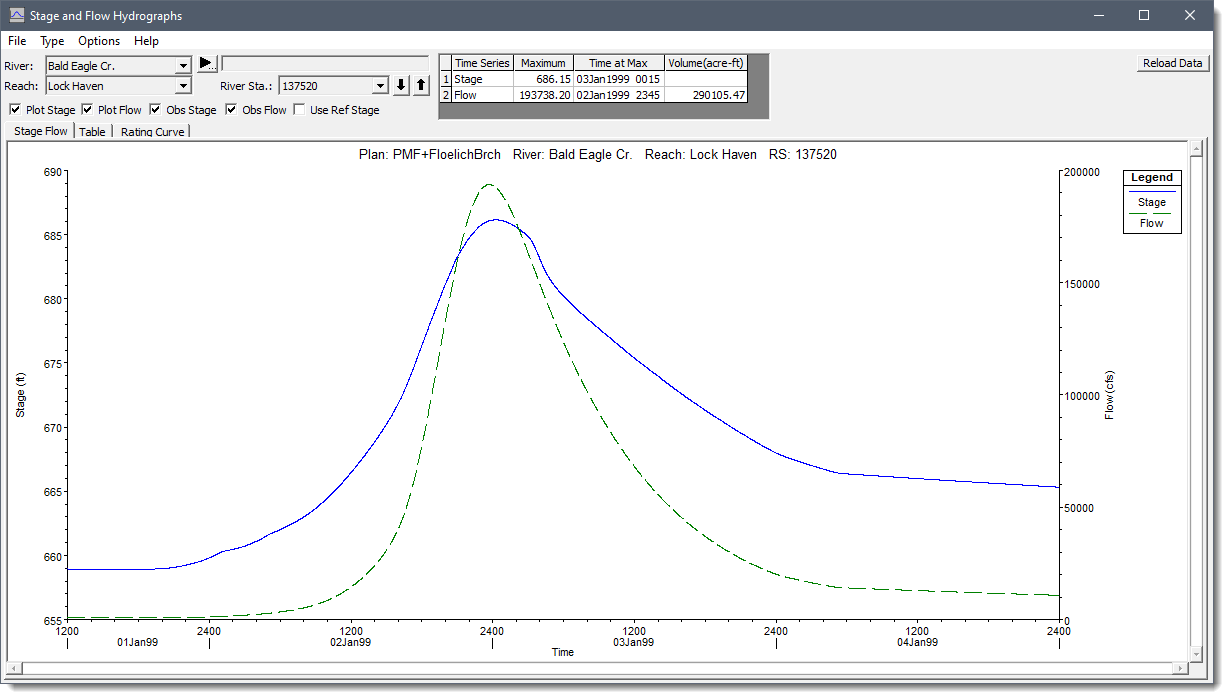
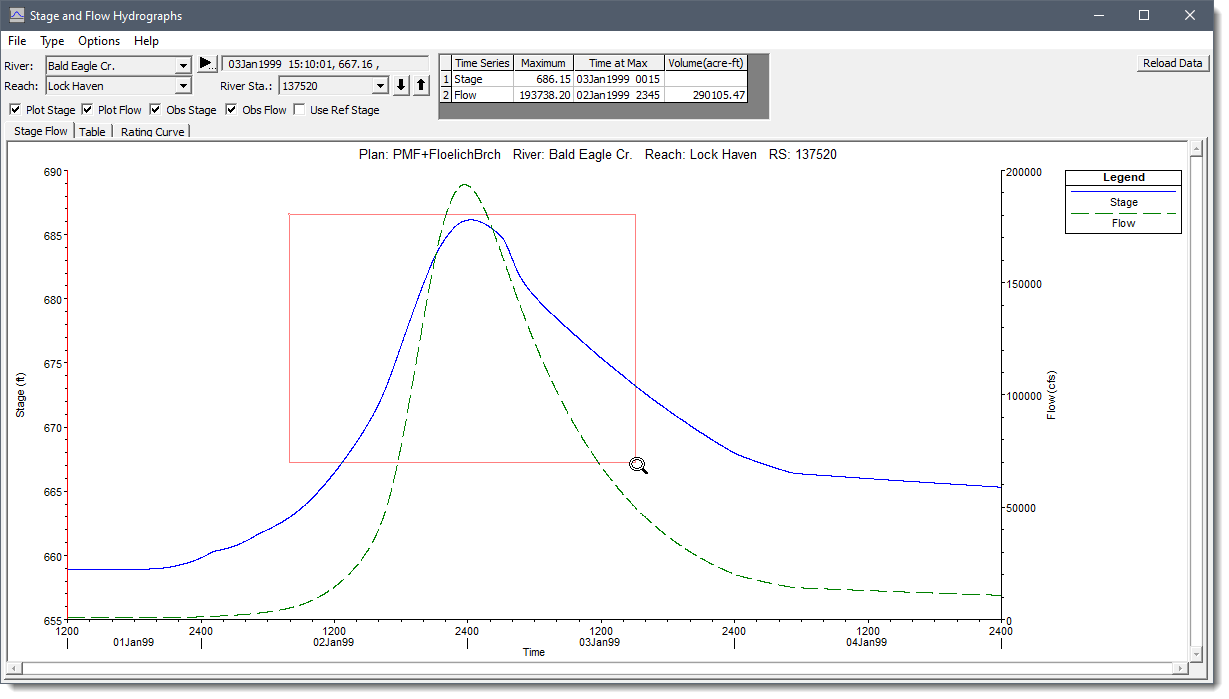
The Stage and Flow Hydrographs dialog box provides several options for changing the viewpoint of the stage and flow hydrographs. The Plot Stage and Plot Flow checkboxes allows the user to plot the stage and flow hydrograph, respectively. The user can check both the checkboxes to plot both the hydrographs simultaneously. Checking the Obs Stage and Obs Flow checkboxes allows the user to plot the observed stage and flow hydrograph data at locations where gaged information is stored in a DSS file. The Use Ref Stage checkbox can be checked to plot the stage hydrograph using a reference stage.
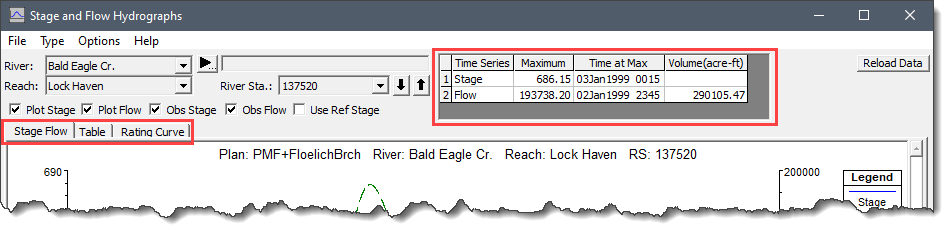
The user can switch between three tabbed panels: Stage Flow, Table and Rating Curve to view the graphical plot, data in tabular form or the rating curve plot of the event. Additionally, the dialog box also provides statistics about the hydrograph plots in a tabular form. The table’s Maximum, Time at Max and Volume (acre-ft) columns shows the peak stage and flow, and time of peak and volume, respectively.
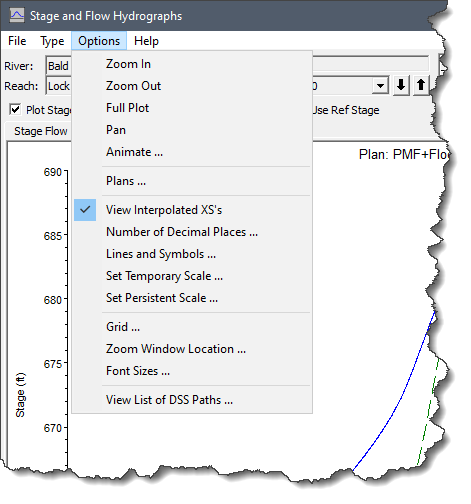
The Options menu of the Stage and Flow Hydrographs dialog box provides several plotting features for viewing the graphical plots.
 The below sections describe how to use each of the above shown plotting features.
This option allows the user to zoom in on a portion of the graphic plot. The user can select the Zoom In command from the Options menu and specify the area to zoom in with the mouse.
To define the zoom area, the user can place the mouse pointer at a corner of the desired zoom area. Then the user can press and hold the mouse button and drag the mouse to define a box containing the desired zoom area.
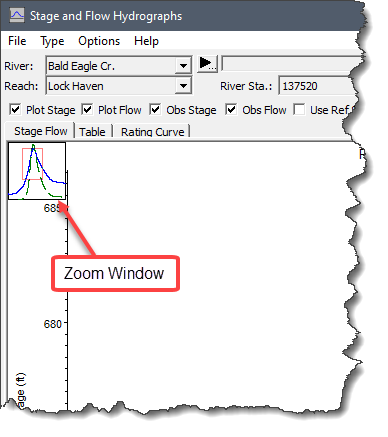
 On releasing the mouse button, the viewing area will display the zoomed-in graphic plot. A small window showing the entire plot will be placed in one of the corners of the plotting area. This window is called the Zoom Window. The Zoom Window shows the entire graphic plot with a box around the zoomed in area. The user can move the zoom box or resize it to change the viewing area.
Selecting the Zoom Out option causes the software to double the size of the currently zoomed in graphic plot.
Selecting the Full Plot option causes the software to re-display the graphic plot at its original size.
This option allows the user to move the graphic plot around. After selecting the Pan option, the user can press and hold the mouse button over the graphic plot, then move the graphic plot in the desired direction. Alternatively, the user can hold down the [Shift] key to put the pointer into the Pan mode. Releasing the [Shift] key turns the Pan mode off.
This option is generally used for unsteady flow output analysis but can also be used for steady flow output. This option works with the cross section, profile, and X, Y, Z perspective plots. To learn more about the Animate option, refer to this article in our knowledge base.
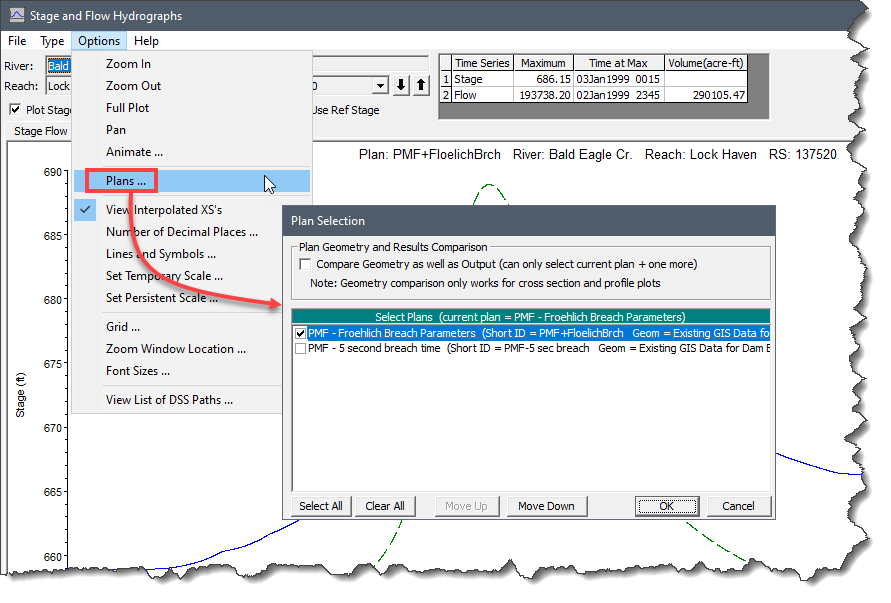
This option allows the user to select from the available plans (Scenarios) for plotting. The default plan is the currently opened plan. The user can select additional plans to compare results graphically.
This option allows the user to view the interpolated cross sections. To learn how to interpolate cross sections, refer to this article in our knowledge base.
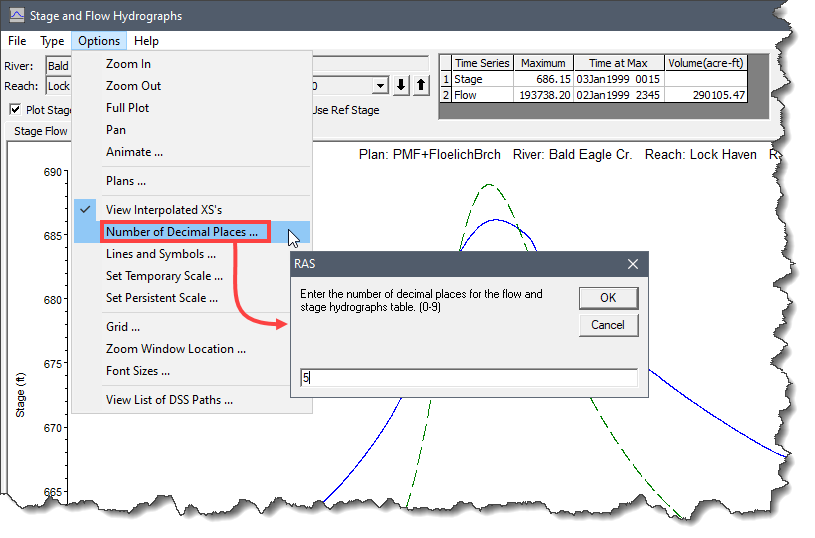
This option allows the user to define the number of decimal places for the flow and hydrograph table. Selecting the Number of Decimal Places option will display the RAS dialog box where the user can enter the value (between 0 and 9) to define the number of decimal places.
This option allows the user to customize the line types, line colors, line widths, symbol types, symbol sizes, symbol colors, fill patterns, and line labels. To learn more about the Lines and Symbols option, refer to this article in our knowledge base.
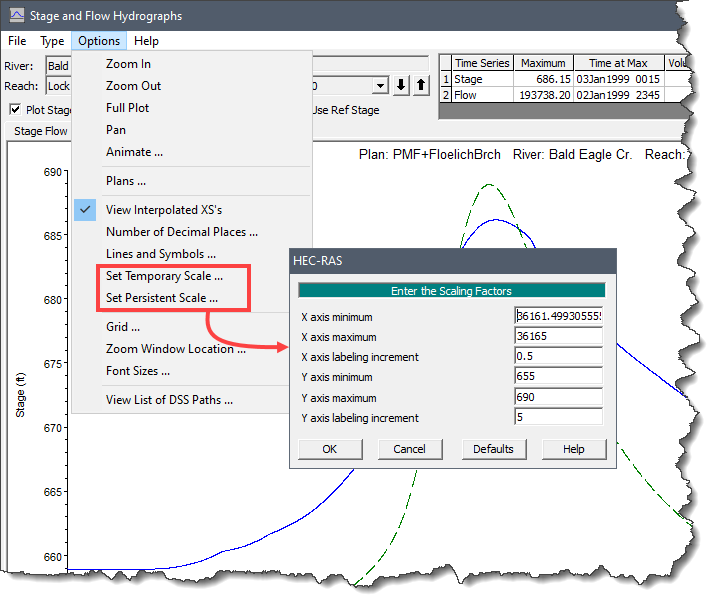
The Set Temporary Scale and Set Persistent Scale options allow the user to define the scaling used for the plot. The user can set the minimum, maximum, and labeling increment for the X and Y axis. Scaling can be set temporarily, or to be persistent (scaling stays constant for all river stations). Persistent scaling is only available for the cross section and rating curve plots. Selecting either of the options will display the HEC-RAS dialog box where the user can enter the scaling factor for minimum, maximum and labeling increment values for the X and Y axis.
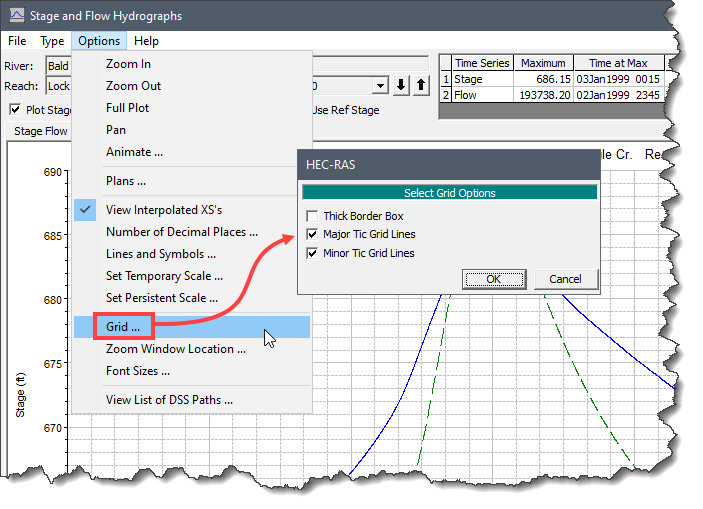
This option allows the user to overlay a grid on top of the graphic plot. Selecting the Grid option will display the HEC-RAS dialog box where users can check the desired checkboxes to display both major and minor tics as well as borders around the plot.
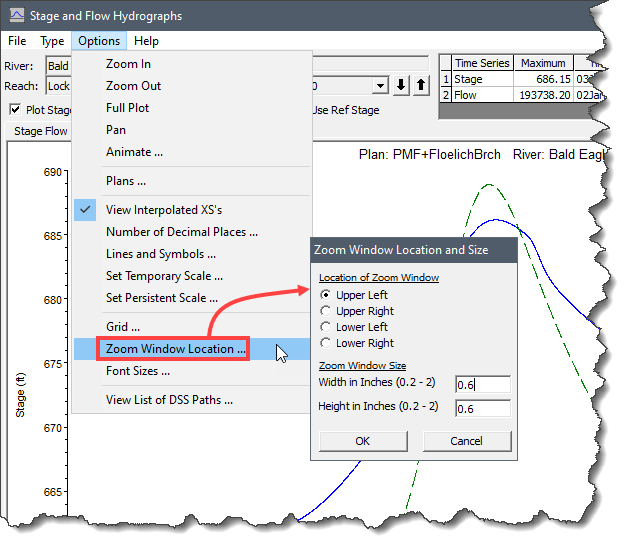
This option allows the user to control the placement and size of the Zoom Window. Selecting the Zoom Window Locations option will display the Zoom Window Location and Size dialog box. In this dialog box, the user can select the corner where the Zoom Window will be displayed as well as enter the height and width for the Zoom Window.
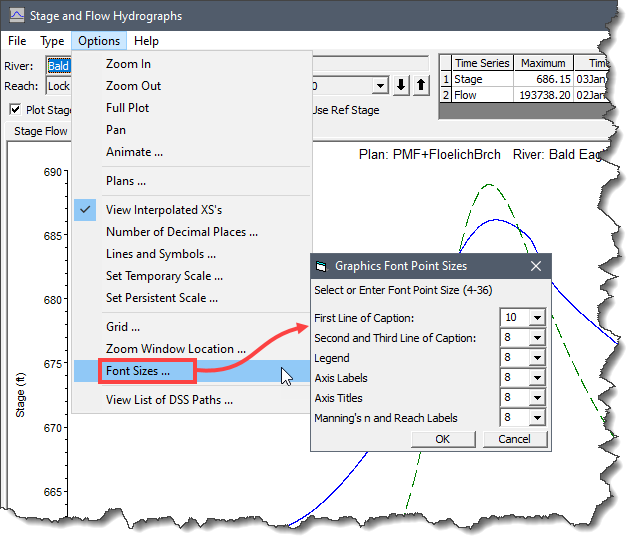
This option allows the user to control the size of all of the text displayed on the graphic. Selecting the Font Sizes option will display the Graphics Font Point Sizes dialog box. In this dialog box, the user can define text size for captions, legend, axis labels and titles, Manning’s n and Reach labels.
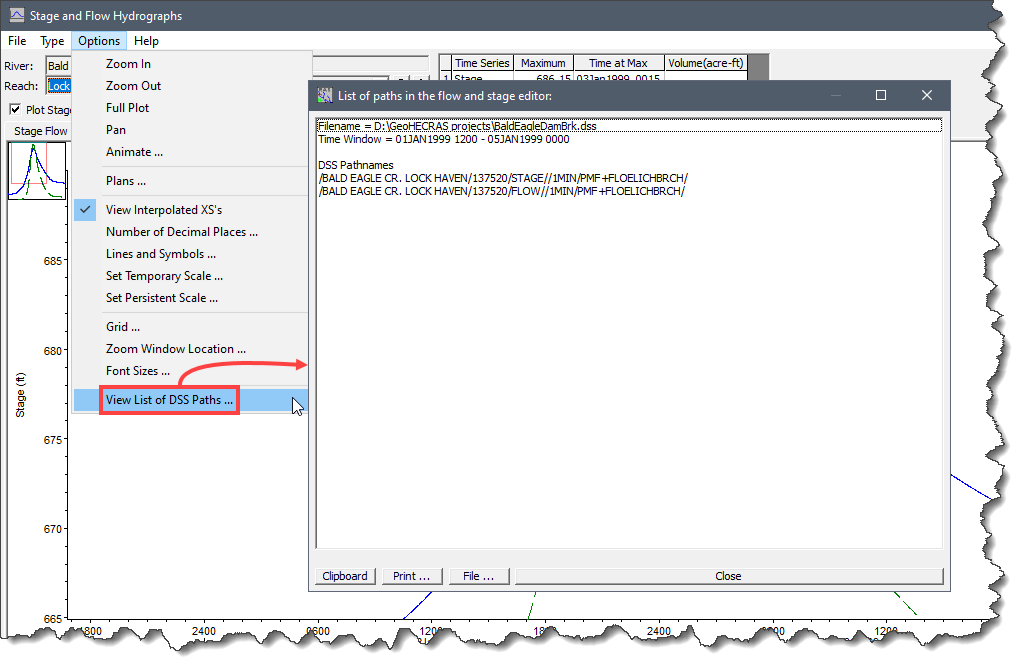
This option allows the user to view the DSS file paths used to define the unsteady flow data. Selecting the View List of DSS Paths option will display the List of paths in the flow and stage editor dialog box that lists the DSS pathnames along with DSS file location.
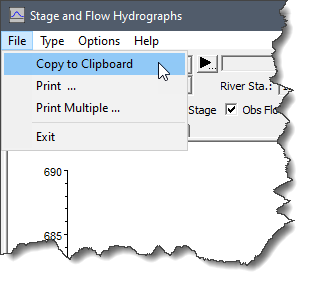
The user can send the graphic plot to the Windows clipboard. Moving a graphic to the clipboard allows that graphic to then be pasted into another piece of software (i.e., a word processor or another graphics program).
To transfer the graphic plot to the Windows clipboard, the user can select the Copy to Clipboard command from the File menu. The graphic plot will automatically be sent to the Windows clipboard.
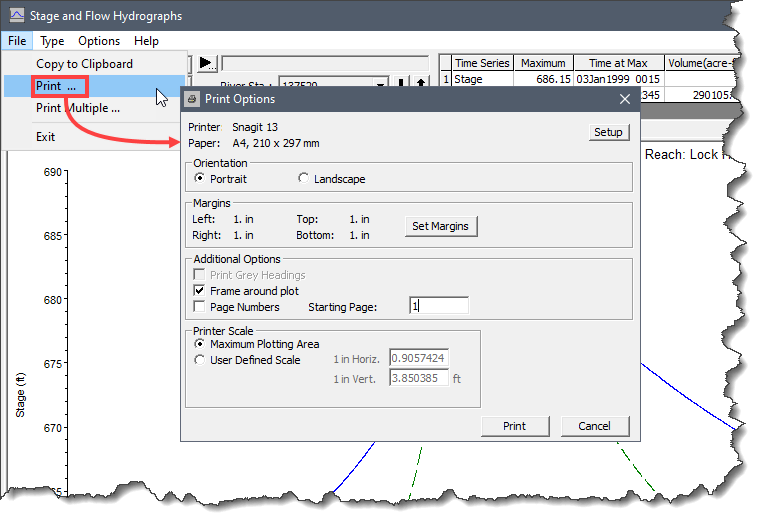
The software also allows the user to send the graphical plots directly to a printer. Selecting the Print command from the File menu will display the Print Options dialog box. This dialog box allows the user to modify the default print options. After selecting the desired options, the user can click the [Print] button. The graphic plot will be sent to the Windows print manager. The print manager will then send the plot to the default printer.
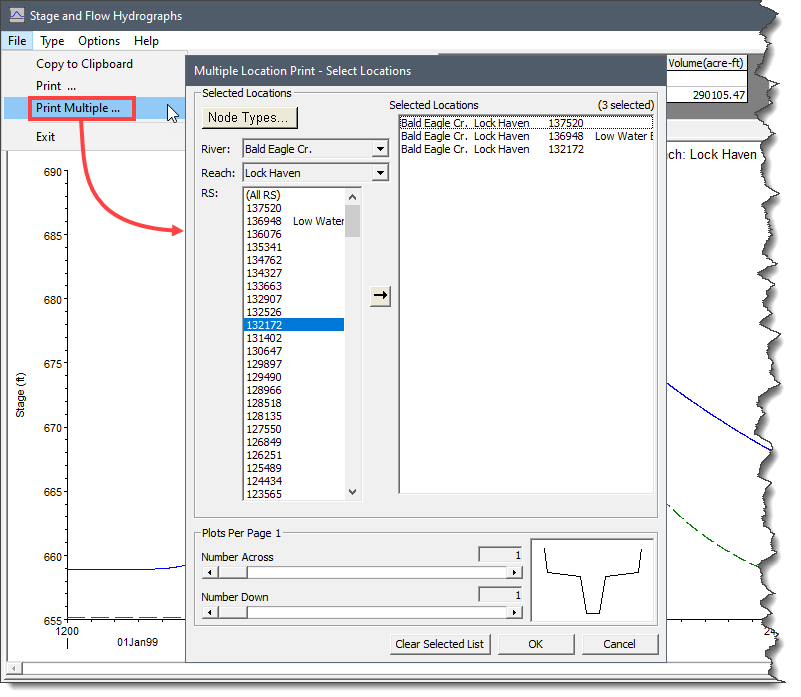
The software also allows the user to print multiple graphic plots at one time. Selecting the Print Multiple command from the File menu will display the Multiple Location Print – Select Locations dialog box. In this dialog box, the user can select the node type and the corresponding river stations whose stage and flow hydrographs are to be printed.


CivilGEO G2 Reviews
4.8/5.0 Rating, Over 230 Reviews

GeoHECRAS is recognized as the top Civil Engineering Design Software with an average of 4.8 out of 5.0 rating from over 230 real user reviews on G2.


We use cookies to give you the best online experience. By agreeing you accept the use of cookies in accordance with our cookie policy.
When you visit any web site, it may store or retrieve information on your browser, mostly in the form of cookies. Control your personal Cookie Services here.


