
Welcome to CivilGEO Knowledge Base
Welcome to CivilGEO Knowledge Base
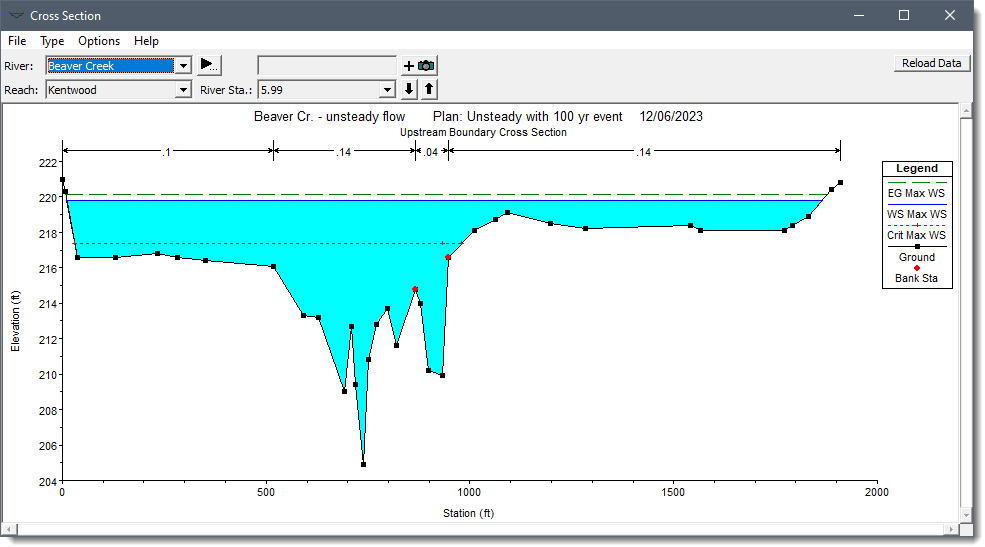
The software can generate cross section plots of the HEC‑RAS steady flow and unsteady flow computational results, displaying the water surface elevation, energy gradeline elevation, critical depth elevation, as well as a velocity distribution plot on the cross section. In addition, the cross section plots can be printed and exported to AutoCAD.
Refer to this article in our knowledge base for additional cross section plot options.
To display the analysis output results in a cross section plot, expand the Cross Sections menu item of the Results ribbon menu and select the Plot Cross Sections command.
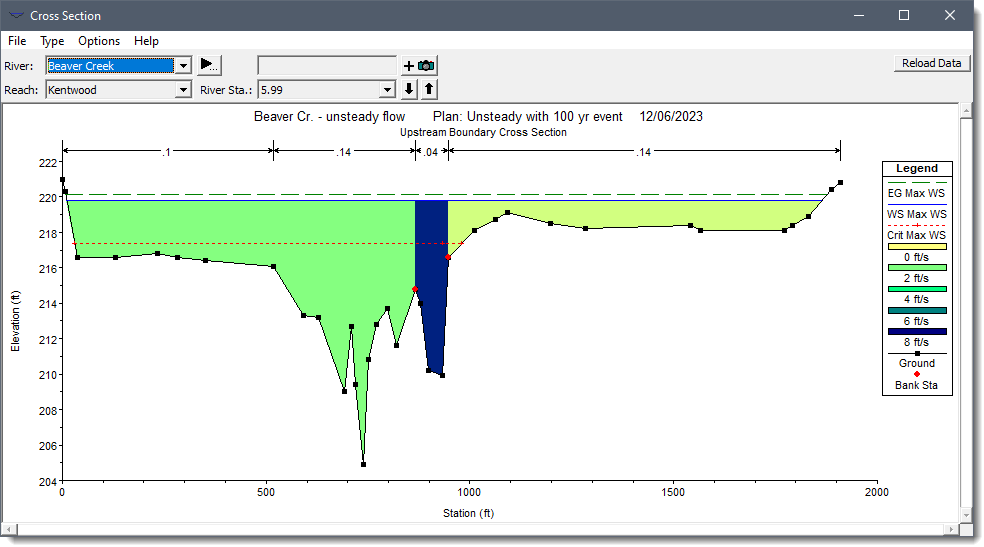
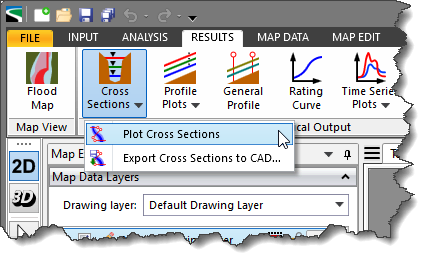 Selecting this command will display the HEC‑RAS analysis results in a cross section plot.
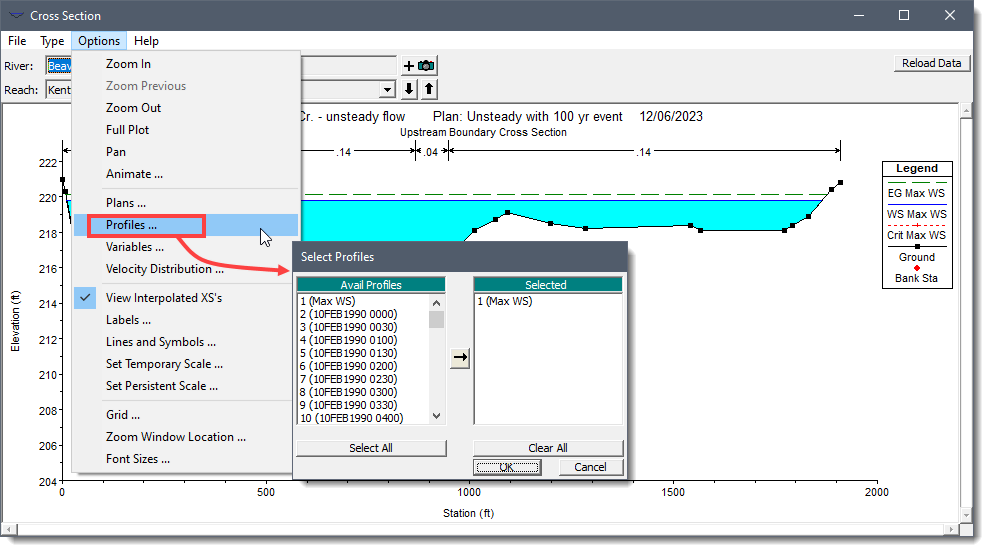
To change what profile should be displayed on the cross section plot, select Profiles from the Options menu. The software will display the Select Profiles dialog box where the user can select the profiles to plot.
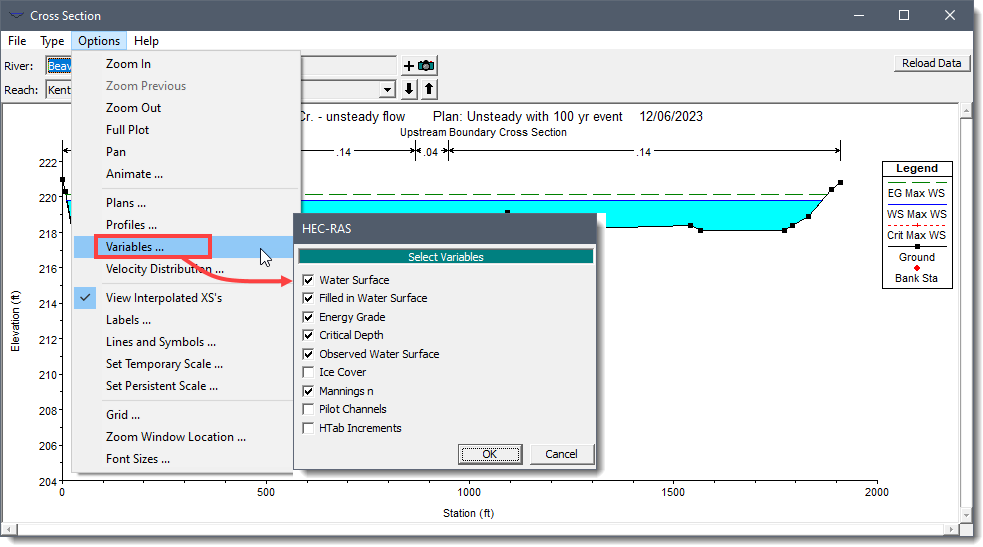
To change the variables to be displayed on the cross section plot, select Variables from the Options menu. The software will display the Select Variables dialog box where the user can select the variables to plot.
In order to plot a velocity distribution on the cross section, the appropriate input data must be defined for computing a velocity distribution for each of the cross sections.
If a velocity distribution computation has been performed, select Velocity Distribution from the Options menu. The software will display the Velocity Distribution Options dialog box.
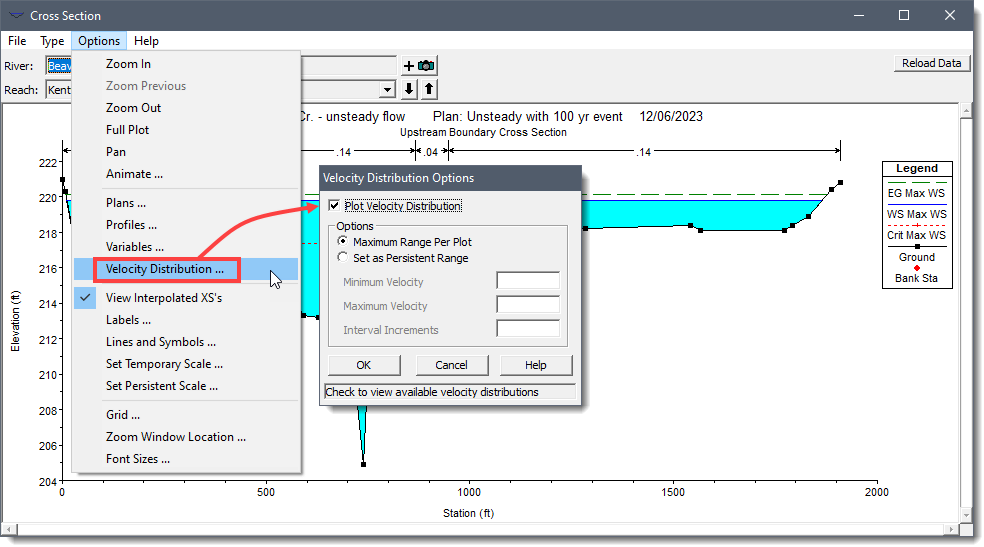
Select the Plot Velocity Distribution checkbox in the displayed dialog box and then click the [OK] button. The velocity distribution will be shown on the cross section plot.
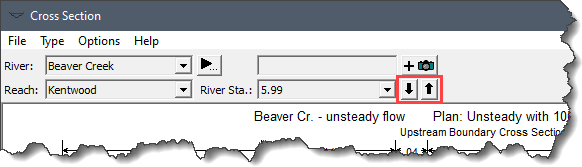
The user can navigate between cross sections using the river reach and cross section navigation controls at the top of the plot window. The user can select the river, reach, and cross section of interest. To move to the next downstream cross section, click the [↓] button. To move upstream, click the [↑] button.
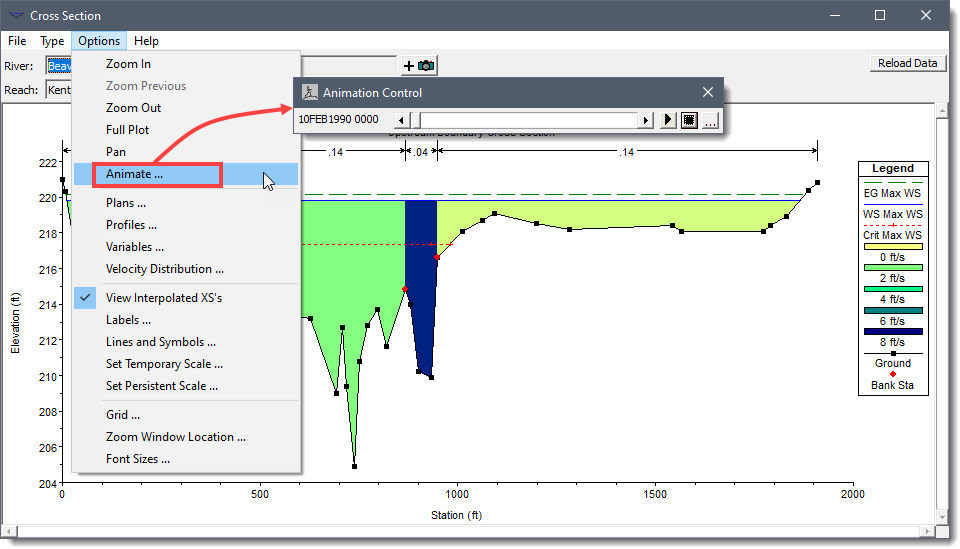
For unsteady flow models, the cross section plots can be animated to show how the water surface changes over time as the flow progresses downstream. To animate the cross section plot results, select Animate from the Options menu. The Animation Control dialog box will be displayed.
To adjust the playback speed of the animation, click on the […] button. The lower half of the Animation Control dialog box will extend downward to show a playback speed control slider.
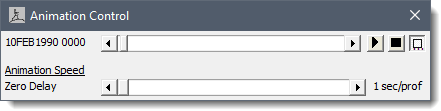
The playback speed control slider adjusts the speed of the animation playback. To slow down the animation, move the slider to the right. To speed up the animation, move the slider to the left.
The cross section plots can be printed with one or more cross sections per page. To print a single current cross section, select Print from the File menu. To print out all or selected cross sections on multiple sheets of paper, select Print Multiple from the File menu. The Multiple Location Print – Select Locations dialog box will be displayed.
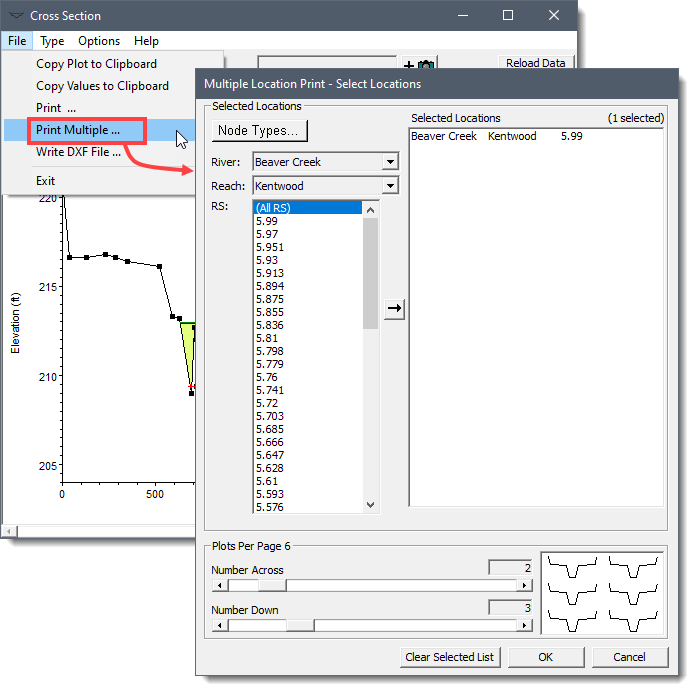
From the displayed dialog box, the user can select which cross sections to be printed, as well as how many cross sections should be printed per single sheet.
The cross section plots can be exported to AutoCAD. To export all or selected cross sections to AutoCAD, select Write DXF File from the File menu. The Multiple Location Print – Select Locations dialog box will be displayed.
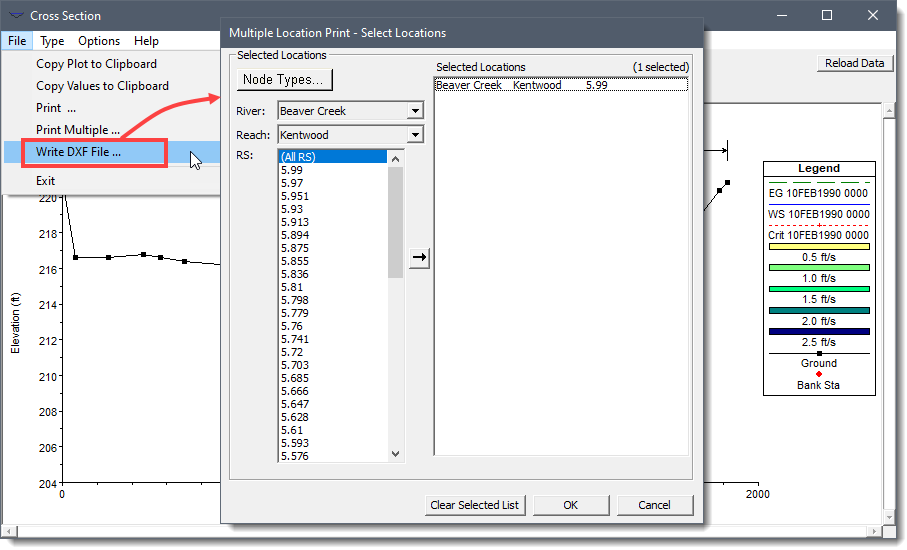
From the displayed dialog box, the user can select which cross sections to be exported.


CivilGEO G2 Reviews
4.8/5.0 Rating, Over 230 Reviews

GeoHECRAS is recognized as the top Civil Engineering Design Software with an average of 4.8 out of 5.0 rating from over 230 real user reviews on G2.


We use cookies to give you the best online experience. By agreeing you accept the use of cookies in accordance with our cookie policy.
When you visit any web site, it may store or retrieve information on your browser, mostly in the form of cookies. Control your personal Cookie Services here.


