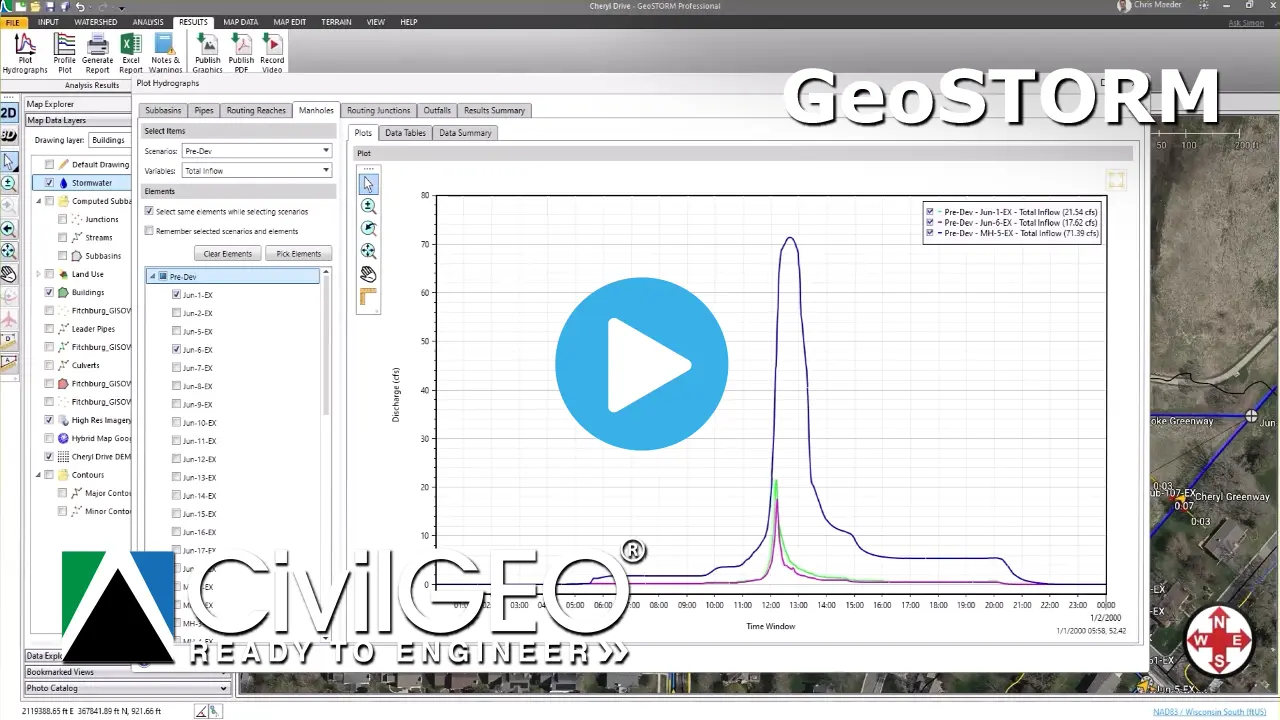
Learn how to visualize stormwater flow results using the Plot Hydrographs command. This tutorial video shows how to display various types of hydrographs, such as discharge, depth, velocity, stage, etc, for subbasins, pipes, junctions, and other elements of the stormwater project.