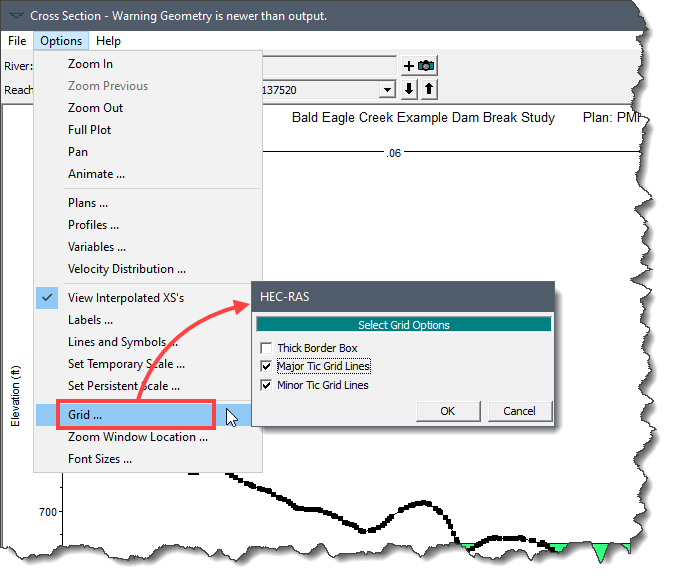
The HEC‑RAS cross section plots can be customized for specific requirements, as described below.
Custom Labels
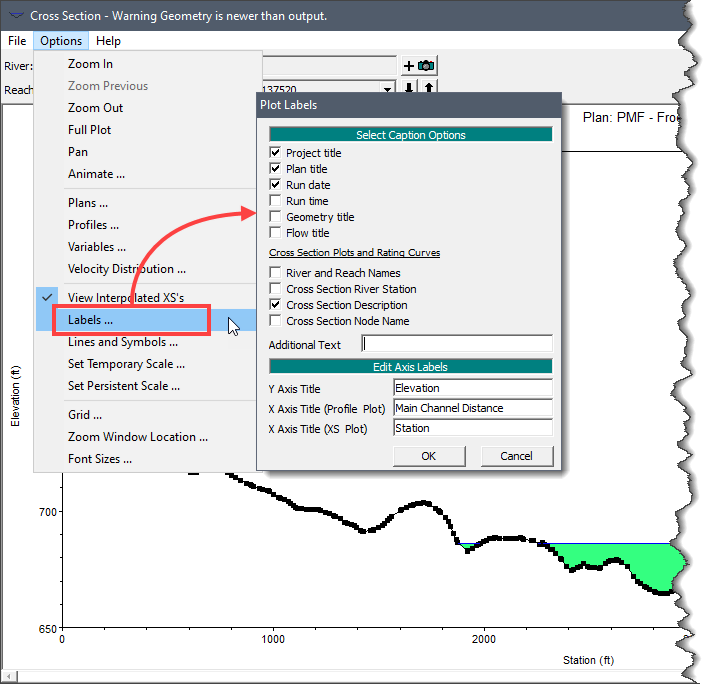
The labels used in the cross section plot can be customized. Select Labels from the Options menu to display the Plot Labels dialog box. This dialog box allows the user to control what labels are displayed as well as change the axes label and plot title text.
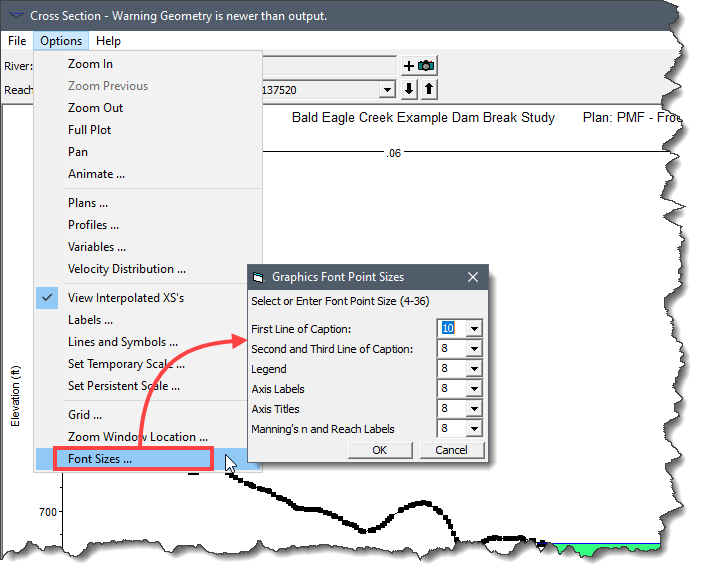
 In addition, the user can change the size of the text displayed on the plot. Select Font Sizes from the Options menu to display the Graphics Font Point Sizes dialog box that allows the font sizes to be specified.
Lines, Symbols, and Fill Styles and Colors
The plotted lines, symbols, and fills can be customized. Select Lines and Symbols from the Options menu to display the Line Style Options dialog box. This dialog box provides numerous stylization and color options for lines, symbols, and fill patterns.
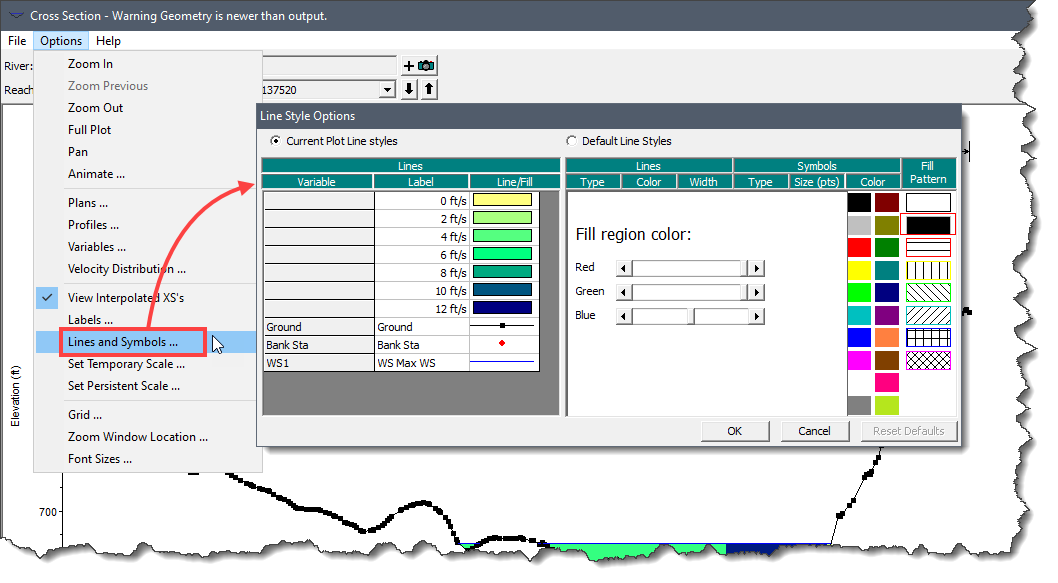 To restore the cross section plot back to the default settings, click the [Reset Defaults] button. The software will then reset the plotted lines, symbols, and fills back to the installed default values.
Specifying a Plot Region
The software allows the user to specify a region of the cross section plot to view. Select Zoom In from the Options menu and the cursor will change to a Magnifying Glass  Zoom tool. Click and drag with the cursor a rectangular region on the cross section plot to view. To zoom back, select Zoom Out or Full Plot from the Options menu to reset the cross section plot view area to the extents of the model data.
For additional control in specifying a region for viewing, select Set Temporary Scaling or Set Permanent Scaling from the Options menu. The HEC-RAS dialog box will be displayed. This dialog box allows the user to specify the starting and ending stations for the horizontal X axis and the minimum and maximum elevations for the vertical Y axis. In addition, the user can specify the axis labeling increment for the defined axes.
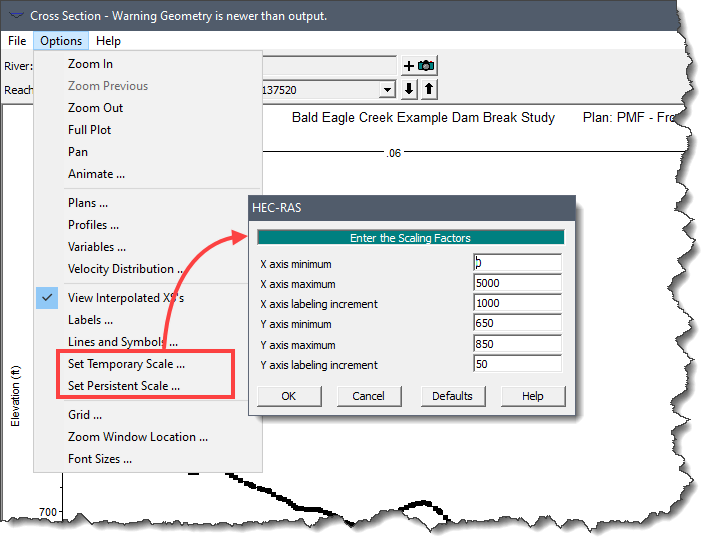 To restore the cross section plot region back to the default settings, click the [Defaults] button. The software will then reset the cross section plot region back to the extents of the model data.
Grid Lines and Border Options
The software allows the user to specify the major and minor grid lines as well as the plot border to be displayed. Select Grid from the Options menu to display the following HEC-RAS dialog box.
