
Welcome to CivilGEO Knowledge Base
Welcome to CivilGEO Knowledge Base
The HEC‑RAS profile plots can be customized for specific requirements, as described below.
The defined cross sections along the selected river reaches can be displayed on the profile plot. Select Options | Landmarks and the following context menu is displayed. Select the options desired for displaying the cross section locations along the river reach. A checkbox will be displayed adjacent to the selected options.
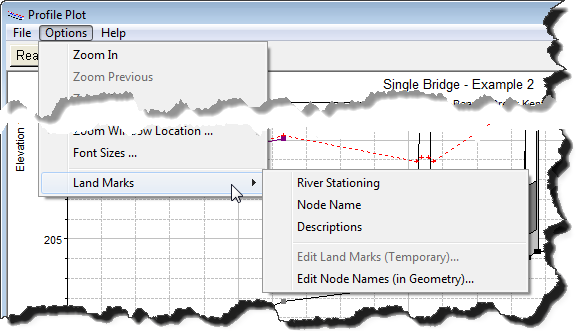
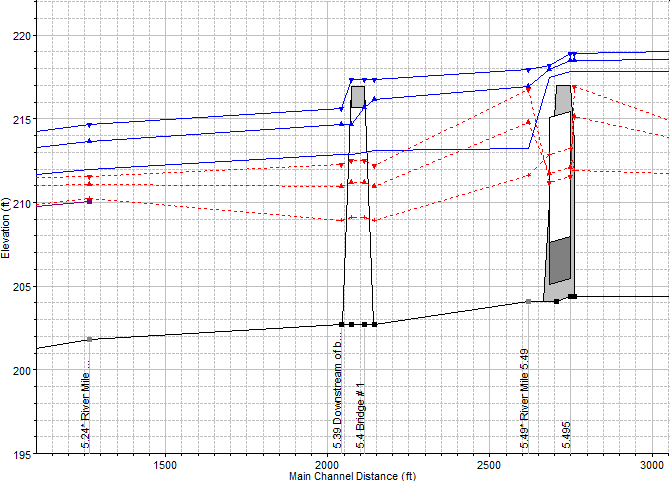
The selected cross section landmark options will then be shown along the bottom of the profile plot.
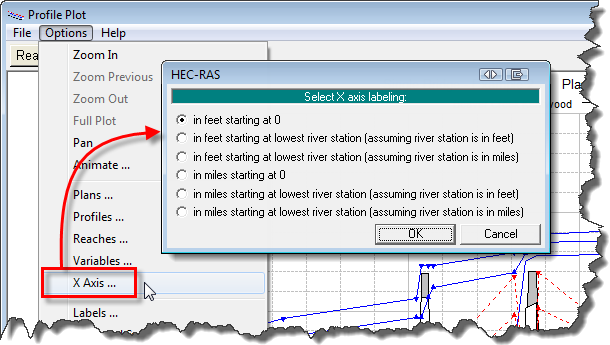
The X axis can be labeled for specific requirements for the river horizontal stationing. Select Options | X Axis to display the X axis labeling dialog box. The units that are displayed in the dialog box are dependent upon the base units selected (i.e., Metric, US) for the project.
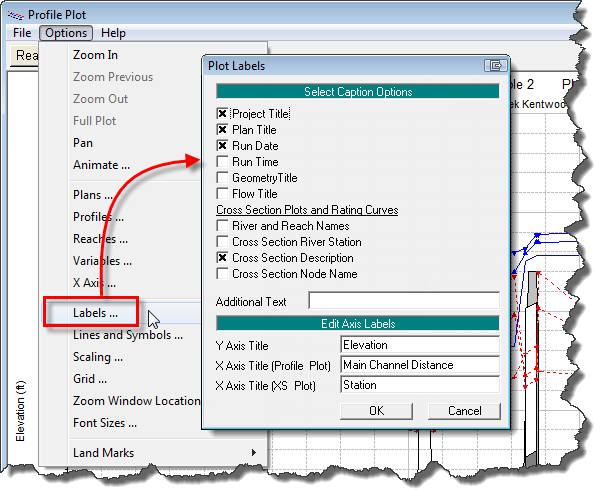
The labels used in the profile plot can be customized. Select Options | Labels to display the Plot Labels dialog box. This dialog box allows the user to control what labels are displayed as well as change the axes label and plot title text.
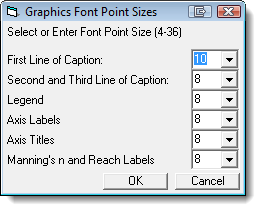
In addition, the user can change the size of the text displayed on the plot. Select Options | Font Sizes to display a dialog box that allows the font sizes to be specified.
The plotted lines, symbols, and fills can be customized. Select Options | Lines and Symbols to display the following dialog box. This dialog box provides numerous stylization and color options for lines, symbols, and fill patterns.
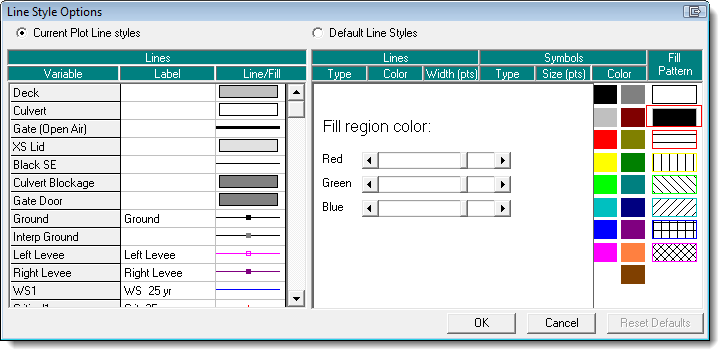
To restore the profile plot back to the default settings, click the [Reset Defaults] button. The software will then reset the plotted lines, symbols, and fills back to the installed default values.
The software allows the user to specify a region of the profile plot to view. Select Options | Zoom In and the cursor will change to a Magnifying Glass ![]() Zoom tool. Click and drag with the cursor a rectangular region on the profile plot for viewing. To zoom back, select Options | Zoom Out or select Options | Full Plot to reset the profile plot view area to the extents of the model data.
Zoom tool. Click and drag with the cursor a rectangular region on the profile plot for viewing. To zoom back, select Options | Zoom Out or select Options | Full Plot to reset the profile plot view area to the extents of the model data.
For further control in specifying a region for viewing. Select Options | Scaling and the following dialog box is displayed. This allows the user to specify the starting and ending stations for the horizontal X axis and the minimum and maximum elevations for the vertical Y axis. In addition, the user can specify the axis labeling increment for the defined axes.
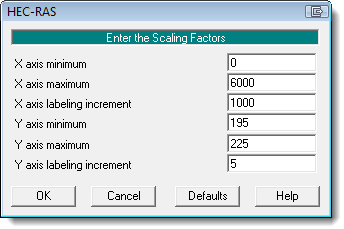
To restore the profile plot region back to the default settings, click the [Defaults] button. The software will then reset the profile plot region back to the extents of the model data.
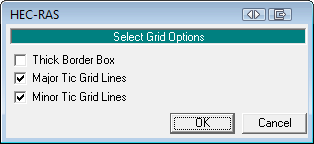
The software allows the user to specify the major and minor grid lines as well as the plot border to be displayed. Select Options | Grid and the following dialog box is displayed.


CivilGEO G2 Reviews
4.8/5.0 Rating, Over 230 Reviews

GeoHECRAS is recognized as the top Civil Engineering Design Software with an average of 4.8 out of 5.0 rating from over 230 real user reviews on G2.


We use cookies to give you the best online experience. By agreeing you accept the use of cookies in accordance with our cookie policy.
When you visit any web site, it may store or retrieve information on your browser, mostly in the form of cookies. Control your personal Cookie Services here.


