
Welcome to CivilGEO Knowledge Base
Welcome to CivilGEO Knowledge Base
The GeoHECRAS software can generate breach time series plots of the HEC‑RAS unsteady flow computational results for various structure types such as Inline structures, lateral structures, and SA/2D Area Connections. In addition, the time series plots can be copied to the Windows clipboard.
If the user has performed an unsteady flow analysis, then breach time series plots will be available for viewing key information about the breach.
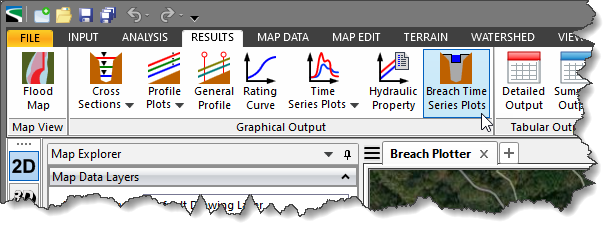
To view a breach time series plot, follow the steps below:
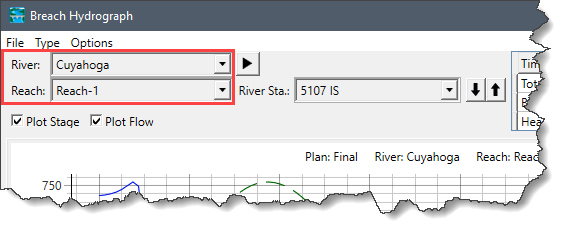
For an HEC‑RAS model with multiple river reaches, the user can select one or more river reaches to plot. The River and Reach dropdown combo boxes display a listing of the river and corresponding reaches contained within the model.
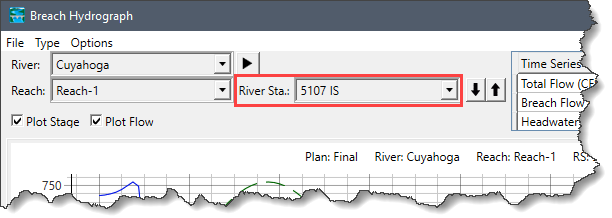
The River Station (River Sta.) dropdown combo box displays a listing of all the river stations contained within the selected reach. The user can select the river station to plot the hydrograph. To move to the next downstream or upstream river station, click the [↓] and [↑] buttons.
The Type menu of the Breach Hydrograph dialog box allows the user to select the specific structure type to view breaching information. This menu item includes the following structure types:
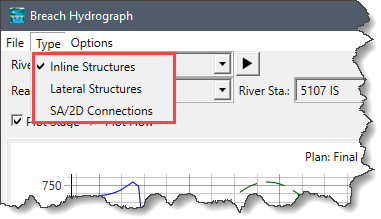
Once a Breach Hydrograph Type is selected, the software will only load that type of structure, and the ones that have breach information. By default, the plot comes up with a type of inline structure selected.
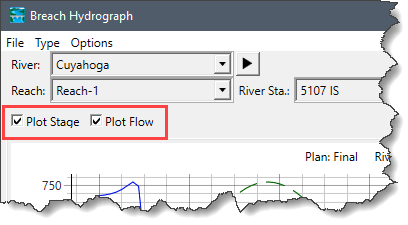
The Breach Hydrograph dialog box provides several options for changing the viewpoint of the stage and flow hydrographs. The Plot Stage and Plot Flow checkboxes allow the user to plot the stage and flow hydrographs, respectively. The user can check both checkboxes to plot both hydrographs simultaneously.
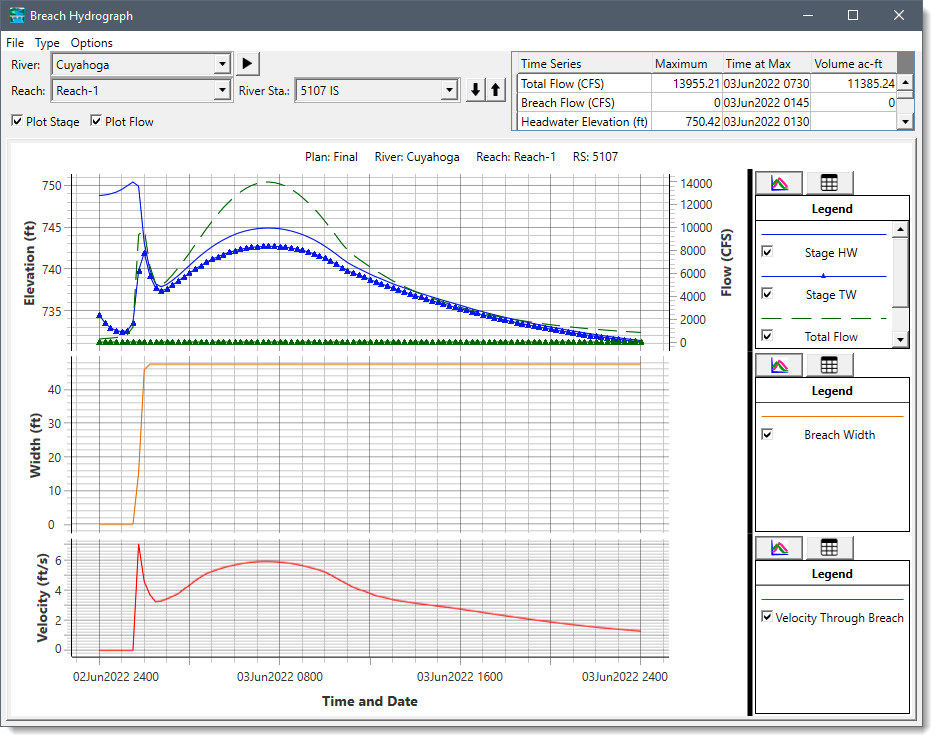
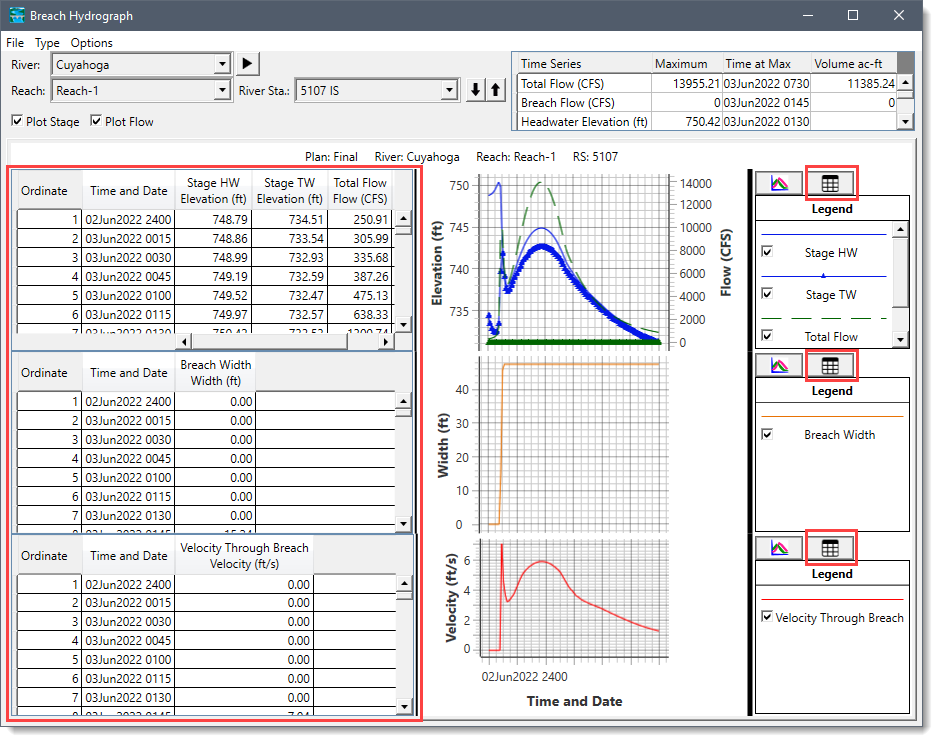
In the Breach Hydrograph plot, the software displays three simultaneous plots and a table within the same window. By default, the plot will come up with a summary table at the top, then three plots as given below:
The summary table of the dialog box provides statistics about the hydrograph plots in a tabular format. The table’s Maximum, Time at Max, and Volume ac-ft columns show the peak of total flow, breach flow, and headwater elevation, as well as the time of peak and volume, respectively.
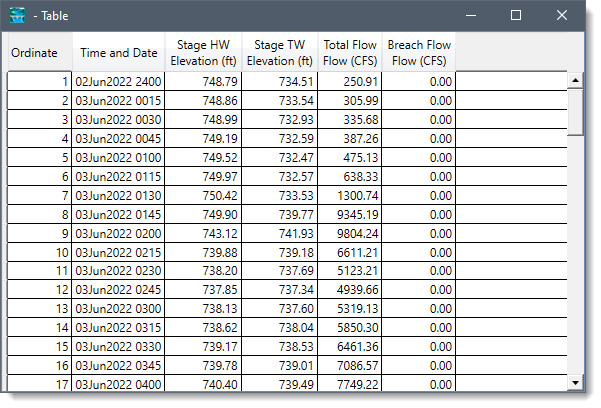
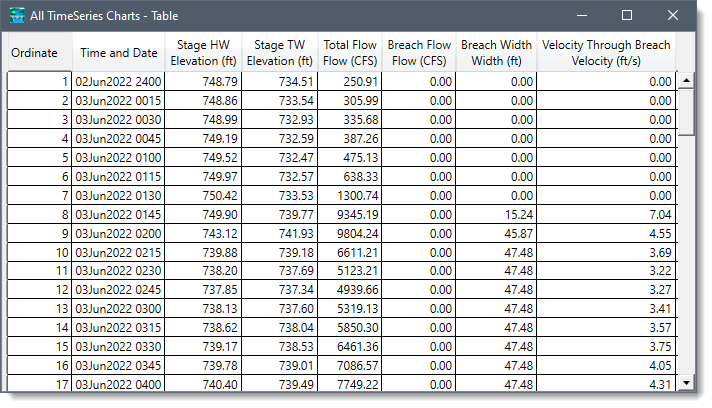
In addition, there is a Table tab just right of the breach hydrograph plot. When the Table tab is selected, a detailed table will appear on the left half of the window, while the plot appears on the right side. This table contains all of the time series data being shown in the plots. Note that the user can adjust the size of both the table and plots.
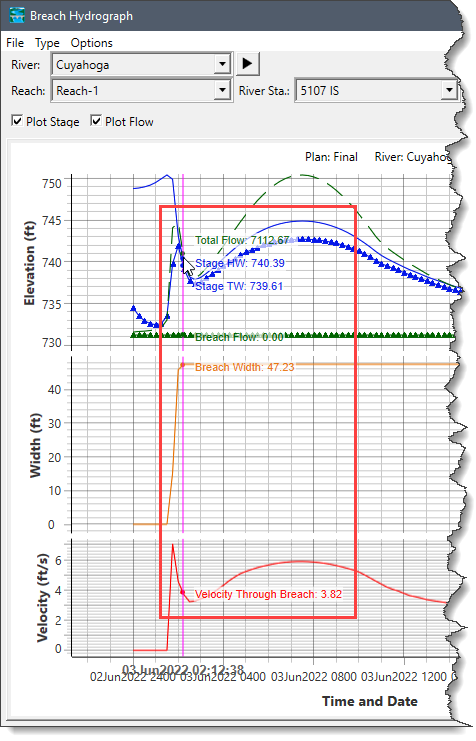
If the user left-clicks or hovers the mouse over the graphic plot, a series of “Bobbers” along with values will appear on top of each line. This feature is useful for obtaining the magnitude of each piece of data at the same point in time.
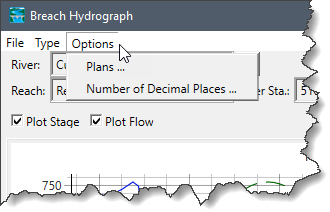
The Options menu of the Breach Hydrograph dialog box provides two options for viewing the graphic plots: Plans and Number of Decimal Places.
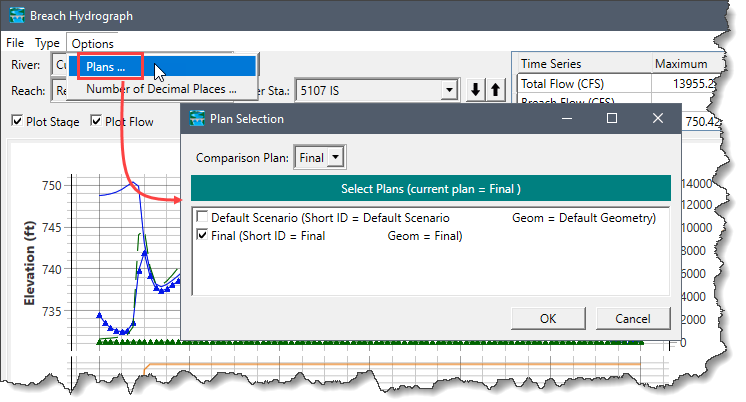
The Plans option allows the user to select multiple scenarios to plot. Selecting this option will display the Plan Selection dialog box, which allows the user to select multiple scenarios for comparison.
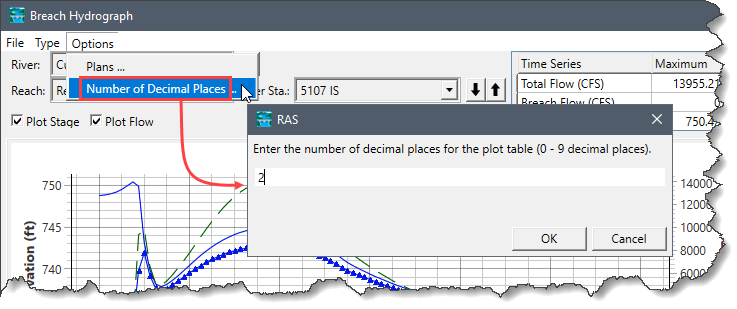
The Number of Decimal Places option allows the user to define the number of decimal places for the numerical values shown on the plot and in the tables. Selecting this option will display the RAS dialog box, which allows the user to enter a value (between 0 and 9) that specifies the number of decimal places.
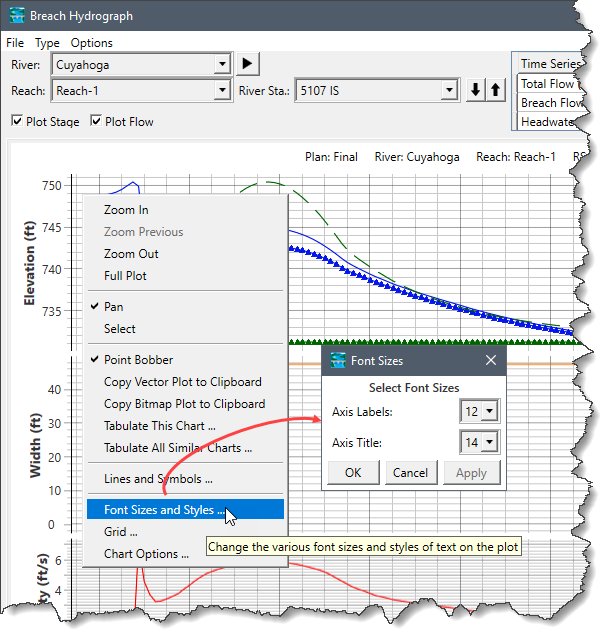
In addition, the right-click context menu of the graphic plot will display various options as shown below.
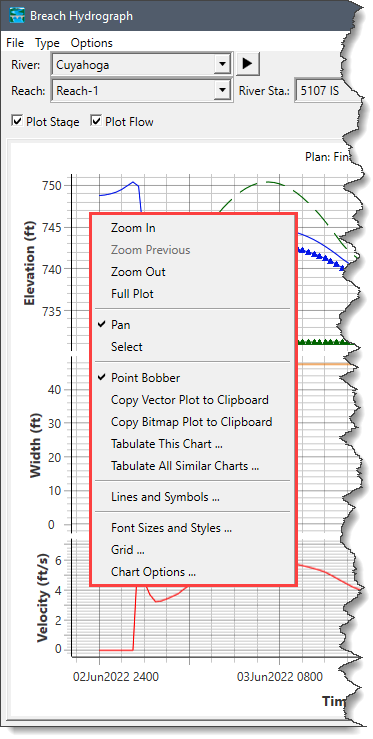
This option allows the user to zoom in on a portion of the graphic plot.
This option allows the user to revert to a previous level of zoom on the graphic plot.
This option causes the software to double the size of the currently zoomed-in graphic plot.
This option causes the software to re-display the graphic plot at its original size.
This option allows the user to move the graphic plot around. After selecting the Pan option, the user can press and hold the mouse button over the graphic plot, and then move the graphic plot in the desired direction.
This option allows the user to enable or disable the point bobbers on the graphic plot.
The Copy Vector Plot to Clipboard and Copy Bitmap Plot to Clipboard options allow the user to send the graphic plot to the Windows clipboard. Moving a graphic to the clipboard allows that graphic to then be pasted into another piece of software (i.e., a word processor or another graphics program).
The Tabulate This Chart option causes the software to display a selected chart (Elevation vs. time, Breach bottom width vs. time, or Average velocity vs. time) one at a time on the graphic plot in a table.
The Tabulate All Similar Charts option causes the software to display all similar charts on the graphic plot in a single table.
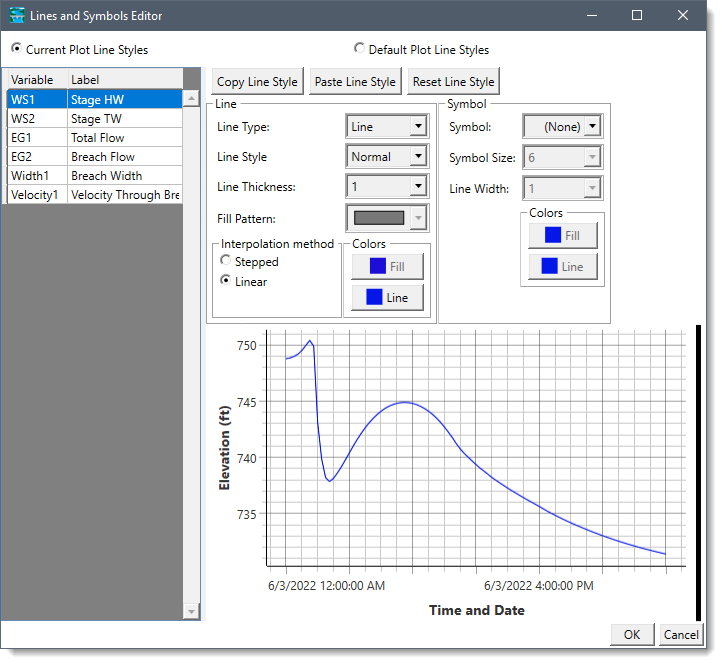
This option allows the user to customize the line types, line colors, line widths, symbol types, symbol sizes, symbol colors, fill patterns, and line labels.
This option allows the user to control the size of axis labels and title text displayed on the graphic plot.
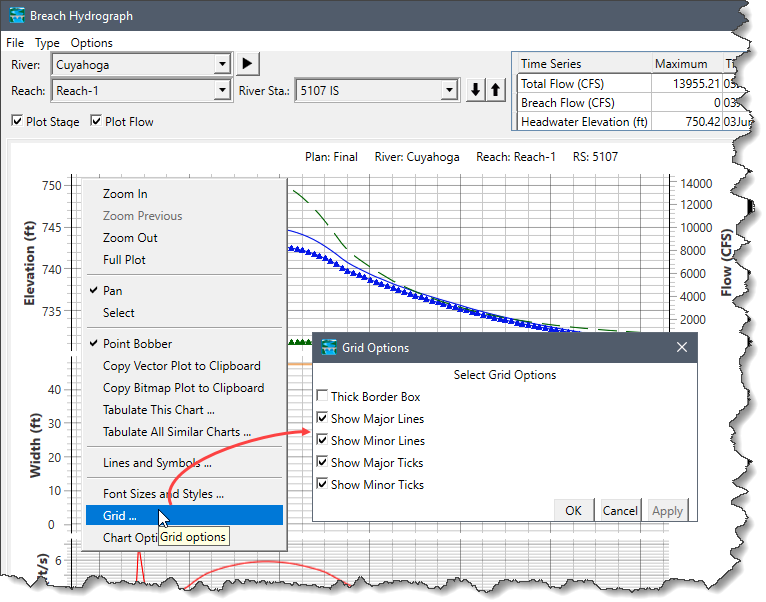
This option allows the user to overlay a grid on top of the graphic plot. Selecting the Grid option will display the Grid Options dialog box where users can check the desired checkboxes to display both major and minor lines and tics as well as borders around the plot.
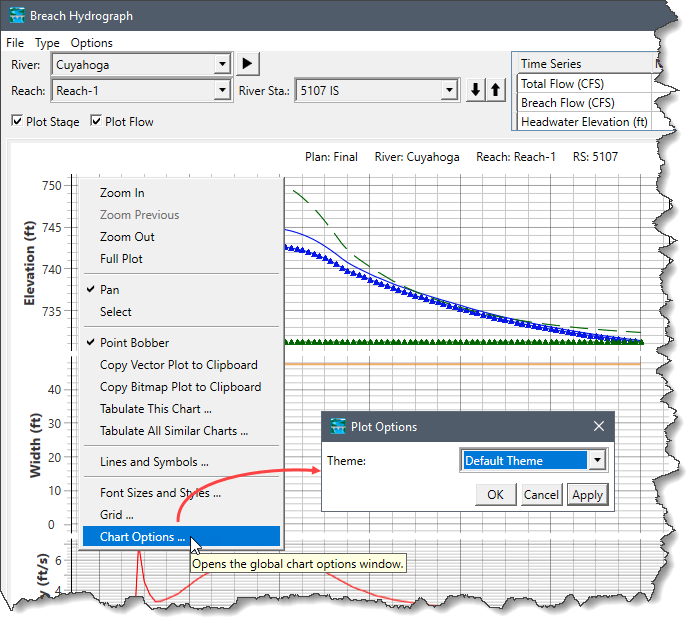
This option allows the user to change the visual appearance of the graphic plot. Selecting the Chart Options will display the Plot Options dialog box where users can select the desired theme for the graphic plot.


CivilGEO G2 Reviews
4.8/5.0 Rating, Over 230 Reviews

GeoHECRAS is recognized as the top Civil Engineering Design Software with an average of 4.8 out of 5.0 rating from over 230 real user reviews on G2.


We use cookies to give you the best online experience. By agreeing you accept the use of cookies in accordance with our cookie policy.
When you visit any web site, it may store or retrieve information on your browser, mostly in the form of cookies. Control your personal Cookie Services here.


