
Welcome to CivilGEO Knowledge Base
Welcome to CivilGEO Knowledge Base
In hydraulic modeling, inline structures refer to hydraulic structures that are placed within a river or channel reach. These structures are designed to modify the flow characteristics of the watercourse, such as its depth, velocity, and conveyance capacity. Inline structures are incorporated into the hydraulic model to accurately represent their influence on river flow. By defining the geometry, characteristics, and operational rules of these structures, engineers can simulate and analyze the hydraulic behavior of rivers and channels under various conditions, such as floods or dam releases.
This article describes how the Inline Structure Data command of GeoHECRAS can be used to view or modify the data associated with inline structures.
Follow the steps below to view or modify inline structure data in GeoHECRAS:
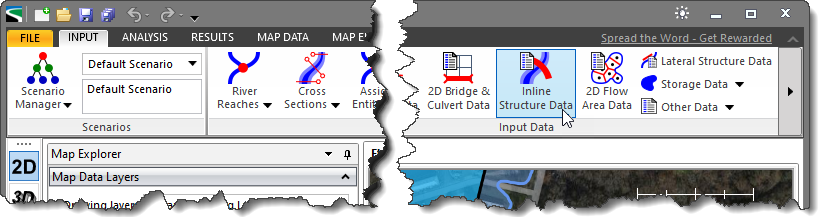 Alternatively, from the Input ribbon menu, expand the Inline Structures dropdown menu and select the Inline Structure Data menu item.
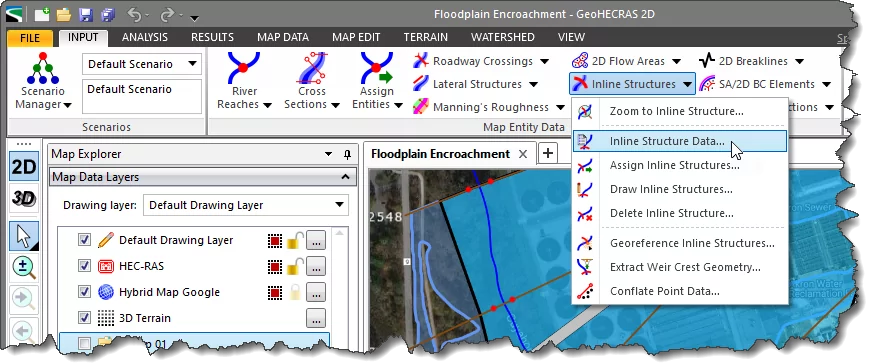
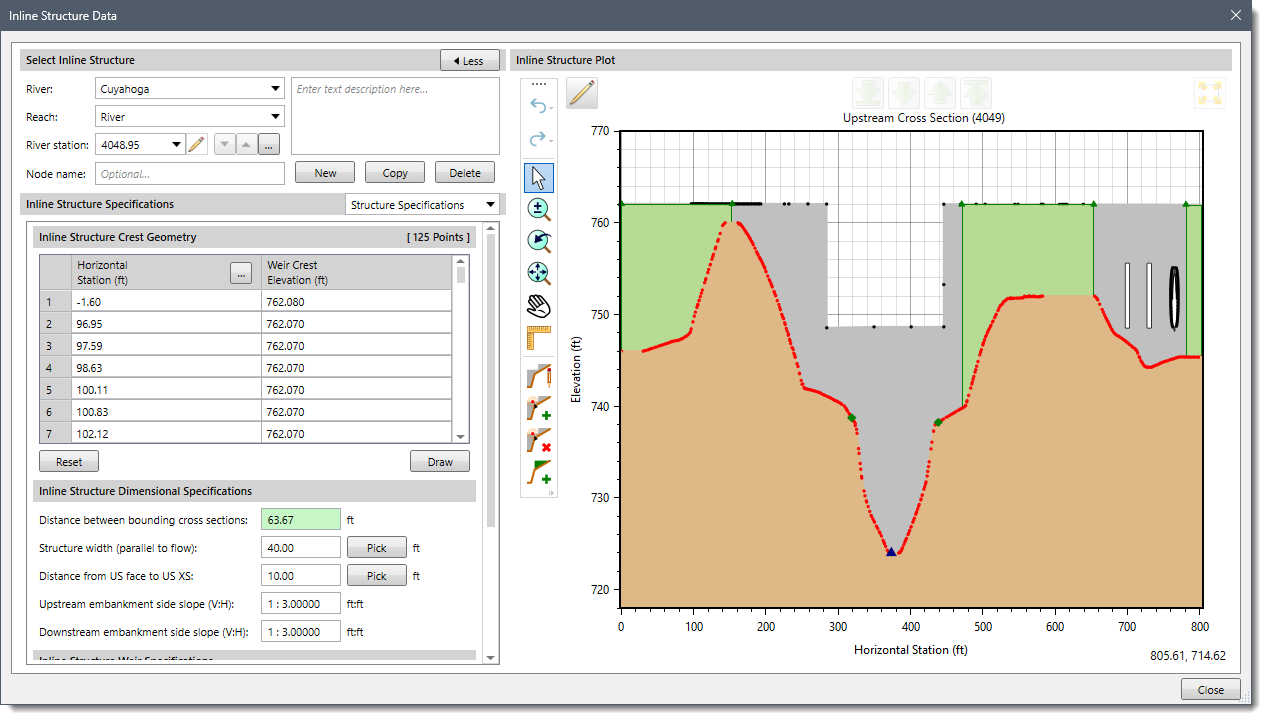
The following sections describe how to define the inline structure data and interact with the above dialog box.
The Select Inline Structure section allows the user to switch between inline structures.
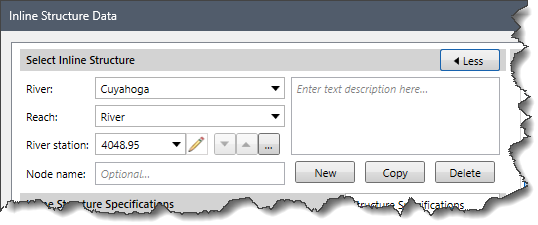
This section contains the following options:
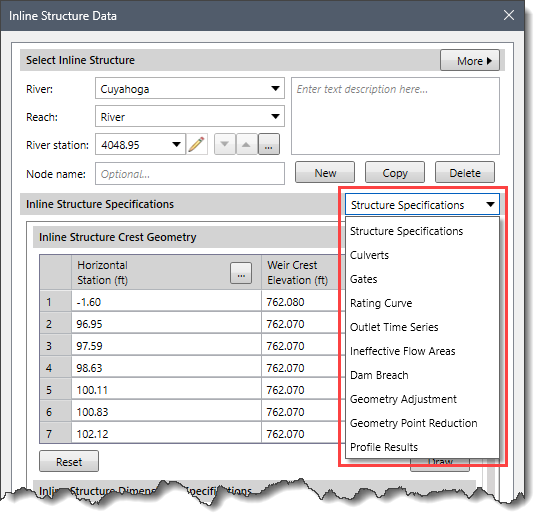
Once the inline structure is selected, the user can switch between the following panels from the Inline Structure Specifications dropdown panel selector to view or modify the associated inline structure data.
This dropdown panel selector contains the following data panel entries, which allow the user to define inline structure data:
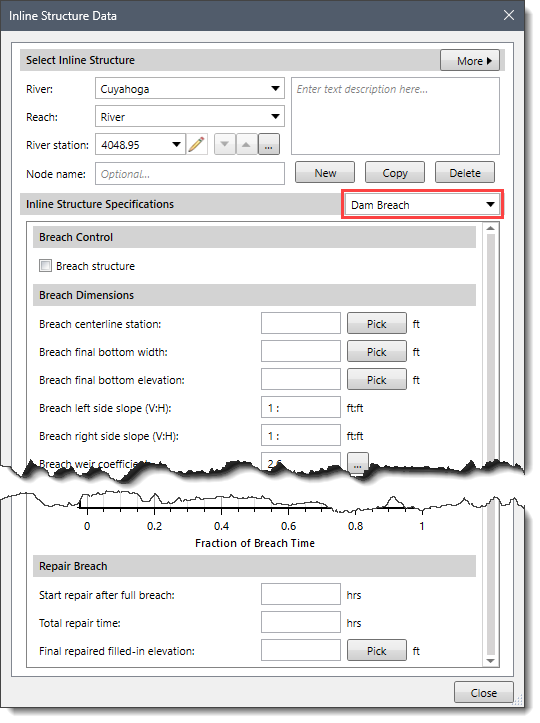
This data panel is used to define the specifications of the inline structure.
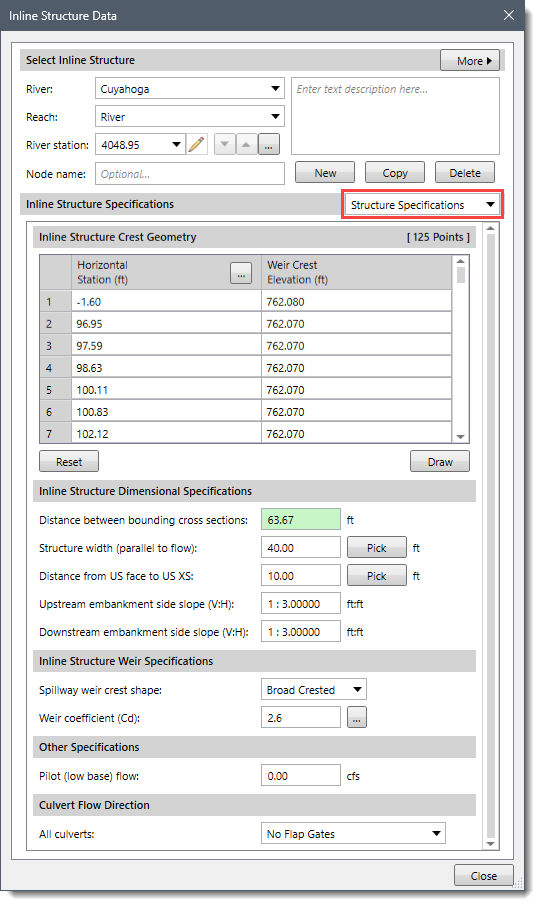
This data panel contains the following sections:
This section provides a data table for entering and editing inline structure top of structure geometry (weir geometry). This data table is used to describe the embankment blocking the stream as well as any uncontrolled overflow weirs. The geometry of the inline structure is entered from the left to right station looking in a downstream direction. The user enters stations and elevations for the top of the embankment and weir. The stationing does not have to match the ground stations of the bounding upstream cross section, but it must be based on the same origin. Everything below the defined crest geometry elevations will be filled-in down to the ground. The […] button at the Horizontal Station column header allows the user to select the horizontal station of the inline structure from the Map View. The [Draw] button is used to draw weir crest geometry on the Inline Structure Plot. The [Reset] button resets the inline structure crest geometry on the Map View.
This section provides the following options to define the dimensions of the inline structure:
This section provides the following parameters to define spillway flow through the inline structure:
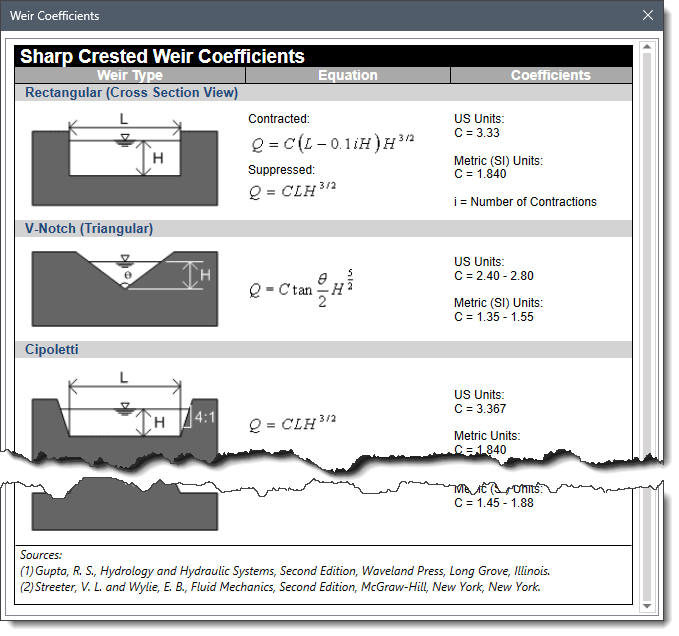 For an ogee shaped spillway, defining Spillway Approach Height and Design Energy Head, and clicking on the [Compute] button causes the software to calculate the weir coefficient at the design discharge corresponding to the design head.
This section contains an optional Pilot (low base) flow field, which is used only for unsteady flow computations. This entry defines the minimum flow that will be released from the structure. The HEC-RAS unsteady flow computations require no cross sections to go dry during the simulation. Therefore, if water is not flowing over the spillway at an inline structure, the user can use this field to ensure that there is always some minor flow going through the structure.
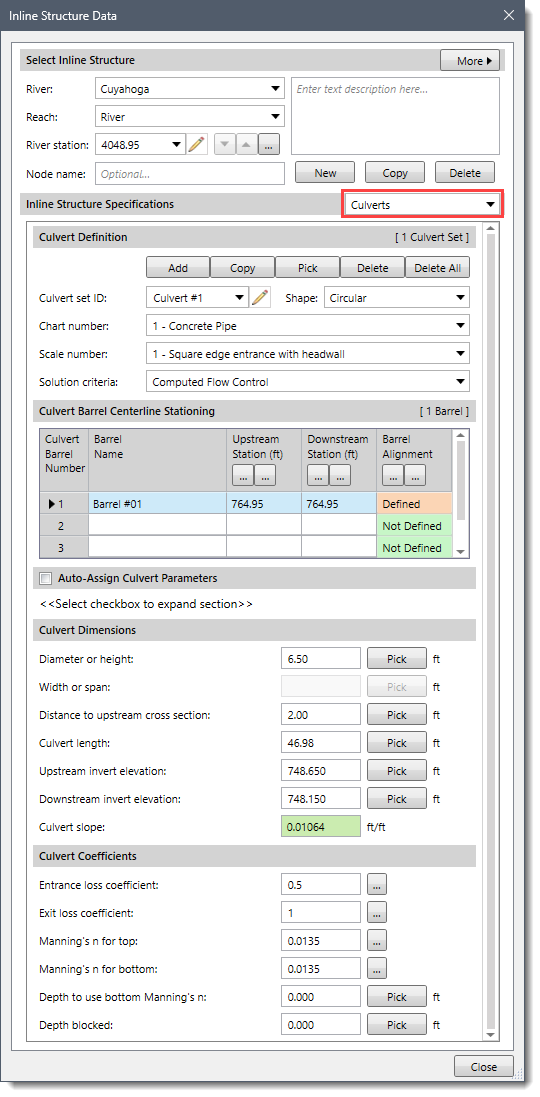
In addition to the weir geometry, inline structures can include culverts. These culverts typically have flap gates to prevent flow reversal so that the flood in the main river channel does not flow out into the overbank areas.
The following flap gate options are available to describe culvert flow:
In HEC-RAS, culverts in inline structures can be modeled using the appropriate culvert geometry, including the shape, size, and slope of the culvert, as well as other relevant parameters such as roughness coefficients and inlet control conditions. These parameters can further be used for the simulation of water flow through the culvert and the analysis of hydraulic performance, such as water surface profiles, flow rates, velocities, and energy losses. Refer to this article in our Knowledge base to learn how to define culverts using the Culverts panel.
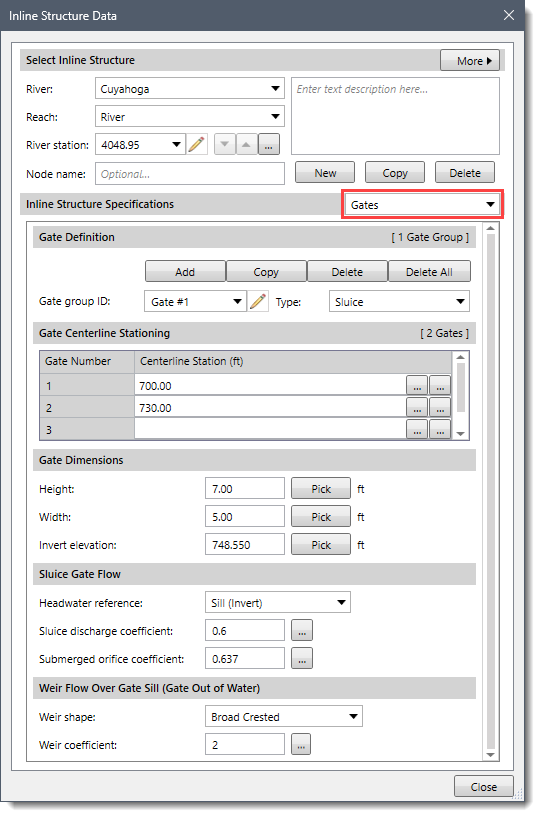
Inline structures are hydraulic structures that are placed along a river channel or a conduit to control the flow of water. Gates are used within these structures to regulate the water flow by opening or closing them. Some common types of gates used in inline structures are Sluice Gates, Radial Gates, etc. Refer to this article in our Knowledge base to learn how to define gates using the Gates panel.
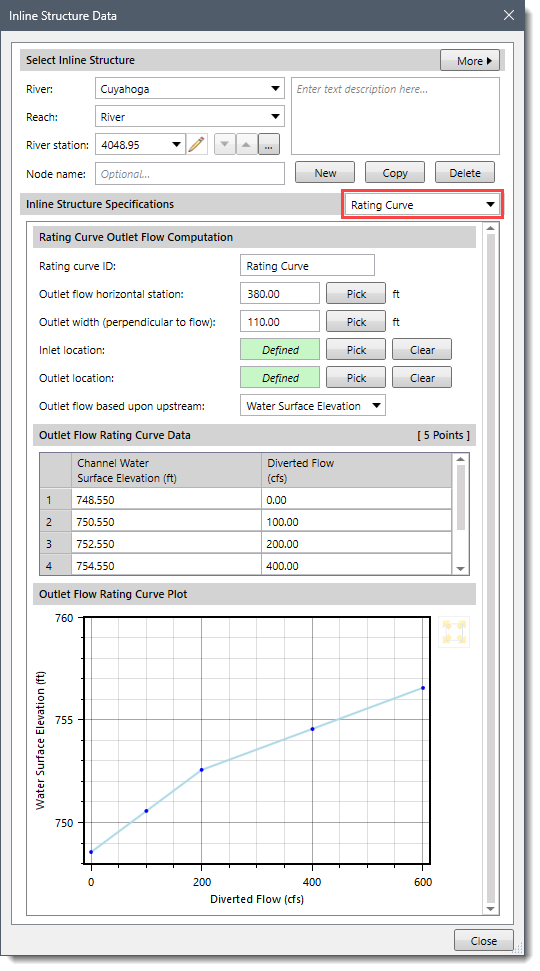
In HEC-RAS, the rating curve is a fundamental concept used to relate water surface elevations (stage) to corresponding discharge (flow rate) in inline structures. It provides a functional relationship between the water level and the flow capacity of a particular structure. The rating curve is typically derived through a combination of field data collection, hydraulic modeling, and analysis. It represents the hydraulic performance of the inline structure and is specific to its geometry, dimensions, and operational characteristics.
This data panel contains the following sections:
This section provides the following options that are used to define rating curve computations:
The rating curve can be expressed in the form of a table under the Outlet Flow Rating Curve Data section and its corresponding plot under the Outlet Flow Rating Curve Plot section. The graph or a table shows the relationship between water surface elevation (stage) and the corresponding discharge (flow rate) passing through the structure.
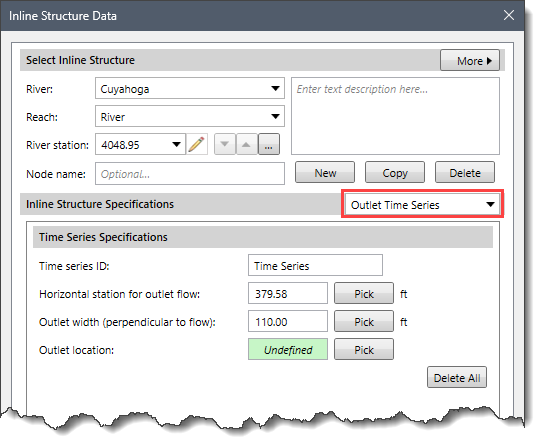
In HEC-RAS, the outlet time series for inline structures refers to the hydraulic data recorded at the downstream end of a structure or a reach in a river or channel model. Inline structures are typically defined as structures that are located within a river reach, such as bridge piers, culverts, weirs, or gates. The outlet time series for an inline structure provides information about the flow rate, water level, velocity, or other hydraulic parameters at the downstream end of the structure over a specified time period. It is generated as part of the HEC-RAS simulation and represents the hydraulic response of the inline structure to the input hydrologic and hydraulic conditions.
This data panel contains the following section:
This section contains the following options:
The [Delete All] button can be used to clear all the data specified within this section.
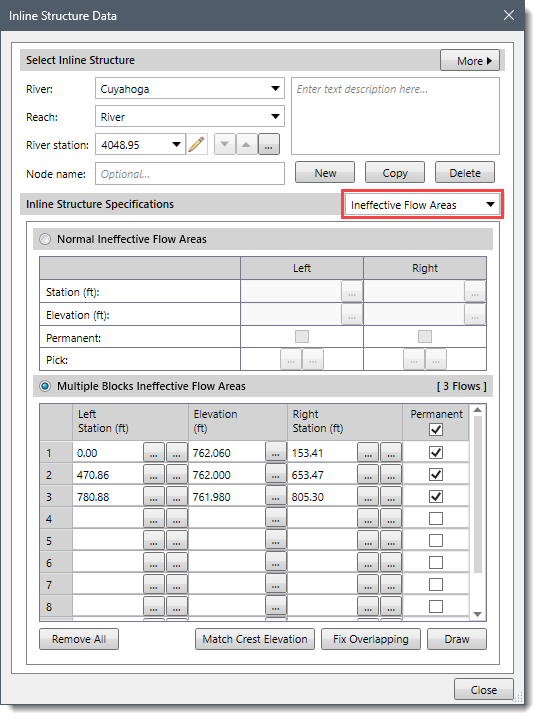
Ineffective flow areas allow the user to define areas of the cross section that will contain water that is not actively being conveyed. Ineffective flow areas are often used to describe portions of a cross section in which water will pond and the velocity of that water, in the downstream direction, is close to zero. This water is included in the storage calculations and other wetted cross section parameters but is not included as part of the active flow area. When using ineffective flow areas, no additional wetted perimeter is added to the active flow area. Refer to this article in our knowledge base to learn how to define ineffective flow areas using the Ineffective Flow Areas panel.
In order to plan for the possibility of a dam break, dam breach information is entered to simulate the dam break. The dam breach data is only used for unsteady flow models and is ignored in steady flow models. Refer to this article in our knowledge base to learn how to define dam break data using the Dam Breach panel.
Using this data panel, the user can adjust the geometry of the inline structure at any time during the modeling. Typically, this panel is used to revise the inline structure geometry where there is insufficient terrain data available to adequately define the inline structure geometry.
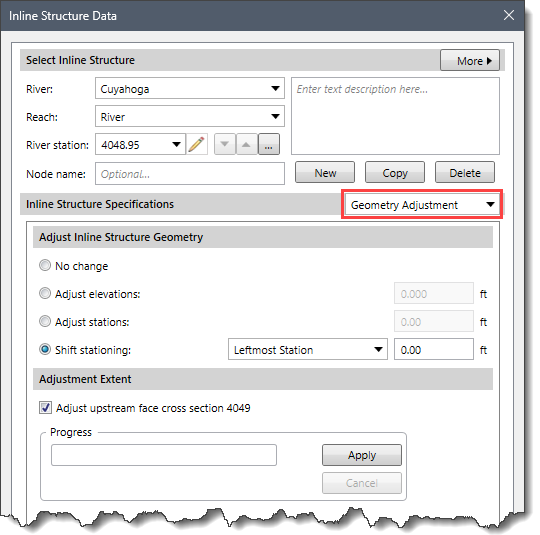
This data panel contains the following sections:
This section allows the user to define the type of adjustment to be applied to the inline structure geometry.
This section contains the following options:
This section is used to select which inline structure and river reaches are to be changed by the specified adjustment. If bridge structures or inline structures are defined for selected reach(s), then their corresponding cross section geometry is also adjusted. Clicking the [Apply] button applies the defined inline structure adjustment method.
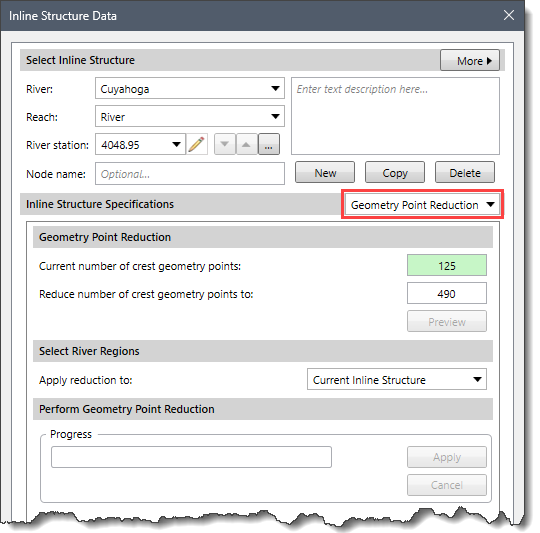
This data panel allows the user to automatically filter out unnecessary station elevation. HEC-RAS limits the number of geometry points for cross sections, lateral structures, high chord and low chord geometry of cross section, and inline structures to a maximum of 500 geomtry points. These point limitations may appear sufficiently large, but when these HEC-RAS entities are computer generated from Light Detection and Ranging (LiDAR) or Digital Elevation Models (DEMs) or data is acquired with equipment such as an echo sounder, the number of data points can be fairly high. Refer to this article in our knowledge base to learn how to implement geometry point reduction using the Geometry Point Reduction panel.
This data panel allows the user to select the analysis results on the inline structure plot. The table displayed under the Profile Results section lists all of the analyzed water surface profiles for the steady state and maximum water surface for the unsteady state. This allows the user to specify for which profiles the results should be displayed.
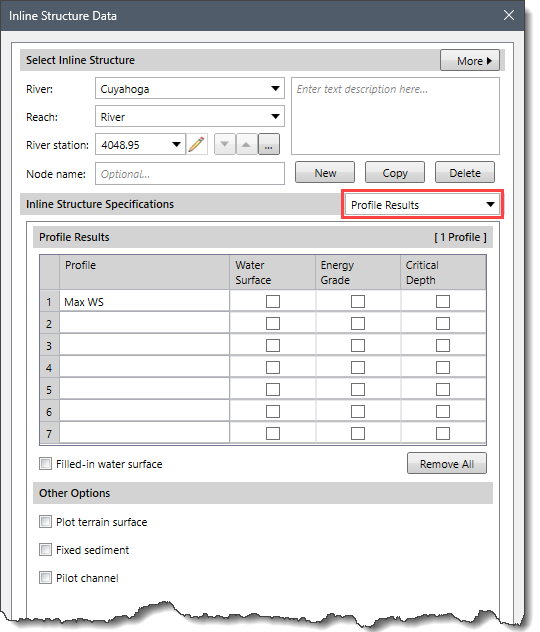
This data panel contains the following sections:
This section contains the following options:
Clicking the [Remove All] button removes all profile results from the inline structure plot.
This section allows the user to enable additional curves for the plot terrain surface, fixed sediment, and pilot channel in the inline structure plot.


CivilGEO G2 Reviews
4.8/5.0 Rating, Over 230 Reviews

GeoHECRAS is recognized as the top Civil Engineering Design Software with an average of 4.8 out of 5.0 rating from over 230 real user reviews on G2.


We use cookies to give you the best online experience. By agreeing you accept the use of cookies in accordance with our cookie policy.
When you visit any web site, it may store or retrieve information on your browser, mostly in the form of cookies. Control your personal Cookie Services here.


