
Welcome to CivilGEO Knowledge Base
Welcome to CivilGEO Knowledge Base
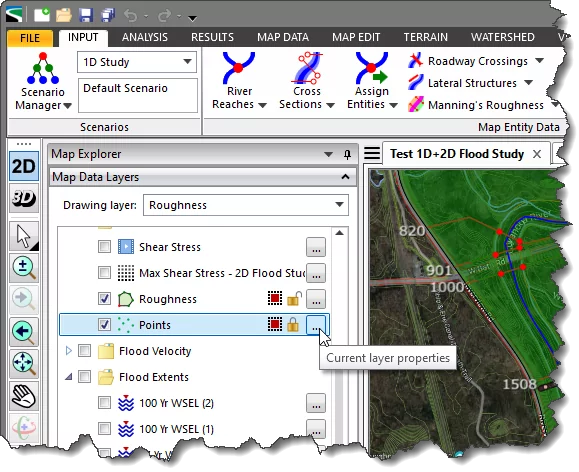
The Point Layer Properties dialog box allows the user to define various point layers and their properties, style the border associated with the point objects, and display the color fill legend in the Map Data Layers panel and/or on the Map View. It also allows the user to change the current CRS (coordinate reference system) of the project and automatically apply the transformation scale factor to any point layer to accurately map it to the project CRS. Furthermore, the Point Layer Properties dialog box allows the user to view and update the point data associated with a point layer file.
Follow the steps below to use the Point Layer Properties dialog box:
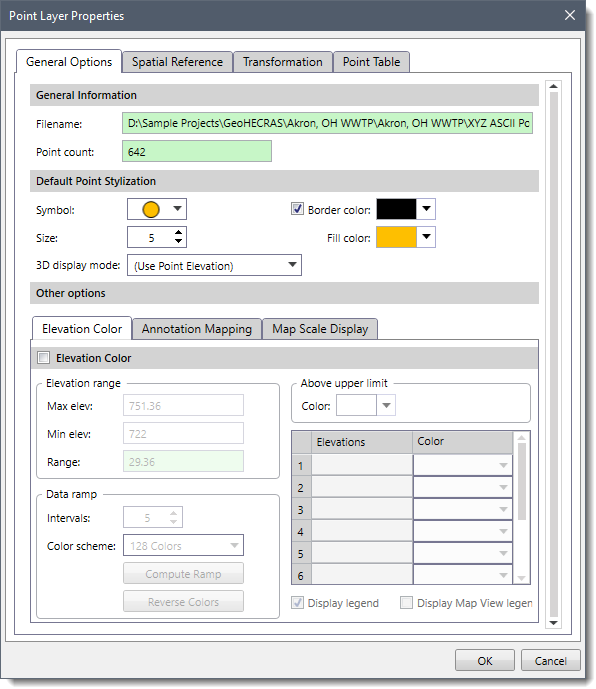
The Point Layer Properties dialog box contains four tabs as described below:
Various sections of the General Options tab are described below.
This section contains read-only information about the system location and name of the point layer file as well as the total number of points within the selected point layer file.
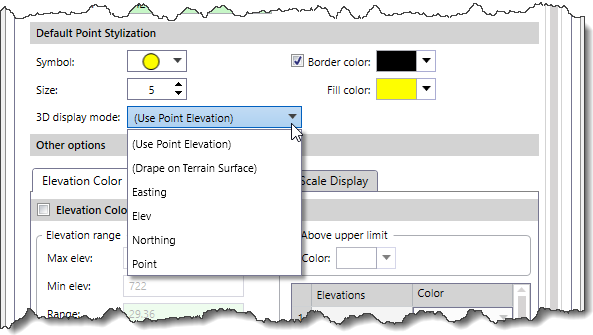
This section is used to define various point object stylizations, such as shape of a point object, border color, border size, and color fill options.

The 3D display mode dropdown combo box allows the user to specify the appearance of the point in 3D view mode. The 3D display mode dropdown combo box lists the following options:
This section is divided into the following three panels:
This panel allows the user to utilize different tools that help improve the color rendering of the point layer. Note that this panel is enabled only when the Elevation Color section checkbox is checked.

In the Elevation range subsection, the user can define a custom color fill scheme for the entire elevation grid. By default, the Max elev and Min elev fields display the terrain’s maximum and minimum elevations. The user can also change these maximum and minimum elevations, and their corresponding elevation differences will be displayed in the Range read-only field.
In the Data ramp subsection, the user can define the color scheme as well as the interval for the color ramp that will be used to depict the range of elevation color fill. The Intervals spin control button allows the user to specify the number of colors that will be used to represent the different elevations of the point objects. The default value is 5. The Color scheme dropdown combo box allows the user to select the color scheme for the color ramp.
The user-defined maximum and minimum elevation range then can be utilized for the elevation color fill. In the Elevations and Color table, the user can then select the desired colors for the entire elevation range defined. Note that the Intervals defined in the Data ramp subsection create the same number of elevations in the Elevations and Color table.
Note that clicking the [Compute Ramp] button causes the software to reset the intervals and corresponding color style in the Elevations and Color table. Clicking the [Reverse Colors] button reverses the color values in the Elevations and Color table.
If there is an upper elevation range that does not fall under the user-defined elevation range, then all those elevations can also be assigned a color using the Above upper limit dropdown color palette.
Checking the Display legend and Display Map View legend checkboxes causes the software to create a color fill legend for the Elevations and Color table in the Map Data Layers panel and on the Map View respectively.
This panel allows the user to change and display the labels of the point attributes on the Map View.
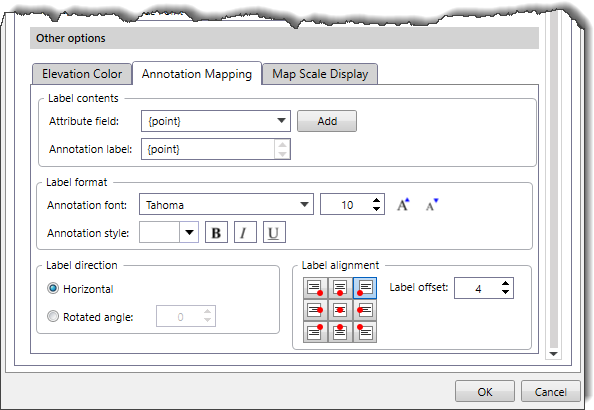
Refer to this article in our knowledge base to learn more about annotation mapping.
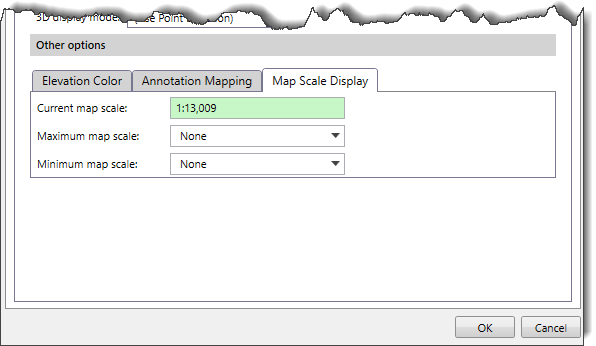
This panel allows the user to transform the scale factor of the data to be displayed on the Map View. The user can select the maximum map scale ratio from the Maximum map scale dropdown combo box. Similarly, with the Minimum map scale dropdown combo box, the minimum map scale ratio can be selected. By default, the maximum and minimum map scales ratios are set to None.
The Spatial Reference tab allows the user to manually assign the project’s CRS to the non-CRS referenced data layer coordinates if the data layer lies within the project’s CRS. Refer to this article in our knowledge base to learn more about spatial reference.
The Transformation tab allows the user to automatically apply the transformation scale factor to any particular layer and accurately map it to the project coordinate reference system (CRS). Refer to this article in our knowledge base to learn more about layer transformation.
The Point Table tab allows the user to view and edit point data of the selected point layer file.

This section displays the table listing the point data (Easting, Northing, Elevation, Description, etc.). By default, this table is in read-only mode. Check the Edit Point Data section checkbox to make the table editable.
The user can export the table as a PDF file or a Microsoft Excel file or copy the table to the clipboard. To copy or export the table data to a different format, right-click anywhere in the table and select the Copy Table to Clipboard, Export Table to Excel, or Export Table to PDF command from the displayed context menu.
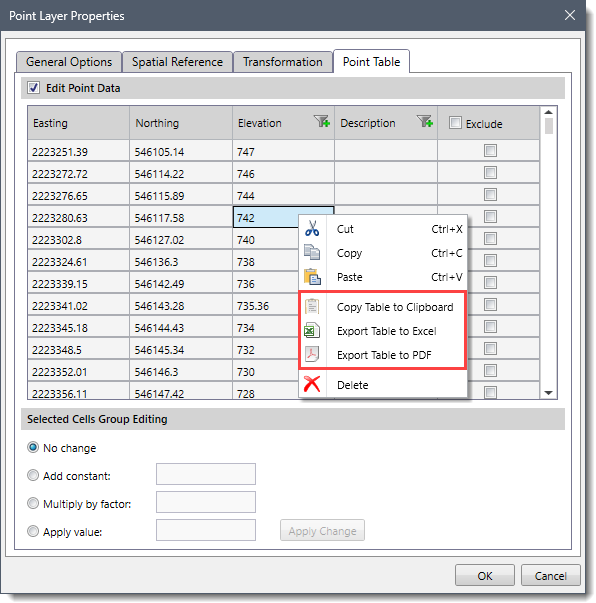
Note that the Elevation and Description columns allow the user to filter the table contents.
This section allows the user to edit multiple cells in the Edit Point Data table at once. The user can select the desired cells from the Edit Point Data table and then edit the data using one of the following options:
After selecting the preferred option, click on the [Apply Change] button to update the new values in the cells.


CivilGEO G2 Reviews
4.8/5.0 Rating, Over 230 Reviews

GeoHECRAS is recognized as the top Civil Engineering Design Software with an average of 4.8 out of 5.0 rating from over 230 real user reviews on G2.


We use cookies to give you the best online experience. By agreeing you accept the use of cookies in accordance with our cookie policy.
When you visit any web site, it may store or retrieve information on your browser, mostly in the form of cookies. Control your personal Cookie Services here.


