
Welcome to CivilGEO Knowledge Base
Welcome to CivilGEO Knowledge Base
A critical duration analysis must be conducted to determine the proper storm duration for computing design flows. In a critical duration analysis, a range of storm durations is evaluated to identify the storm duration that produces the greatest peak flow or volume.
The critical duration will vary by watershed, depending on the size, drainage characteristics, and water management infrastructure. It is determined by comparing various durations of the specified storm frequency and calculating the peak rate and/or runoff volume for each. For example, a 30-minute event might be the critical storm duration for sizing catch basin inlets and storm sewers from small watersheds. However, longer duration events such as the 3-hour, 12-hour, or 10-day runoff events might be the event durations that result in the most severe flood levels for lakes.
The accurate assessment of flood risk and flood damages and the sizing and design of flood control projects in any watershed relies on the peak flood discharges, the peak flood stages, and the maximum runoff volumes generated for that watershed. Peak discharges, stages, and runoff volumes can be determined through the application of rainfall runoff and hydraulic methodologies that utilize “critical” design rainfall events (volume, duration, and temporal distribution) to generate runoff hydrographs from designed rainfall events.
FEMA guidance states that the critical storm is a design storm, which provides the highest flood discharges/water surface elevations for the flooding source. In practice, it is often assumed that the 100-year, 24-hour duration storm produces the critical or highest flood discharges, stages, and runoff volumes throughout the watershed. However, the actual critical duration design storm may be something other than the 24-hour design event, and there may be more than one critical duration storm that produces critical flood discharges, stages, and storage volumes across the watershed.
A critical duration analysis is required to estimate representative peak discharges and flood stages and to properly size flood control projects. A critical duration analysis can be performed to determine the critical duration storm specific to each watershed, and each study reach across the watershed. Typically, flood discharges and stages for the 1-, 3-, 6-, 12-, 24- and 48-hour storm durations for the 100-year frequency event are generated to identify the critical duration which produces the highest peak flows and stages for all study locations within the watershed. Performing this analysis and using the resulting critical duration events helps to ensure that the hydrologic/hydraulic models produce the highest flood discharges and stages across the watershed.
The critical duration analysis allows the user to quickly go through several iterations in sizing a detention pond and the corresponding outfall structure to accommodate the required design storms.
The storm duration that produces the greatest volume of storage and highest ponded depth within a detention pond is considered the critical duration storm. Reservoir routing computations for the detention pond will require incorporating several different duration storms to determine the critical duration and the highest pond level for each frequency storm required. The operation of any basin is dependent on the interaction of:
Therefore, each detention pond will respond to different duration storms in dissimilar patterns. The approximate critical storm can be estimated, but the actual critical duration storm can only be determined by performing reservoir routing computations for several different duration storms.
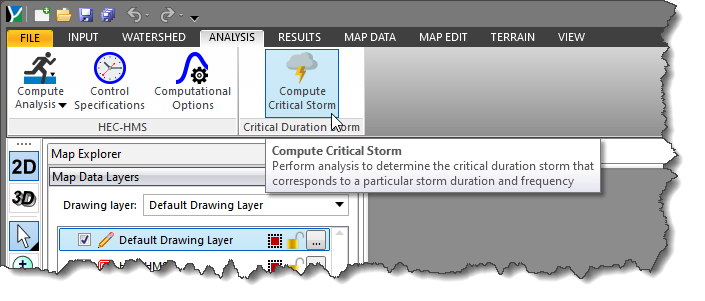
In GeoHECHMS, the Compute Critical Storm command allows the user to perform an analysis to determine the critical duration storm that corresponds to a particular storm duration and frequency.
Follow the steps below to use the Compute Critical Storm command:
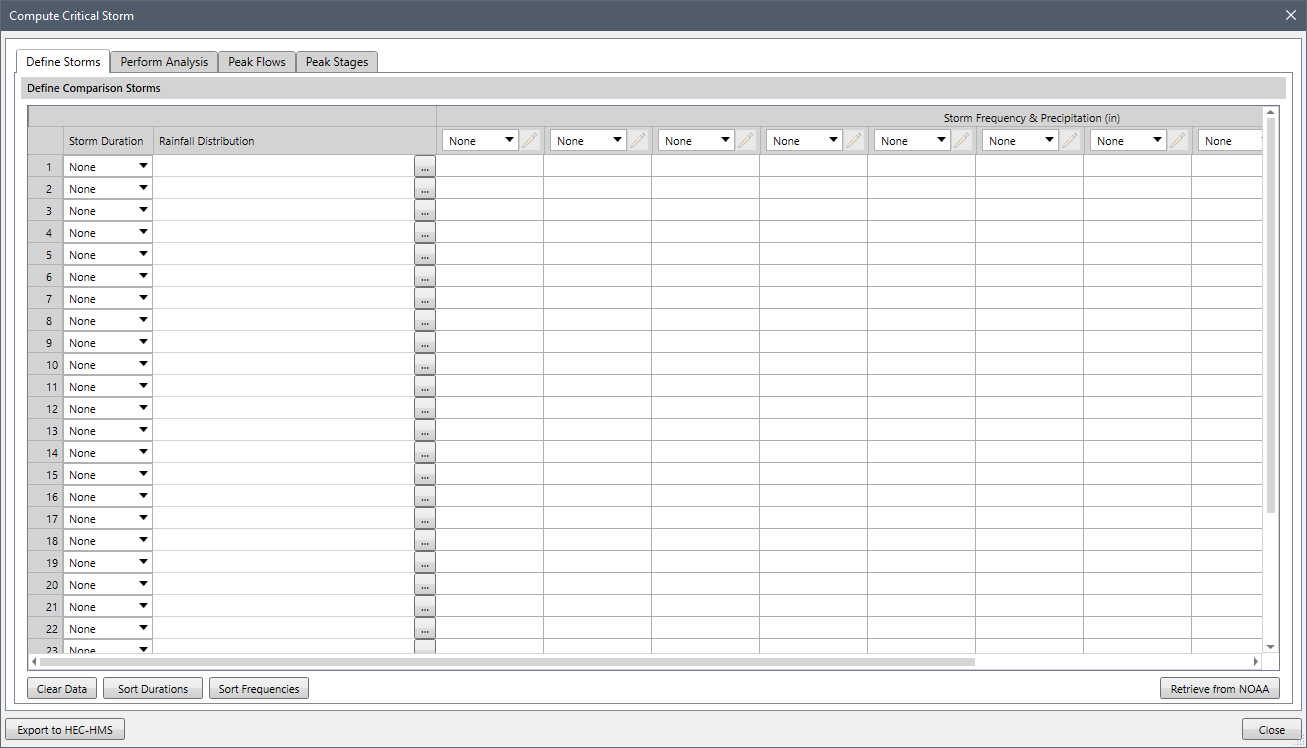
The following sections describe how to use the Compute Critical Storm command and interact with the above dialog box.
The Define Storms panel is used to define the storms to be analyzed to determine the critical storm.
The following entries are provided in this panel:
The dropdown combo boxes under the Storm Duration column list the storm durations to be analyzed. The defined durations are then applied to the defined Rainfall Distribution. The Storm Duration dropdown combo box lists the following entries:
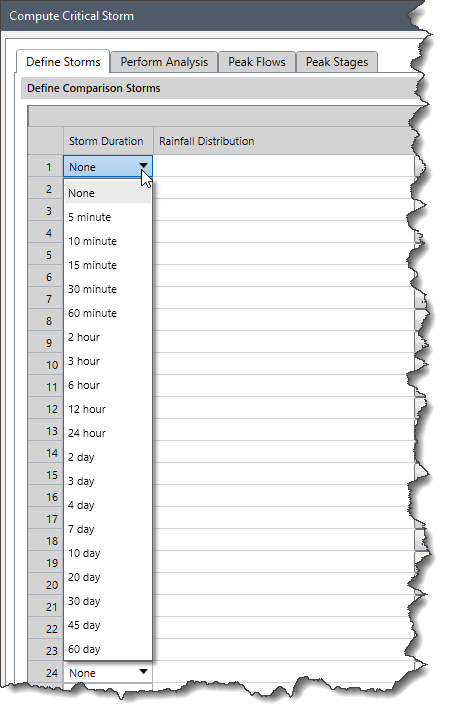
When the user selects a storm duration for a different row, then the current row’s dropdown combo box entry has the previously selected storm duration removed. In that way, the user only sees those storm durations that have not yet been defined. The user can also drag and drop the defined rows to change their top to bottom order.
This column entry allows the user to select the rainfall distribution to be applied to the defined storm duration. The user can click the […] lookup button to display the Rainfall Distribution dialog box.
![[…] lookup button](/wp-content/uploads/sites/25/2022/11/Compute-Critical-Storm-Command-Image-4.png)
The Rainfall Distribution dialog box allows the user to select the rainfall distribution. Note that only percentile-based rainfall distribution will be available for selection.
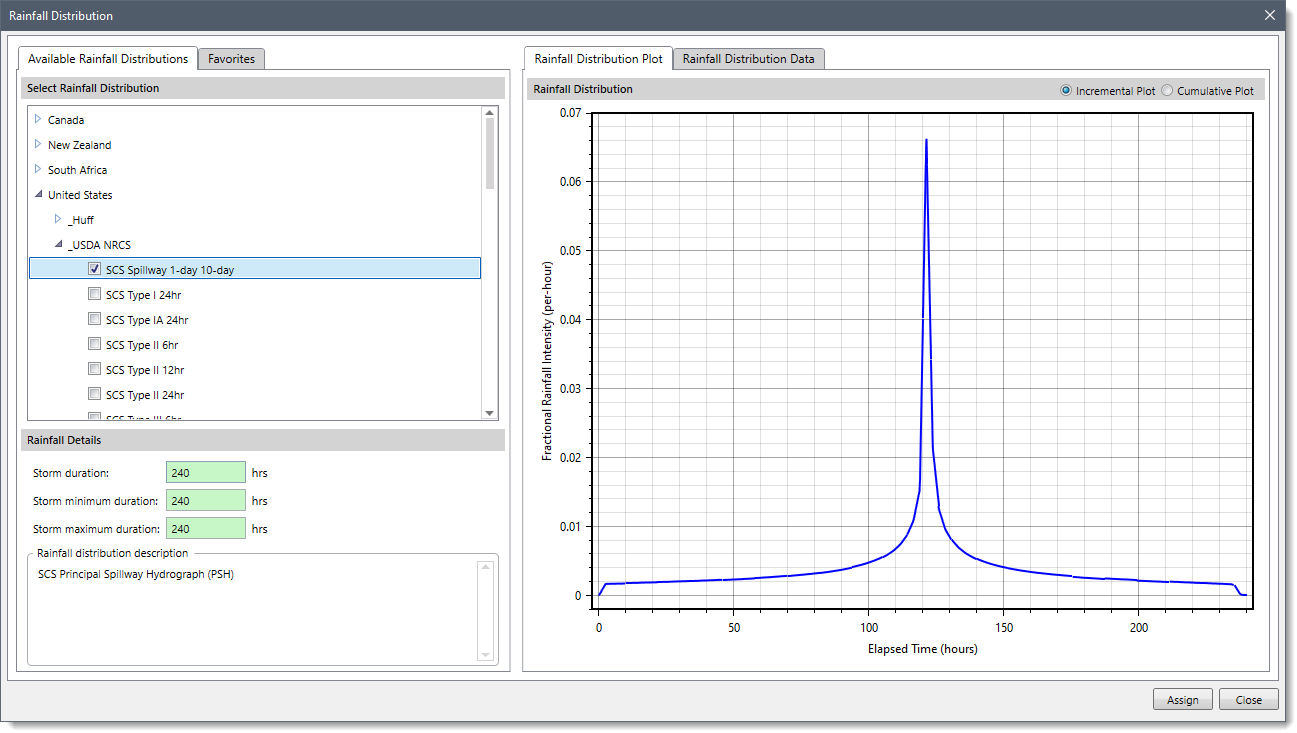
After selecting a rainfall distribution, click the [Assign] button. The name of the rainfall distribution is then displayed in the Rainfall Distribution entry.
Note that if the user selects a rainfall distribution that does not match the selected storm duration, the software will scale the selected rainfall distribution with the selected storm duration.
To learn more about the Rainfall Distribution dialog box, refer to this article in our knowledge base.
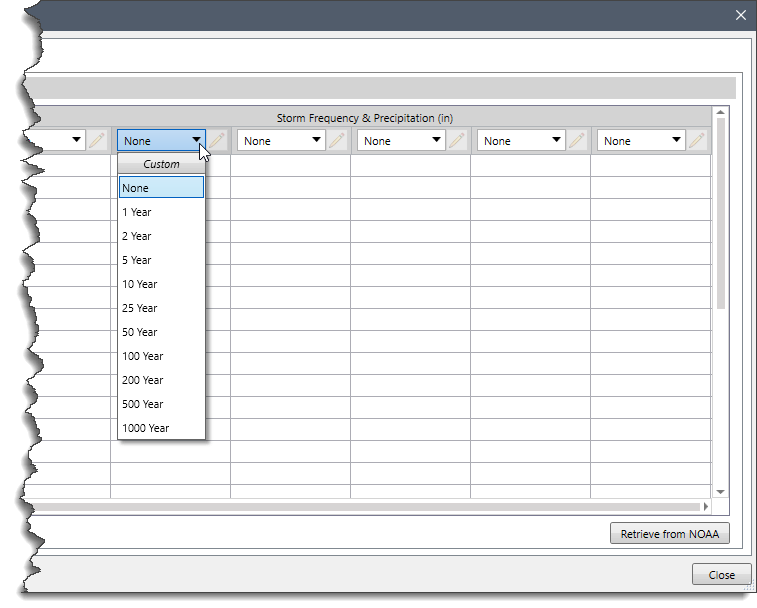
The dropdown combo boxes in the first row of the Storm Frequency & Precipitation (in) section list the storm frequency to be analyzed. This value is used to look up the corresponding rainfall precipitation amount. The dropdown combo box lists the following entries:
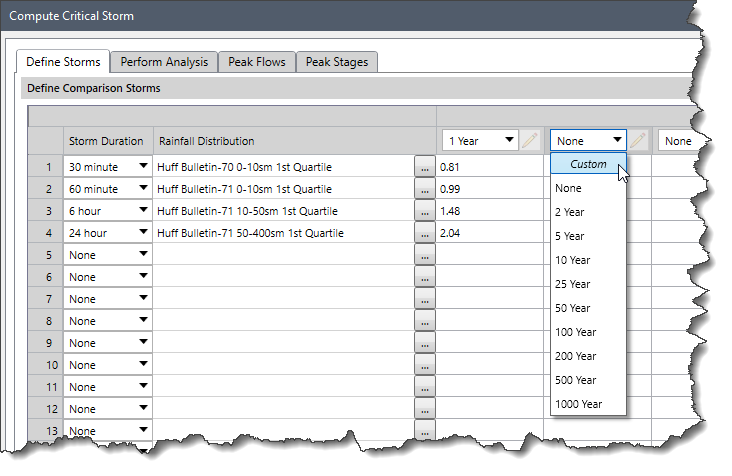
When the user selects a storm frequency for a different column, then the current column’s dropdown combo box entry has the previously selected storm frequency removed. In that way, the user only sees those storm frequencies that have not yet been defined. The only exception to this is the Custom option, which allows the user to define a custom storm frequency. Multiple custom storm frequencies can be defined. The user can also drag and drop the defined columns to change their left to right order.
The Custom option allows the user to define a custom storm frequency.
On selecting the Custom option, the Custom Storm Frequency dialog box will be displayed, allowing the user to define the custom storm frequency.
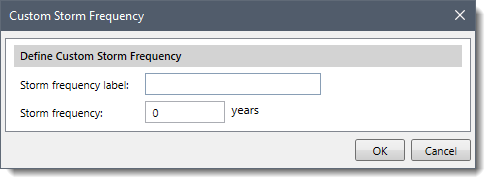
The following entries are provided in the above dialog box:
After providing values for the above entries, the user can click the [OK] button and the custom storm frequency will be defined.
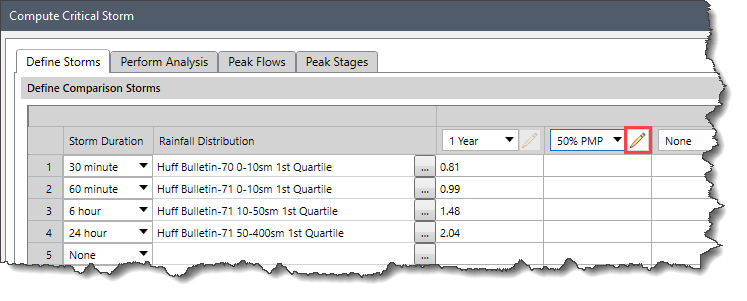
After the custom storm frequency is defined, the user can click on the pencil icon to edit the storm frequency.
Note that if the user names the column the same as one of the pre-defined columns, then the NOAA rainfall retrieval ignores the column.
The empty fields contained in the data grid of the Storm Frequency & Precipitation (in) section are used to store the storm precipitation data. The user can either manually enter the values or have the software automatically fill in the data grid. Clicking on the [Retrieve from NOAA] button will retrieve corresponding precipitation data and populate the data grid for the defined Storm Durations and Storm Frequencies from NOAA Atlas 14.
![Populating precipitation data using [Retrieve from NOAA] button](/wp-content/uploads/sites/25/2022/11/Compute-Critical-Storm-Command-Image-10.png)
Note that the software will ignore the corresponding data fields of the columns that have been populated with custom storm frequencies. The user is required to manually enter the precipitation values for these storm frequencies.
Additionally, the user can right-click anywhere on the data grid to display the context menu commands.
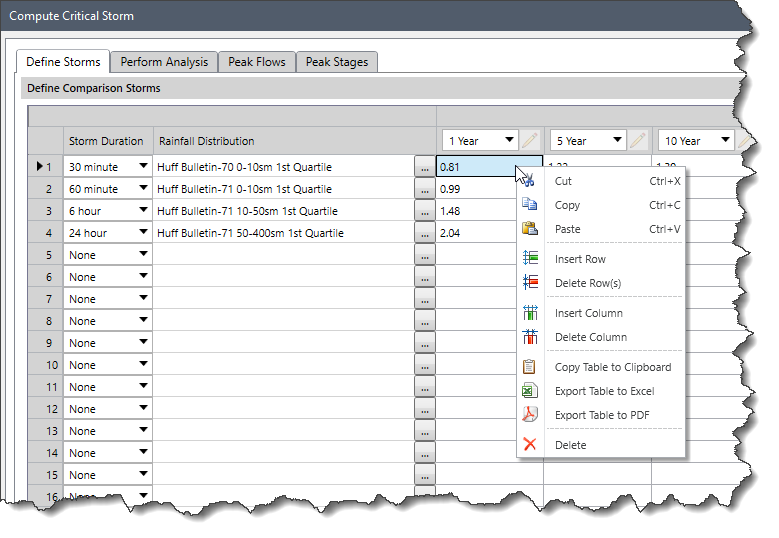
The following commands are provided in the context menu:
The [Clear Data] button allows the user to clear the entire contents of the data grid, including the storm duration, rainfall distribution, storm frequency, and NOAA retrieved precipitation data.
![[Clear Data] button](/wp-content/uploads/sites/25/2022/11/Compute-Critical-Storm-Command-Image-12.png)
The [Sort Durations] button allows the user to sort the storm duration rows in ascending order. The custom storm durations will be placed last and in ascending order.
The [Sort Frequencies] button allows the user to sort the storm frequency columns in ascending order. The custom storm frequencies will be placed last and in ascending order.
The Perform Analysis panel is used to define general information relating to the detention pond to be designed and analyzed.
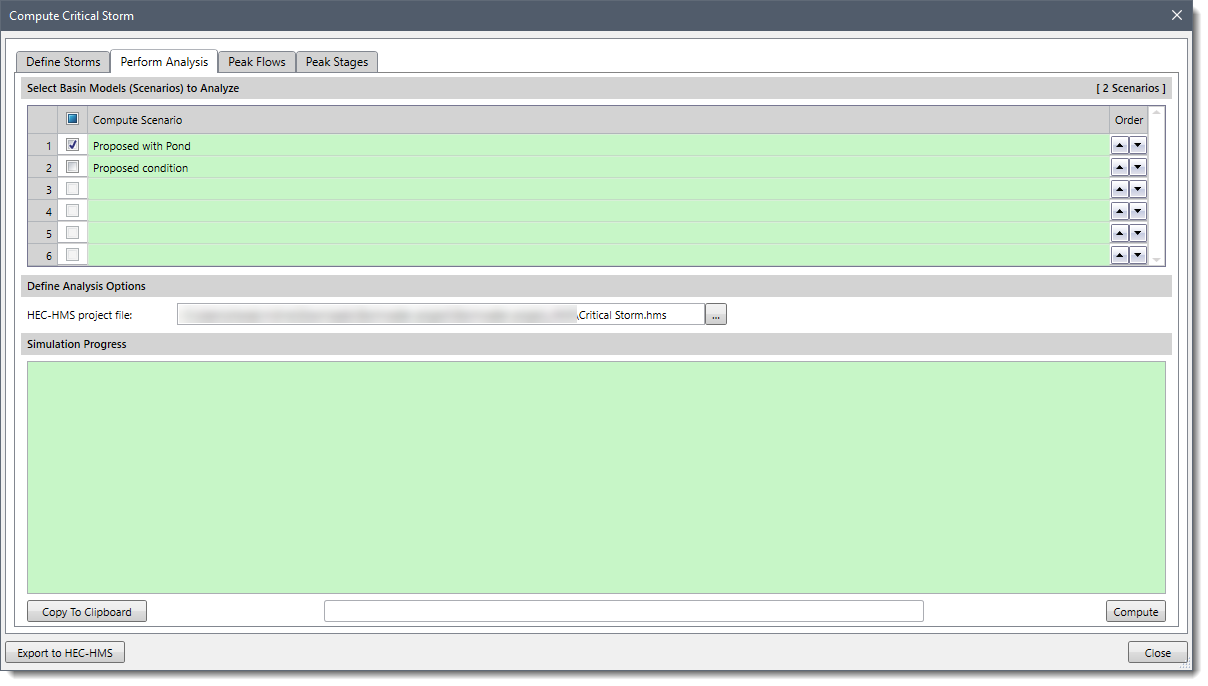
Note that the [Compute] button will be grayed out until the user has selected a basin model.
The following sections are provided in this panel.
The Select Basin Models (Scenarios) to Analyze section lists all the defined basin models (geometry data). The user can select which basin models to be analyzed. The Compute Scenario checkbox in the topmost row allows the user to select and deselect all rows. The software lists the basin models in alphabetical order. In addition, the user can use the Up and Down arrow buttons on the right side of each row to move the listed basin models.
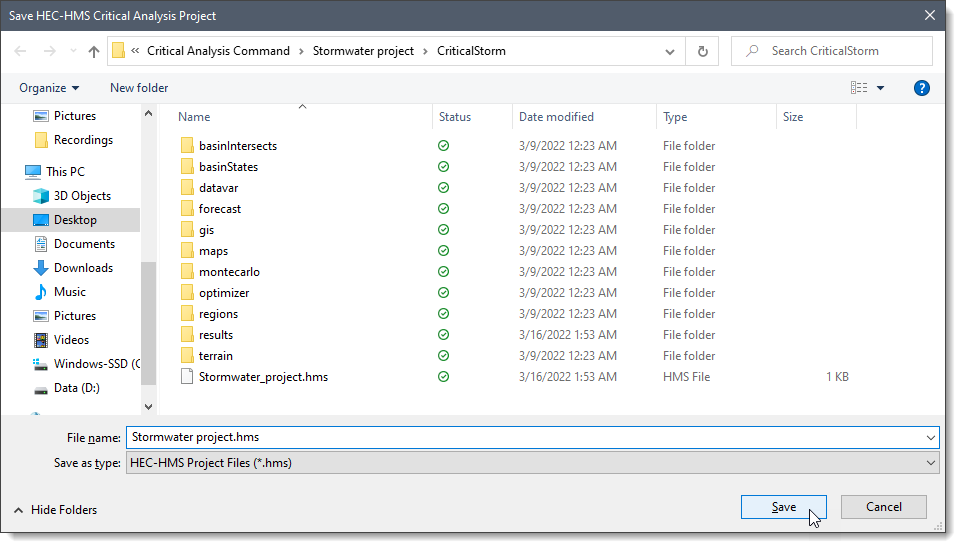
The Define Analysis Options section allows the user to define the path and file name where the analysis results are to be saved. Click the […] browse button, and the software will display the Save HEC-HMS Critical Analysis Project dialog box. From the displayed dialog box, browse to the location to save the file, enter the file name, and then click the [Save] button.
The user will be returned to the Compute Critical Storm dialog box, and the complete directory path and the file name will be shown in the HEC-HMS project file entry.
Note that the software creates a single project file that contains references to the Basin Geometry, Meteorology, and Run files that need to be computed.
This section displays progress in computing the different storm analyses to determine the critical storm duration. The progress bar at the bottom shows which model run is currently being performed.
When all the options have been properly defined, click the [Compute] button to initiate the simulation. While the simulation is running, the button changes to [Cancel] so that the user can cancel the simulation if desired.
Clicking on the [Copy to Clipboard] button allows the user to copy the contents of the simulation section to the Windows clipboard.
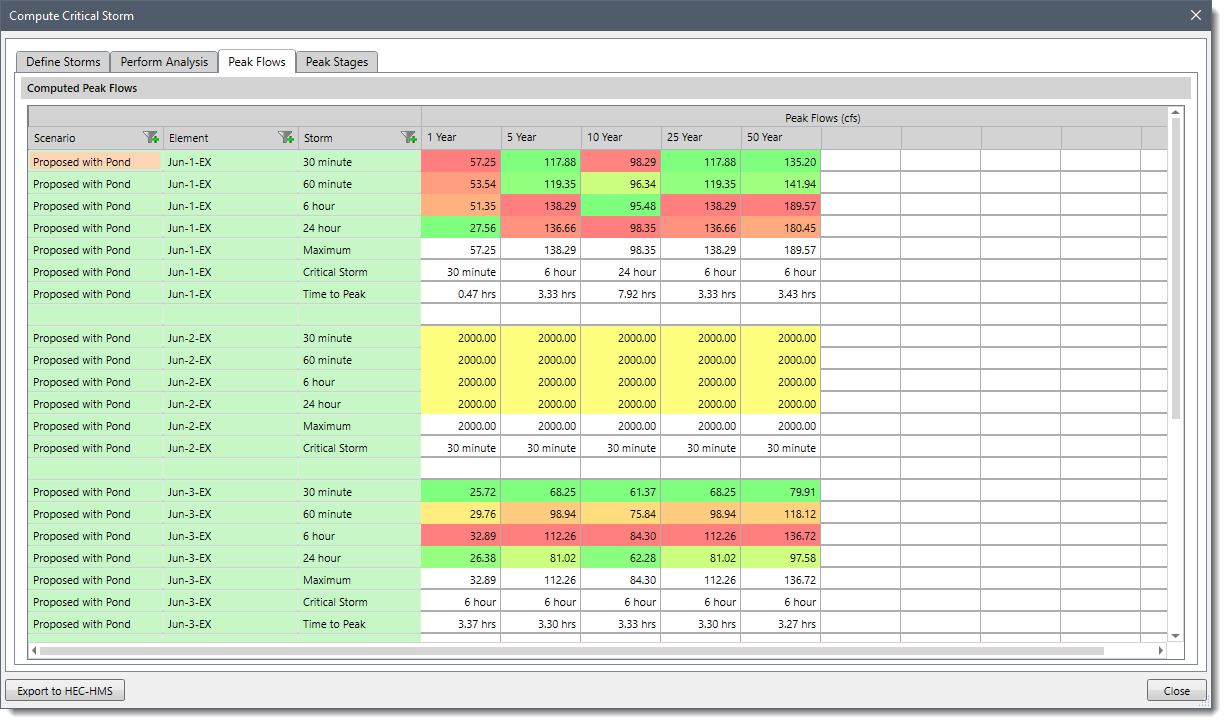
This panel is used to review the simulation results. It lists all the computed peak flows for all storms and all defined elements in the model.
The following entries are defined in this panel:
This column represents the basin models (i.e., scenario) that were analyzed. Clicking on the Filter icon will display the dropdown filter listing all the basin models.
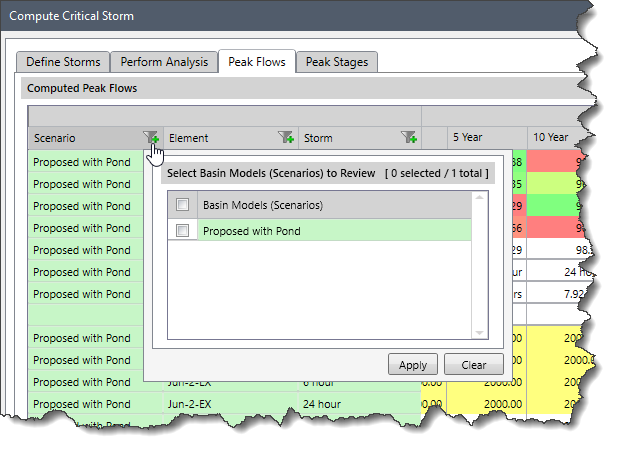
The user can select the checkboxes corresponding to the basin models to be displayed in the Computed Peak Flows output data grid and click the [Apply] button. The user can click the [Clear] button to cancel all the previous selections and redo the entire process.
This column represents the model elements that were analyzed in each basin model. Clicking on the Filter icon will display the dropdown filter listing all the model elements (excluding subbasins) contained in the selected scenarios.
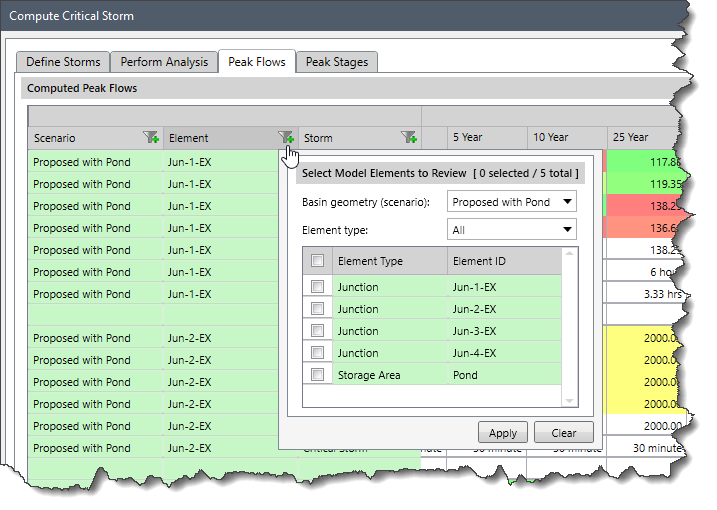
The user can select the checkboxes corresponding to the desired elements to be displayed in the Computed Peak Flows output data grid and click the [Apply] button. The user can click the [Clear] button to cancel all the previous selections and redo the entire process.
The following entries are contained in the dropdown filter.
This column represents the storms that were analyzed. Clicking on the Filter icon will display the filter dropdown listing all the storm durations that were analyzed.
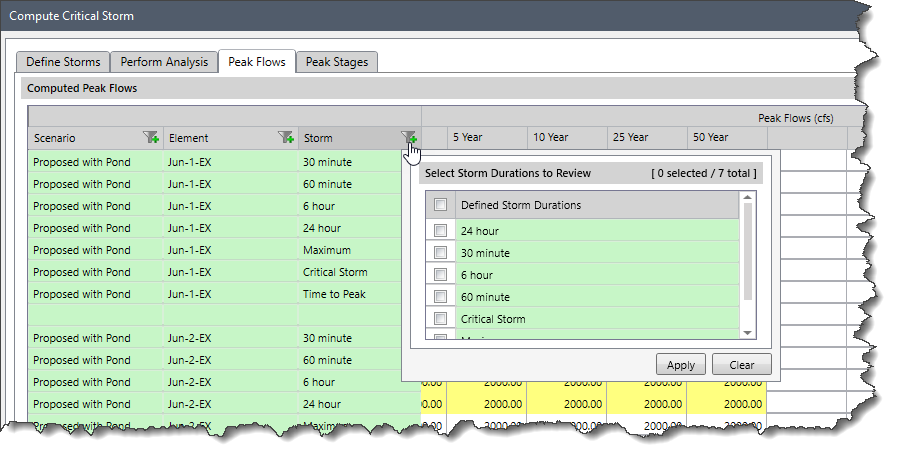
The user can select the checkboxes corresponding to the desired storm durations to be displayed in the Computed Peak Flows output data grid and click the [Apply] button. The user can click the [Clear] button to cancel all the previous selections and redo the entire process.
Note that the dropdown filter lists only those storm durations that were defined in the Define Storms panel.
The maximum peak flow row labeled as Maximum is displayed at the third to bottom row of each element section. It contains the maximum peak flow that was computed for the storms listed for that element. If there was only one storm row listed, then this row is hidden.
The critical storm row labeled as Critical Storm is displayed as the second to the bottom row of each element section. It contains the storm name that generated the maximum peak flow that was computed for the storms listed for that element. If there was only one storm row listed, then this row is hidden.
The time to peak row labeled as Time to Peak is displayed as the bottom row of each element section. It corresponds to the time period in decimal hours from the start of a critical storm to its peak discharge.
The Peak Flows (cfs) data grid cells are colored to represent the minimum and maximum values for that column. The cell that holds the minimum value is colored green. The cell that holds the medium value is colored yellow, and the cell that holds the maximum value is colored red.
This panel is used to review the simulation results. It lists the computed results only for the reservoir (i.e., storage areas) element type that contains a stage (i.e., depth) value.
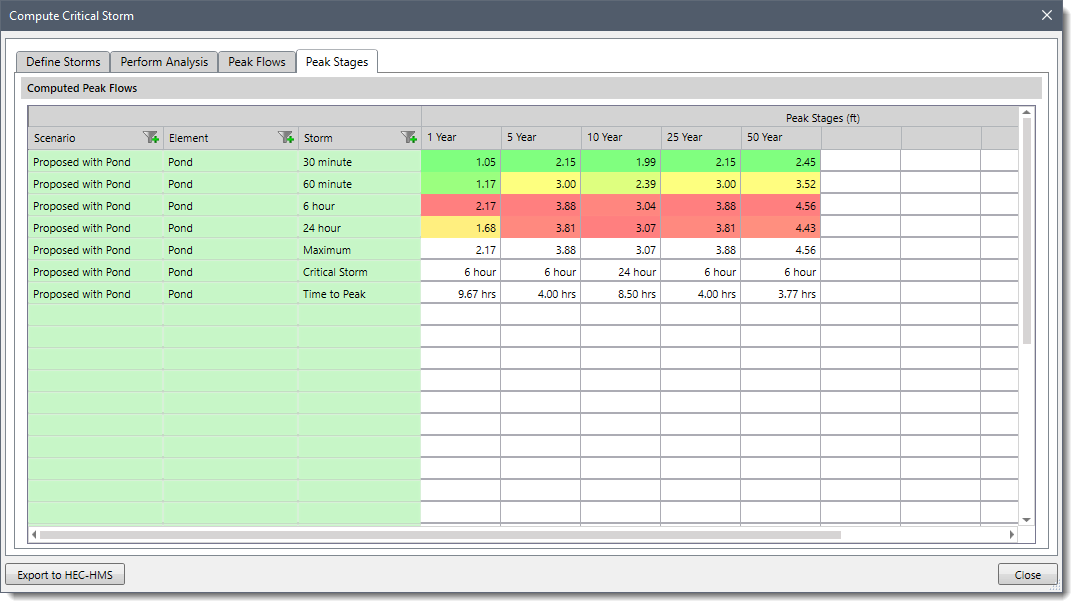
Note that the Peak Stages panel shows similar results to that of the Peak Flows panel—but shows results of the stage (i.e., depth) rather than flow. The Time to Peak is reported for inflow and outflow (i.e., discharge).
After performing the analysis, the user can click the [Export to HEC-HMS] button to export the critical duration data to be used in a HEC-HMS model so that the user can run this analysis in HEC-HMS.
![[Export to HEC-HMS] button](/wp-content/uploads/sites/25/2022/11/Compute-Critical-Storm-Command-Image-20.png)
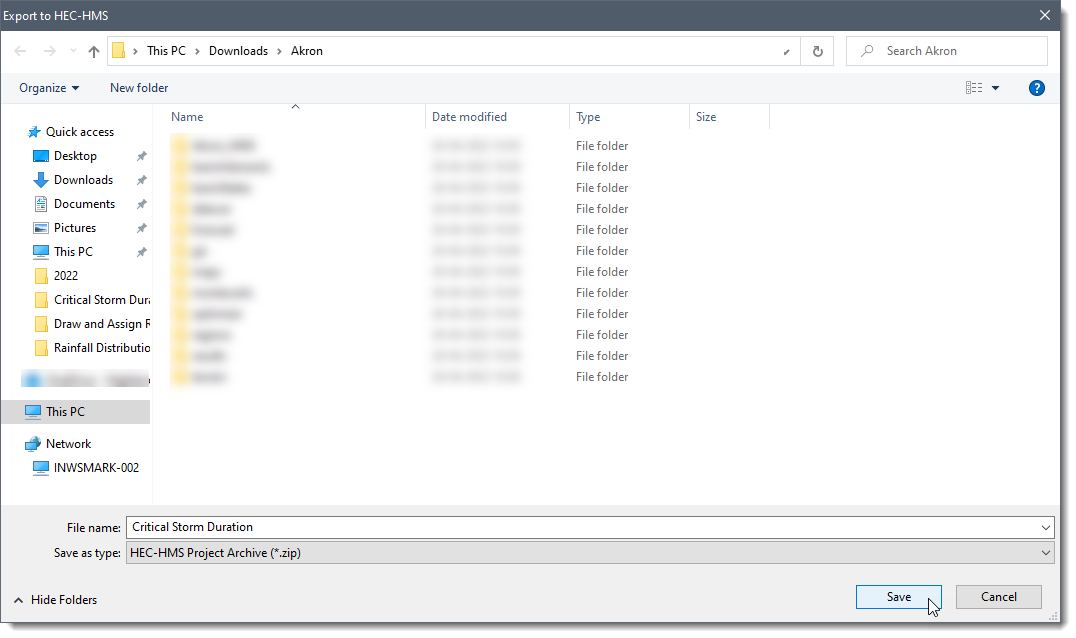
On clicking the [Export to HEC-HMS] button, the software will display the Export to HEC-HMS dialog box. The user can browse to the location to save the file, enter the file name, and click the [Save] button to save the data as a zip file.
Note that the user can also export the data defined in the storm and precipitation grid under the Define Storms panel without running the analysis.


CivilGEO G2 Reviews
4.8/5.0 Rating, Over 230 Reviews

GeoHECRAS is recognized as the top Civil Engineering Design Software with an average of 4.8 out of 5.0 rating from over 230 real user reviews on G2.


We use cookies to give you the best online experience. By agreeing you accept the use of cookies in accordance with our cookie policy.
When you visit any web site, it may store or retrieve information on your browser, mostly in the form of cookies. Control your personal Cookie Services here.


