
Welcome to CivilGEO Knowledge Base
Welcome to CivilGEO Knowledge Base
A curve number (CN) is a hydrologic parameter used to describe the stormwater runoff potential for the drainage area. It is a function of land use, soil type, and soil moisture. The Natural Resources Conservation Service (NRCS) has divided soils into four hydrologic soil groups (i.e., A, B, C, and D) according to water’s ability to infiltrate. The curve number values range from approximately 30 (for permeable soils with high infiltration rates) to 100 (for water bodies, impervious surfaces, and soil near-zero infiltration rates).
This video demonstrates how to compute the curve numbers.
In GeoHECHMS, the process of computing CN involves land use and soil types. Our software automates this process by using the following data:
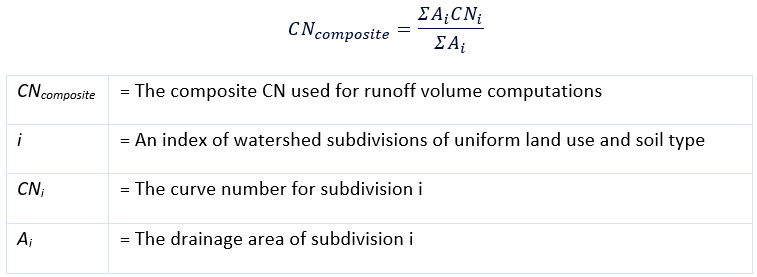
For a watershed that consists of several soil types and land use, a composite CN is calculated as:
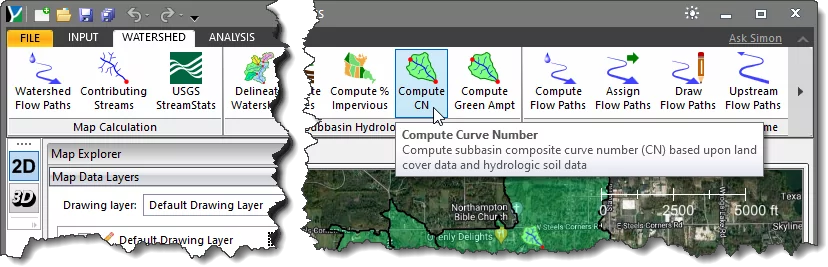
The Compute CN command is used to compute the curve number (CN) for each subbasin, which is used to determine how much runoff occurs based upon the Land Use (or Land Cover) and the underlying Hydrologic Soil Type. For example, urban areas where there is a lot of pavement and hard surfaces will generate significant runoff, regardless of the underlying hydrologic soil type. To learn more about curve number computation for urban areas, refer to this article in our knowledge base.
Wooded areas tend to absorb a lot of rainfall but produce very little runoff, unless the underlying hydrologic soil type cannot absorb the rainwater, such as hardpan clay soils. Therefore, the command will combine the two coverages (i.e., Land Use and Hydrologic Soil Type) and develop a representative curve number for each subbasin.
Follow the steps below to use the Compute CN command:
 Note that the [Compute] button will be grayed out until the user has selected a subbasin.
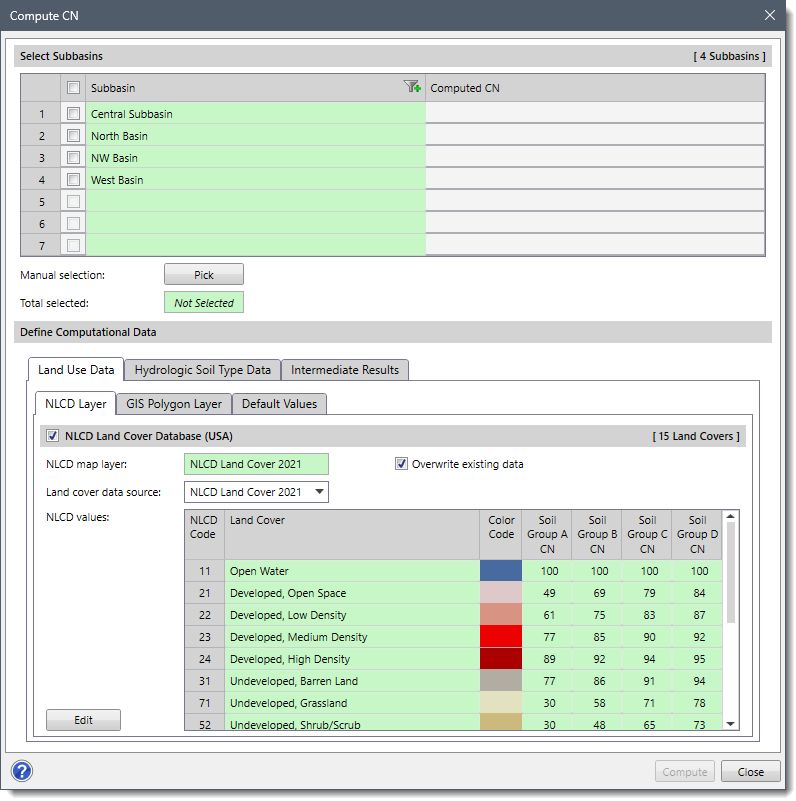
The following sections describe how to use the Compute CN command and interact with the above dialog box.
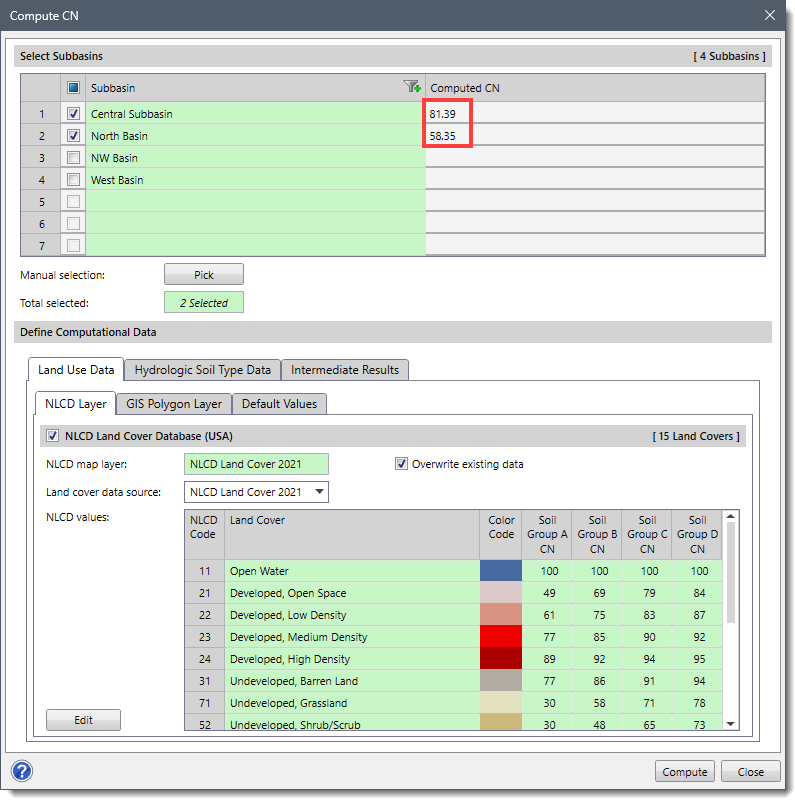
The Select Subbasins section includes a table that lists all the subbasins contained within the current scenario.
The user can select the subbasins for which the curve number value is to be computed. If a subbasin is already selected on the Map View prior to running this command, the same subbasin will be shown selected within the table.
Alternatively, the user can click the [Pick] button to interactively select the subbasins from the Map View. Clicking on the [Pick] button will cause the dialog box to temporarily disappear, allowing the user to select HEC-HMS subbasins from the Map View. Upon returning to the Compute CN dialog box, the total number of selected subbasins will be displayed in the Total selected read-only field as shown below.
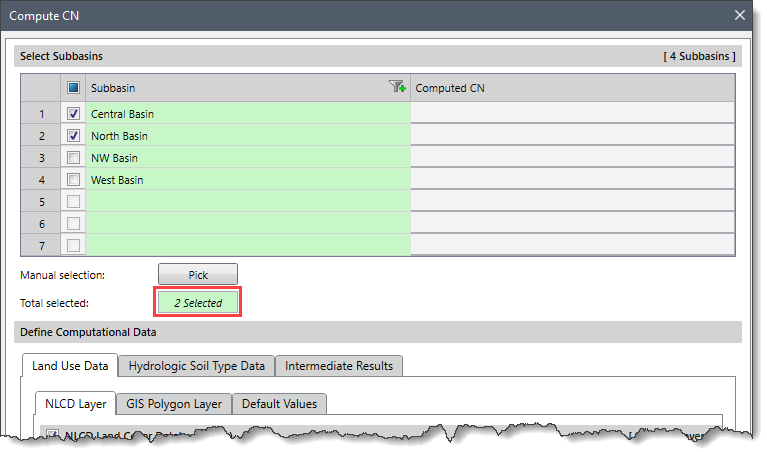
Note that the user can select multiple subbasins from the Map View prior to running the Compute CN command by holding the [Ctrl] key while selecting the desired subbasins.
The Define Computational Data section contains three panels: Land Use Data, Hydrologic Soil Type Data, and Intermediate Results. These panels are used to define the land cover data and hydrologic soil group data that will be used for computing the curve number for the selected subbasins.
The Land Use Data panel contains three subpanels, which are described below:
The NLCD Layer subpanel is used to determine land type with data from the National Land Cover Database (NLCD), which is represented by 75 ft cells throughout the USA. The NLCD map service is used to determine the curve number based upon the hydrologic soil group (i.e., A, B, C, D) as shown below.
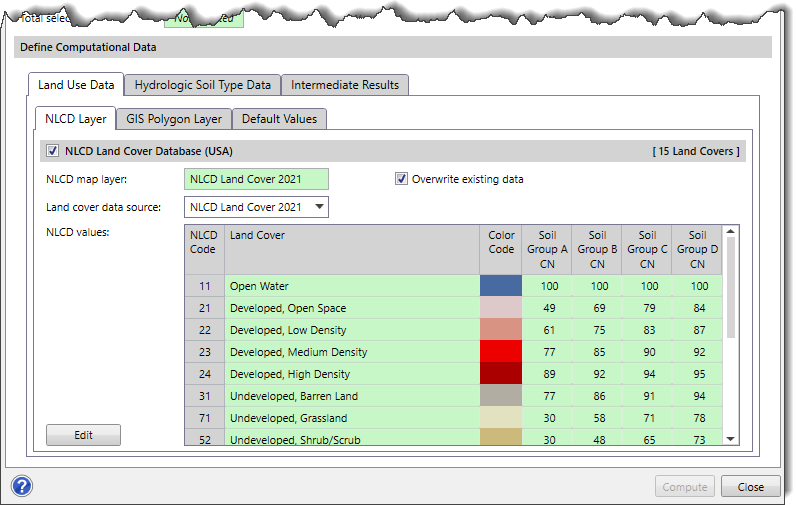
Note that for countries other than the USA, the software provides similar land cover databases. The content of this data panel will change to represent the one that is available for the project area. Currently, our software supports Africa, Australia, Canada, Europe, India, New Zealand, and the USA land cover database.
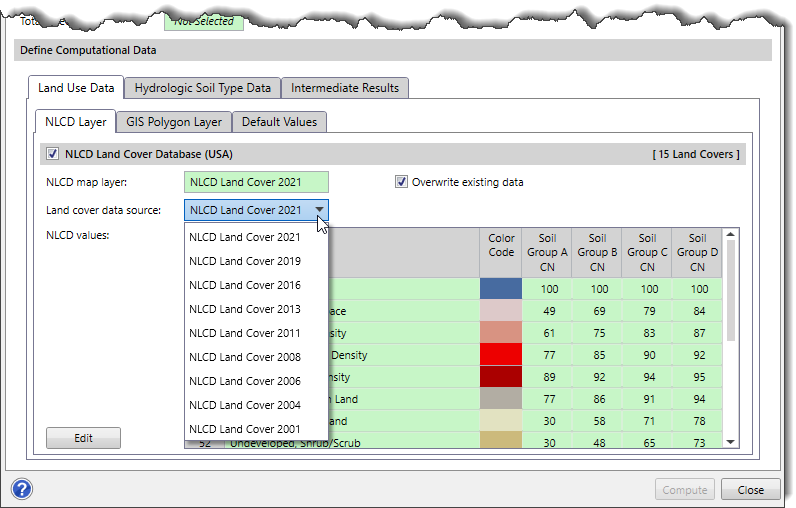
The Layer cover data source dropdown combo box allows the user to select which land use data source to utilize for the newly created layer. By default, the software selects the most recent land use data. The following options are available in the dropdown combo box:
 If the “Overwrite existing data” checkbox option is checked, then the new land cover data selected in the Land cover data source dropdown combo box will overwrite the existing land cover data (if one exists).
The user can click the [Edit] button to display the NLCD Land Cover dialog box that provides an editable data grid, allowing the user to change the CN values of different hydrologic soil groups.
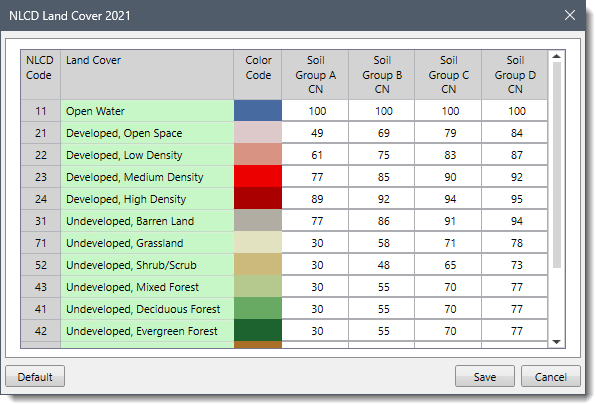
After editing the required cell values, the user can click the following buttons:
The NLCD Layer subpanel will be replaced by other subpanels based on the modeling region, as described below:
| Region | Displayed Land Cover Layer | Land Cover Description |
|---|---|---|
| USA | NLCD Land Cover Database (USA) | Contains seamless land cover information from the national land cover database published in 2016 by the Multi-Resolution Land Characteristics (MRLC) Consortium. |
| Canada | Land Cover Database (Canada) | Contains a 30 m land cover map of Canada generated by Canada Centre for Remote Sensing (CCRS). |
| Africa | Land Cover Database (Africa) | Contains land cover map of Africa at 20 m based on 1 year of Sentinel-2A observations from December 2015 to December 2016. |
| Europe | CLC Land Cover Database (Europe) | Contains Corine Land Cover 2018 (CLC2018) datasets produced within the frame (What?) the Copernicus Land Monitoring Service referring to land cover / land use status of year 2018. |
| India | LULC Land Cover Database (India) | Contains Land Use / Land Cover (LULC) for India on 1:250,000 scale and published under Bhuvan-Thematic Services of the National Remote Sensing Centre (NRSC), Indian Space Research Organization (ISRO). |
| Australia | DLCD Land Cover Database (Australia) | Contains the dynamic Land Cover Dataset of Australia i.e. the first nationally consistent and thematically comprehensive land cover reference for Australia. It is the result of a collaboration between Geoscience Australia and the Australian Bureau of Agriculture and Resource Economics and Sciences, and provides a base-line for identifying and reporting on change and trends in vegetation cover and extent. |
| New Zealand | LCDB Land Cover Database (New Zealand) | Contains the New Zealand Land Cover Database (LCDB), i.e. a multi-temporal, thematic classification of New Zealand's land cover. |
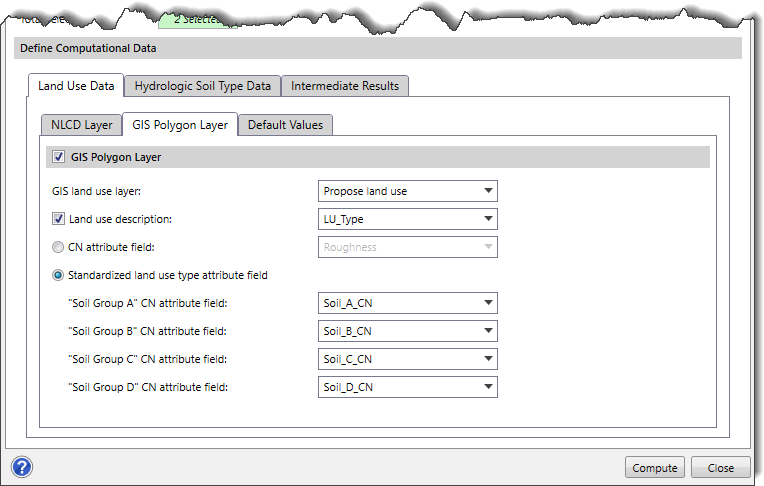
The GIS Polygon Layer subpanel is used for user-defined land use polygon data. The land use data can either directly assign the CN value for each polygon or provide a standard land use type for the software to cross reference. When the user makes the Standardized land use type attribute field radio button entry active, then the Soil Group CN attribute field dropdown combo box entries become enabled. The Soil Group CN attribute field dropdown combo box entries show text, float, and integer fields contained within the selected land use layer. Then, the software determines which CN value should be applied based upon the corresponding land type and CN value.
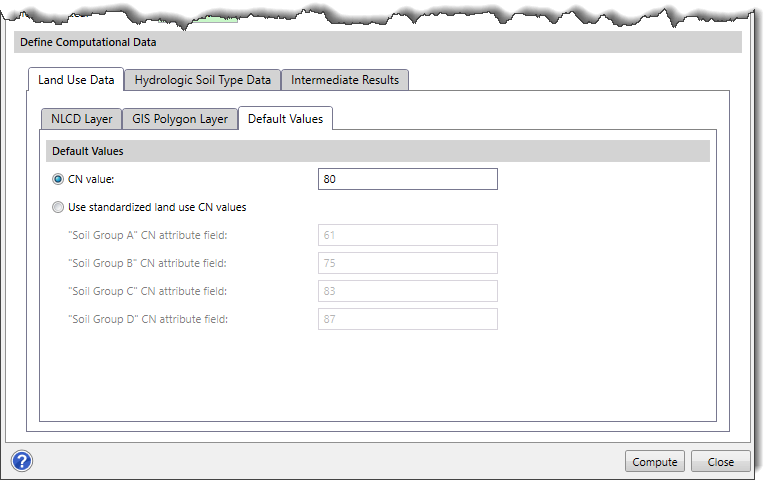
The Default Values subpanel is used to define the default CN value or standardized land use type for the software to cross-reference. The user can enter integer or float values into these default value fields.
The Hydrologic Soil Type Data panel contains three subpanels, which are described below:
The NRCS Layer subpanel uses data from the NRCS Soil Survey Database to determine the hydrologic soil group data for the watershed region.
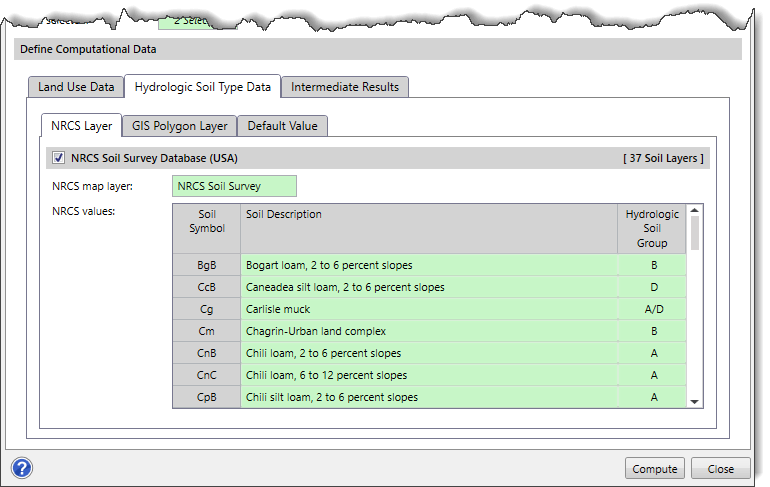
If in GeoHECHMS a soil is assigned to a dual hydrologic group (A/D, B/D, or C/D), the first letter is for drained areas and the second is for undrained areas.
Note that for countries other than the USA, the software provides similar soil survey databases. The content of this data panel will change to represent the one that is available for the project area. Currently, our software supports Africa, Australia, Canada, Europe, India, New Zealand, and the USA land cover database.
The NRCS Layer subpanel will be replaced by other subpanels based on the modeling region, as described below:
| Region | Displayed Soil Group Data Layer | Soil Group Data Description |
|---|---|---|
| USA | NRCS Soil Survey Database (USA) | Contains the Soil Survey Geographic (SSURGO) data by the United States Department of Agriculture's Natural Resources Conservation Service (NRCS). |
| Canada | SLC Soil Survey Database (Canada) | Contains the national scale thematic dataset displaying the classification of soils in terms of provincial Detailed Soil Surveys (DDS) polygons, Soil Landscape Polygons (SLCs), Soil Order, and Great Group. |
| Africa | Soil Survey Database (Africa) | Contains the harmonized soil data showing the soil classes at the continent scale produced for the Soil Atlas of Africa. |
| Europe | ESDB Soil Survey Database (Europe) | Contains the European Soil Database (ESDB), the harmonized soil database for Europe, also extending to Eurasia. |
| Global | Soil Survey Database (Global) | Contains the Hydrologic Soil Groups (HYSOGs250m) with worldwide coverage for curve number-based runoff modeling. This dataset from the Oak Ridge National Laboratory Distributed Active Archive Center (ORNLDAAC) provides a globally consistent, gridded dataset of hydrologic soil groups (HSGs) with a geographical resolution of 1/480 decimal degrees, corresponding to a projected resolution of approximately 250 x 250 meters. These data were developed to support USDA-based curve-number runoff modeling at regional and continental scales. |
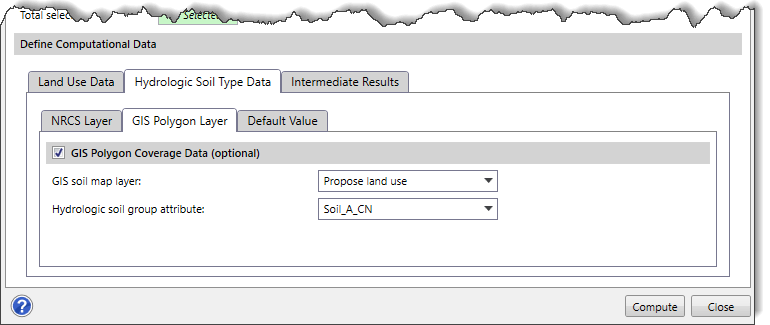
The GIS Polygon Layer subpanel is used for the user-defined soil map polygon data. The soil map data provides hydrologic soil group data for each defined polygon.
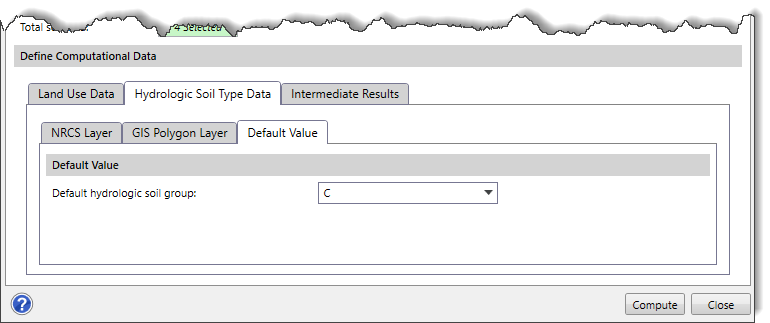
The Default Value subpanel is used to define a default hydrologic soil type for the software to cross-reference as shown below.
The Intermediate Results panel allows the user to compute the intermediate results of the selected subbasin(s) in a shapefile, save the results at the user-specified location and load the results in a project. By default, the content of this panel is disabled (i.e., grayed out). Select the Compute Intermediate Results checkbox to enable the content of this panel.
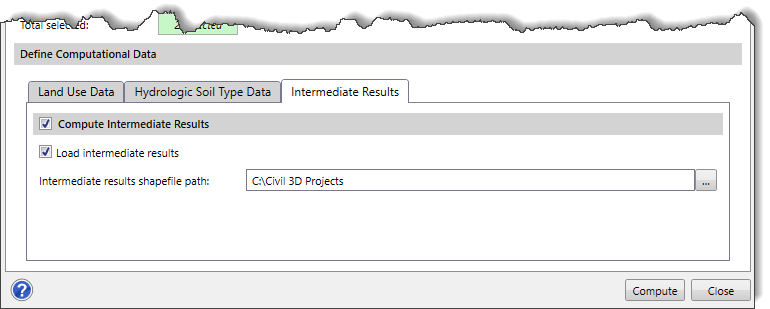
Clicking the […] browse button adjacent to the Intermediate results shapefile path entry field allows the user to define the location where the intermediate computed results will be saved.
Note that the Load intermediate results checkbox should be checked to load the computed intermediate results in a project.
When the data has been defined in the Compute CN dialog box, click the [Compute] button. The software will then look at each selected subbasin and compute the curve number for each subbasin.
After the curve numbers are computed, the values will be shown in the Compute CN editable column, as shown below. The software also allows the user to modify these computed values.
Once the curve numbers are computed, all HEC-HMS stormwater methods that require a curve number will have the data populated into the appropriate fields.
Note that while the computation is running, the [Close] button changes to [Cancel] so that the user can abort applying the computed curve numbers if desired.
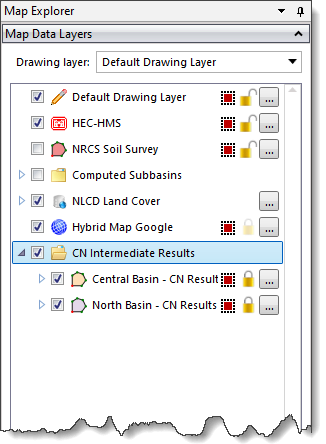
In the Map Data Layers panel, the software provides a data legend for computed intermediate results of each subbasin layer that lists the land covers included within that layer. The user can expand the layer to view the data legend.
Clicking on the […] button adjacent to the computed intermediate results of each subbasin layer will display the GIS polygon properties dialog box, allowing the user to adjust the color and style of the polygon(s) according to the land and soil type. To learn more about the GIS polygon properties dialog box, refer to this article in our knowledge base.


CivilGEO G2 Reviews
4.8/5.0 Rating, Over 230 Reviews

GeoHECRAS is recognized as the top Civil Engineering Design Software with an average of 4.8 out of 5.0 rating from over 230 real user reviews on G2.


We use cookies to give you the best online experience. By agreeing you accept the use of cookies in accordance with our cookie policy.
When you visit any web site, it may store or retrieve information on your browser, mostly in the form of cookies. Control your personal Cookie Services here.


