
Welcome to CivilGEO Knowledge Base
Welcome to CivilGEO Knowledge Base
In GeoHECRAS, the Hydraulic Parameters-Cross Sections command is used to define the hydraulic parameters that are used for building cross section rating curves. During unsteady flow simulations, GeoHECRAS converts the geometry of cross sections into a set of rating curves defining relationships between hydraulic parameters and stage. When running a hydraulic model, the software picks values from these curves rather than computing hydraulic parameters for each time step, which speeds up the unsteady flow computations. This data is only used for unsteady flow simulations and is ignored for steady flow simulations.
Follow the steps below to use the Hydraulic Parameters – Cross Sections command:
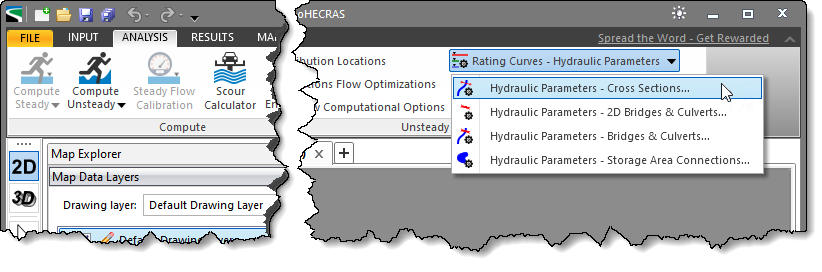
The following sections describe the Hydraulic Parameters – Cross Sections command and how to interact with the above dialog box.
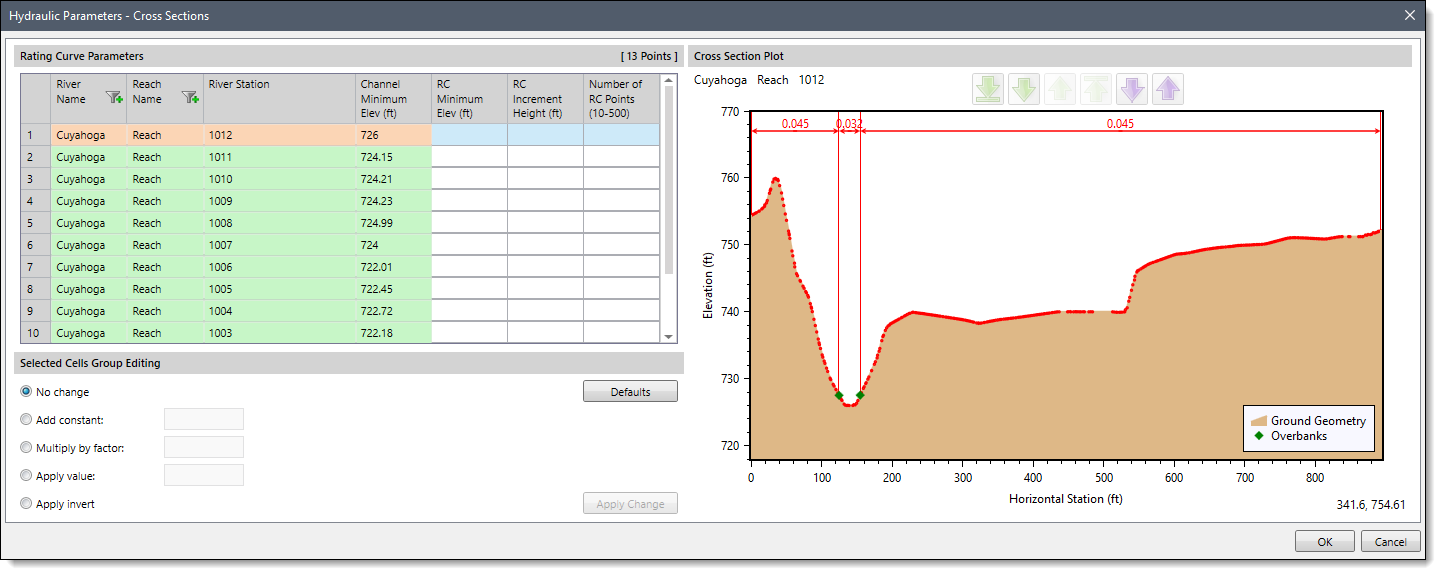
This section contains three editable columns within a data grid in which the user can enter minimum elevation, increment height, and the number of points for the rating curve. The remaining columns are read-only. The first time the user opens the dialog box, all the columns are automatically filled.
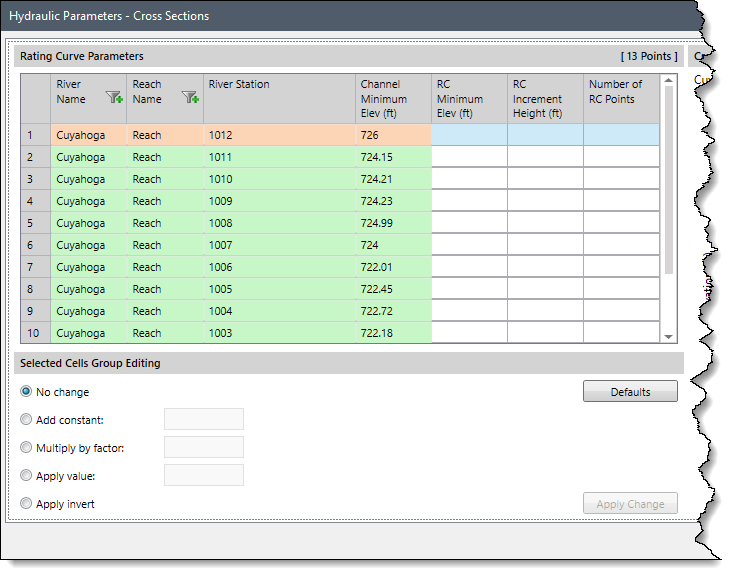
The data in the following columns are editable:
Note that the River Name and Reach Name columns can be filtered, allowing the user to select specific rivers and reaches for review.
In addition, the user can use the cut, copy, and paste commands (using standard Windows function keys) to move data to and from the Windows clipboard.
This section allows the user to manipulate the cell values for the above-described column entries. The user can select a range of cells (or an entire data column) and use the following group editing radio button options:
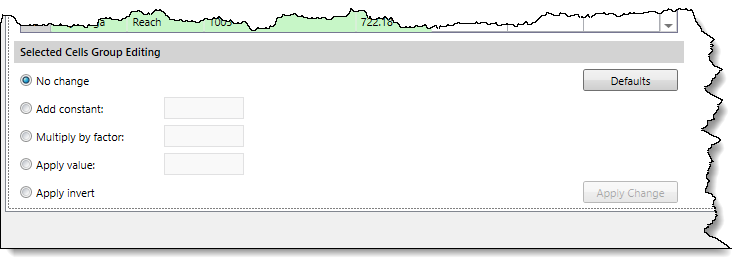
Once the required group editing radio button option is selected, the user can click the [Apply Change] button to complete the editing process.
Note that the [Apply Change] button is only available when a group editing radio button option other than the default No Change option is selected.
If cells are selected in the data grid, then clicking the [Defaults] button resets the selected cells back to their default values. If no cells are selected, then clicking the [Defaults] button resets the entire table back to its default values.
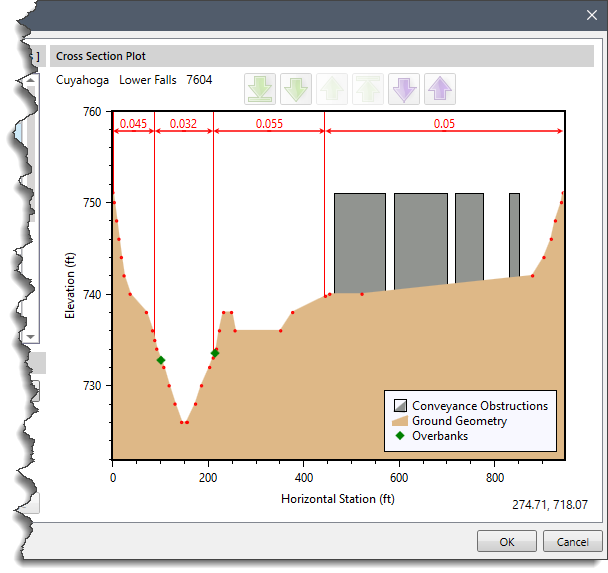
The Cross Section Plot section displays the cross section that is selected in the Rating Curve Parameters table, along with lines representing the corresponding rating curve elevation values.
After entering the appropriate information, the user can click the [OK] button.


CivilGEO G2 Reviews
4.8/5.0 Rating, Over 230 Reviews

GeoHECRAS is recognized as the top Civil Engineering Design Software with an average of 4.8 out of 5.0 rating from over 230 real user reviews on G2.


We use cookies to give you the best online experience. By agreeing you accept the use of cookies in accordance with our cookie policy.
When you visit any web site, it may store or retrieve information on your browser, mostly in the form of cookies. Control your personal Cookie Services here.


