
Welcome to CivilGEO Knowledge Base
Welcome to CivilGEO Knowledge Base
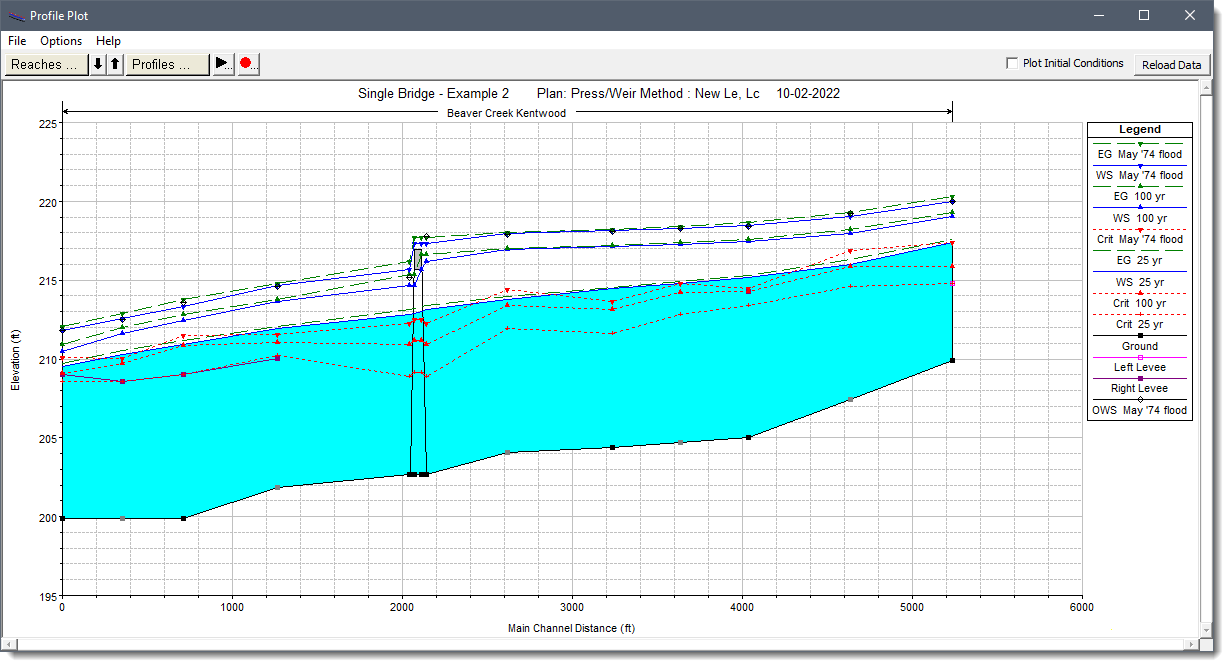
The software can generate profile plots (sometimes called long sections or longitudinal profiles) of the HEC‑RAS steady flow and unsteady flow computational results, displaying the water surface elevation, energy gradeline elevation, critical depth elevation, channel invert, bank stations, structures and more. In addition, the profile plots can be printed and exported to AutoCAD.
Refer to this article in our knowledge base to learn about additional options for customizing the profile plots.
To display the analysis output results in a profile plot, select Profile Plot command from the Results ribbon menu.
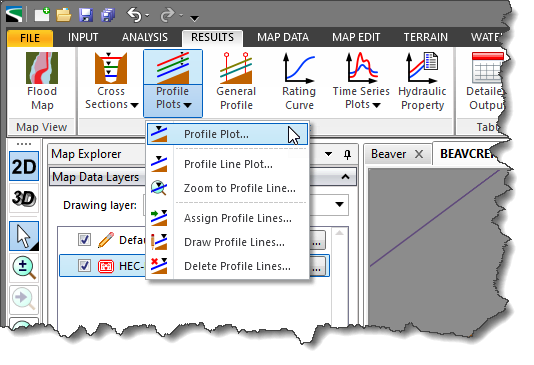
Selecting this menu command will display the HEC‑RAS analysis results in a profile plot.
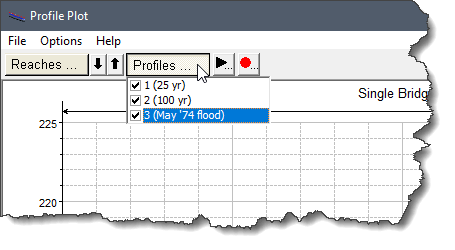
To change which water surface profiles should be displayed on the profile plot, click the [Profiles] button at the top of the window to display a dropdown combo box listing the computed profiles. To plot, select the checkboxes corresponding to specific profiles.
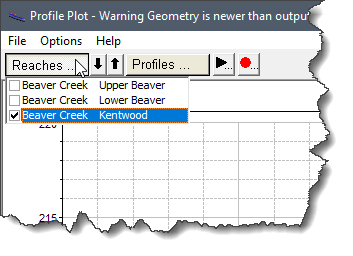
For a HEC‑RAS model with multiple river reaches, the user can select one or more river reaches to plot. Click the [Reaches] button at the top of the window to display a dropdown combo box listing the river reaches contained within the model. To plot, select the checkboxes corresponding to specific river reaches.
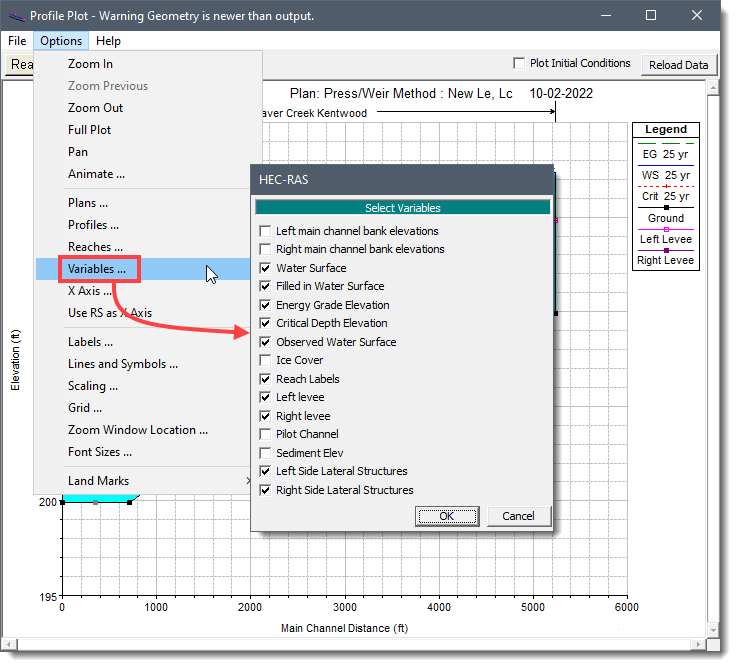
To change the variables to be displayed on the profile plot, select Variables from the Options menu. The software will display the Select Variables dialog box which allows the user to select variables to plot.
The cross section plots can be printed with one or more cross sections per page. To print a single current cross section, select Print from the File menu. The Print Options dialog box will be displayed.
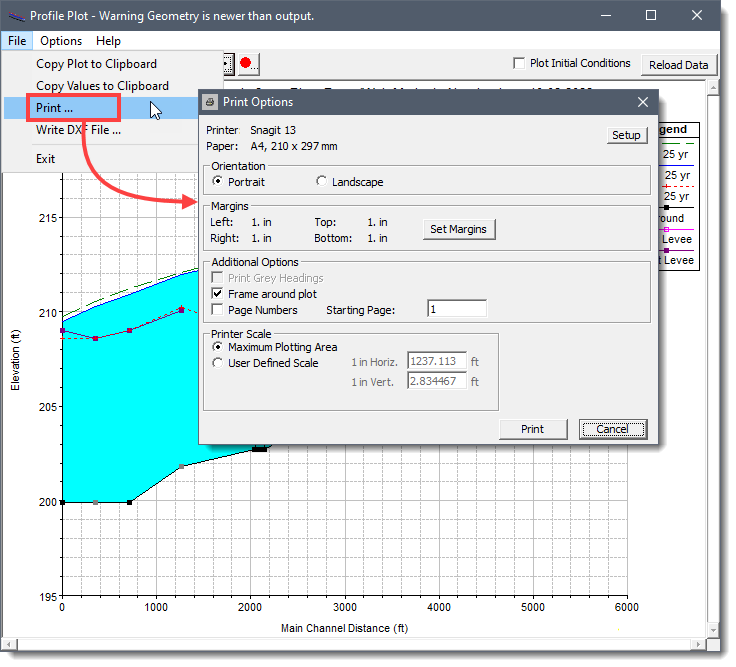
From the displayed dialog box, the user can define the horizontal and vertical print scale to use for printing the profile plots. If the profile plot occupies more than one page, the software will automatically paginate the profile plot across multiple pages.
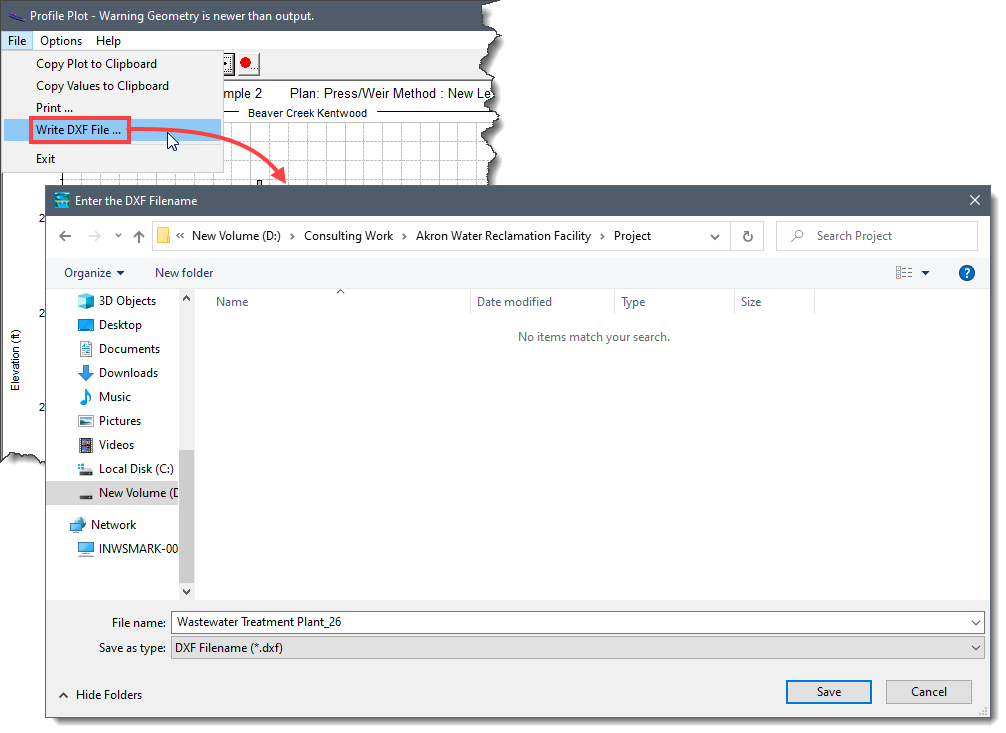
The profile plot can be exported to AutoCAD. To export a profile plot to AutoCAD, select Write DXF File from the File menu. A dialog box will be displayed which allows a specific DXF file name to be exported.


CivilGEO G2 Reviews
4.8/5.0 Rating, Over 230 Reviews

GeoHECRAS is recognized as the top Civil Engineering Design Software with an average of 4.8 out of 5.0 rating from over 230 real user reviews on G2.


We use cookies to give you the best online experience. By agreeing you accept the use of cookies in accordance with our cookie policy.
When you visit any web site, it may store or retrieve information on your browser, mostly in the form of cookies. Control your personal Cookie Services here.


