
Welcome to CivilGEO Knowledge Base
Welcome to CivilGEO Knowledge Base
In GeoHECRAS, the Steady Flow Data command allows the user to define the flow profiles and corresponding boundary conditions data to perform a steady flow analysis.
A steady flow model can have several river reaches and by using the Steady Flow Data command, the user can define the steady flow data for each river reach. Steady flow data consists of boundary conditions, initial conditions, and discharge information (peak flows or flow data from a specific period in time).
This article explains how to enter steady flow data and boundary conditions using the Steady Flow Data command.
Follow the steps below to use the Steady Flow Data command:


The following sections describe how to use the Steady Flow Data command and interact with the above dialog box.
This section contains Downstream Boundary Conditions, Upstream Boundary Conditions, Flow Data, Interior Change, and Gate Openings panels to enter flow profiles and corresponding boundary conditions data for performing the steady flow analysis.
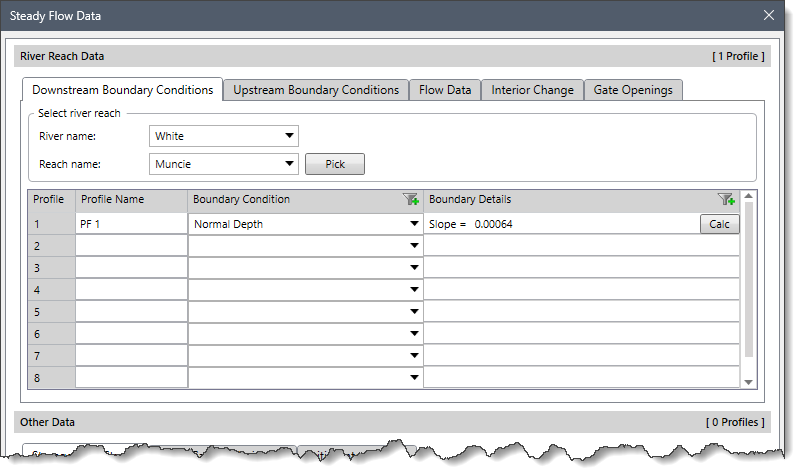
This panel allows the user to define downstream boundary conditions for each profile.
The Select River Reach section allows the user to select a river reach for defining the downstream boundary conditions. Note that if a river reach has been preselected from the Map View before running this command, the selected river and reach will be displayed in the River and Reach dropdown combo boxes.
If the model contains a single river and reach, it will automatically be selected in the River and Reach dropdown combo boxes. If the model contains multiple rivers and reaches, the user can select the desired river and reach from the River and Reach dropdown combo boxes.
Alternatively, the user can click the [Pick] button to select the river reach from the Map View. Clicking on the [Pick] button causes the dialog box to temporarily disappear, and the user will be prompted to select the river reach from the Map View. Note that only one river reach can be selected at a time. After selecting a river reach, the dialog box will be redisplayed with the river reach shown as selected. The selected river reach is highlighted on the Map View.
The Downstream Boundary Conditions panel contains a table that defines the downstream boundary conditions on a profile-by-profile basis. Note that connections to junctions are considered internal boundary conditions. Internal boundary conditions are automatically listed in the table based on how the river system was defined. The user is only required to enter the necessary external boundary conditions.
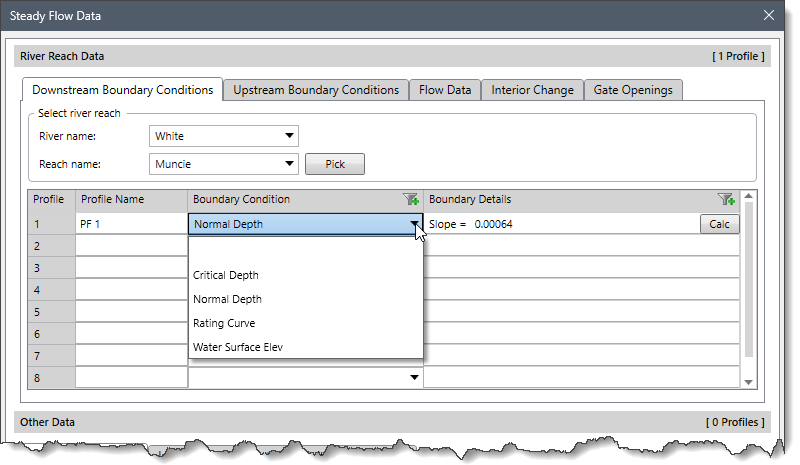
The following data are defined in this table:
 Selecting the Rating Curve option causes the following informational dialog box to be displayed.
 Changing a boundary condition from a rating curve to a different option causes the following confirmational dialog box to be displayed.
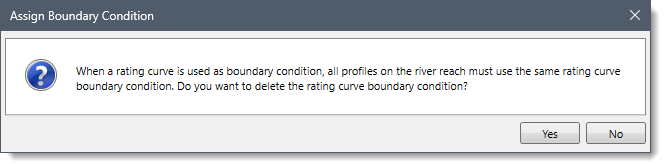 Click the [Yes] button and the rating curve boundary condition will be deleted. To abort the process, click the [No] button.To learn about boundary condition types in detail, refer to this article in our knowledge base.
| Boundary Condition | Boundary Details Field Descriptions |
|---|---|
| Normal Depth | The user is required to enter the energy slope value. This value represents the energy grade slope at the downstream boundary. In addition, a [Calc] button is provided. If the energy is unknown, the user could approximate it by clicking the [Calc] button. Note that if the computed slope is less than 0.000010, the software will assign a default (minimum) value of 0.000010. |
| Water Surface Elev | The user is required to enter a known water surface elevation value for each of the profiles to be computed. This value represents the water surface elevation at the downstream boundary. |
| Critical Depth | Nothing is to be entered. The software automatically calculates the critical depth for each of the profiles and uses that as the boundary condition. |
| Rating Curve | The user is required to enter an elevation versus flow rating curve. When this type of boundary condition is selected, a [Define…] button is provided in the first row of the Boundary Details column. The other rows of this column do not show a [Define…] button. Clicking a [Define…] button will display a Rating Curve dialog box to define the boundary condition data. Note that there can be separate rating curves for each boundary in a river reach. However, there is only one rating curve defined for a boundary (not separate rating curves for each profile). |
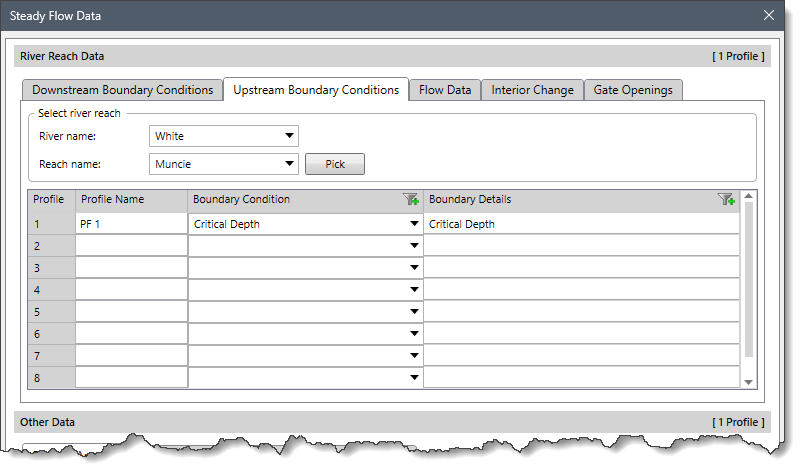
This panel allows the user to define upstream boundary conditions data. It should be used only when a supercritical or mixed flow regime is being analyzed.
Note that this panel is similar to that of the Downstream Boundary Conditions panel. Refer to the Downstream Boundary Conditions Panel part of this article to learn more about the Upstream Boundary Conditions panel.
This panel allows the user to define the flow to be analyzed for the selected river reach. It contains a flow data table that has rows corresponding to profiles to be analyzed and columns corresponding to cross section river stations.

The Select interior location section provides read-only dropdown combo boxes to select the river, reach, and river station. The [Pick] button is used to select the interior cross section river stations from the Map View.
Note that the River station dropdown combo box lists all of the interior cross section river stations for the current river reach, including the downstream most cross section. It does not list the upstream most cross section (at the upstream end of the current river reach), nor roadway crossing or inline structure river stations. In addition, it excludes cross sections already added as interior cross sections in the table to prevent the addition of duplicate entries.
The Flow Data panel contains a table that defines flow data. The following data are defined in this table:
The remaining fields of the table are used to define the discharge to be analyzed in the river reach.
The software automatically adds the cross section river station corresponding to the upstream end of the selected river reach next to the Profile Name column of the table. Note that a flow value must be defined for this column. This flow value is assumed to remain constant and is internally propagated to subsequent downstream cross sections until another flow value is defined.
To change the flow along the current river reach, select the interior cross section river station from the River station dropdown combo box and then click the [Add Flow Change Location] button. A column will be added in the table corresponding to the selected cross section river station. The new flow value will be assumed to remain constant for subsequent downstream cross sections until another flow change location is defined. Note that the flow data columns are automatically sorted with the left corresponding to upstream river stationing and the right corresponding to downstream river stationing.
To delete a flow change location column from the table, click on the [X] close button at the top of the column. The software will display the following confirmational dialog box:
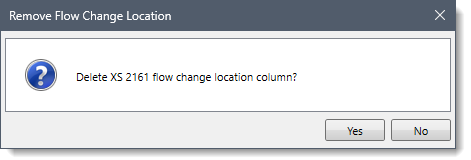
Click the [Yes] button and the flow change location column will be deleted from the table. To abort the process, click the [No] button.
This panel allows the user to set specific changes in the water surface and energy between any two cross sections in the steady flow model. The changes in water surface and energy can be set for a specific profile in a multiple-profile model.
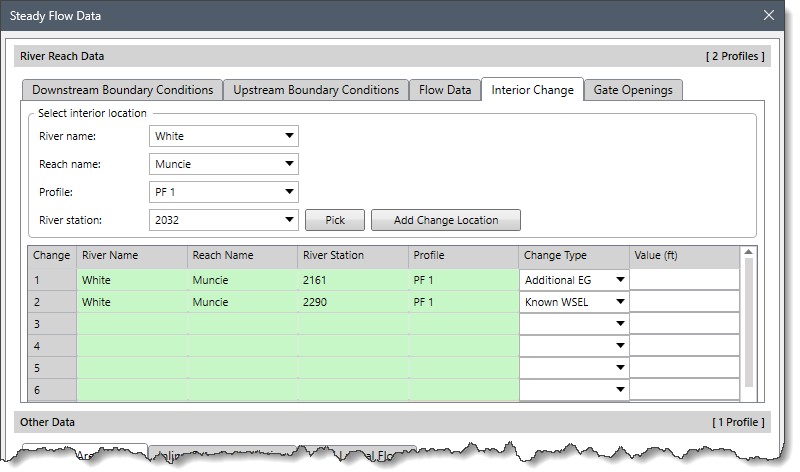
The Select interior location section provides read-only dropdown combo boxes to select the river, reach, river station, and profile to which the user would like to add an internal change. The [Pick] button is used to select the river station from the Map View.
Once the user has established a location and profile, click the [Add Change Location] button. The software will add data in the table corresponding to the River Name, Reach Name, River Station, and Profile columns.
Note that the River station dropdown combo box excludes river stations already added in the table to prevent the addition of duplicate entries.
In the Change Type column, the user can select one of the following options:
In the Value column, the user can enter a number, which represents the magnitude of the internal change or required coefficient.
This panel allows the user to control gate openings for any inline or lateral gated spillways that have been added to the geometric data.
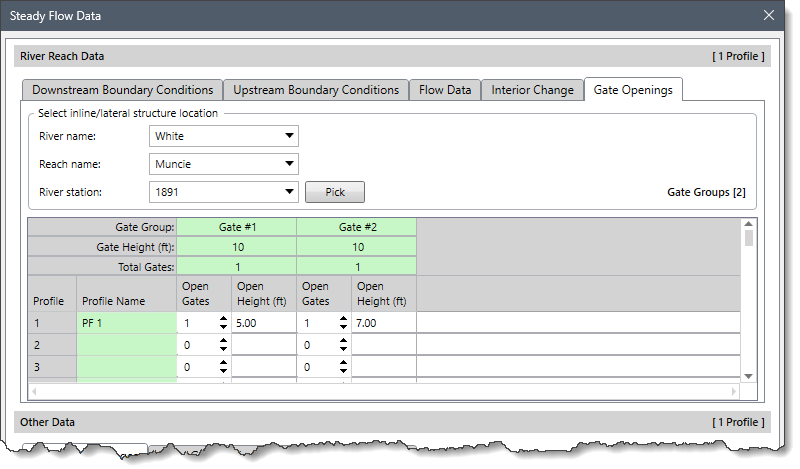
The Select inline/lateral structure location section provides read-only dropdown combo boxes to select the river, reach, and river station. The [Pick] button is used to select the inline or lateral structure location from the Map View.
Once the user has established an inline/lateral structure location, the software will add corresponding gate opening data along with the profile name in the table. The user can then specify how many gates are opened per gate group in the Open Gates column and at what elevation they are opened in the Open Height(ft) column.
For example (in the above image), there are two gate groups labeled “Gate #1”, and “Gate #2.” Each gate group has one identical gate opening. “Gate #1″has a maximum opening height of five feet and “Gate #2” has a height of seven feet. For profile number 1, all gate groups are opened. This type of information must be entered for all of the profiles being computed.
This section contains Storage Area Stages, Inline Gate Optimization, and Initial Lateral Flows panels to enter additional data for performing the steady flow analysis.
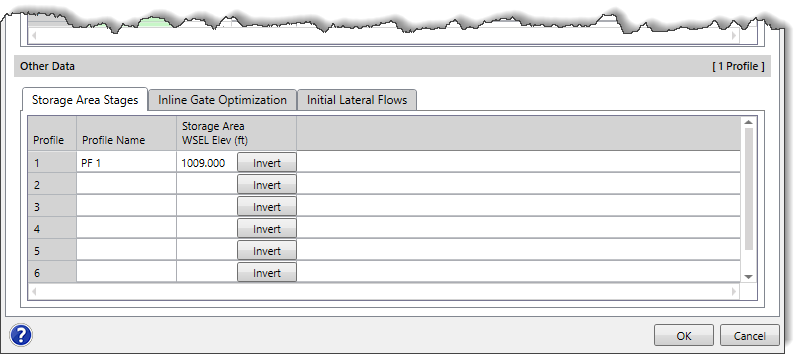
This panel allows the user to enter water surface elevations for the defined storage areas. Storage areas are most often used in unsteady flow modeling, but they may also be part of a steady flow model. When using storage areas within a steady flow analysis, the user is required to enter a water surface elevation for each storage area for each profile.
This panel contains an elevation data table that has rows corresponding to profiles to be analyzed and columns corresponding to each of the defined storage areas.
By default, the software will keep the initial stage to the invert of the storage area in the column corresponding to each of the defined storage areas. However, the user can enter different water surface elevation values. In addition, the user can select a cell and then click the [Invert] button and the software will overwrite the value with the invert of the storage area.
Note that if a minimum elevation is not defined for the storage area, the following informational dialog box will be displayed on clicking the [Invert] button:
 If a minimum elevation data is defined for the storage area, the following confirmational dialog box will be displayed on clicking the [Invert] button:
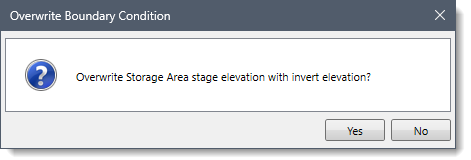
Click the [Yes] button and the storage area stage elevation will be overwritten with the invert elevation. To abort the process, click the [No] button.
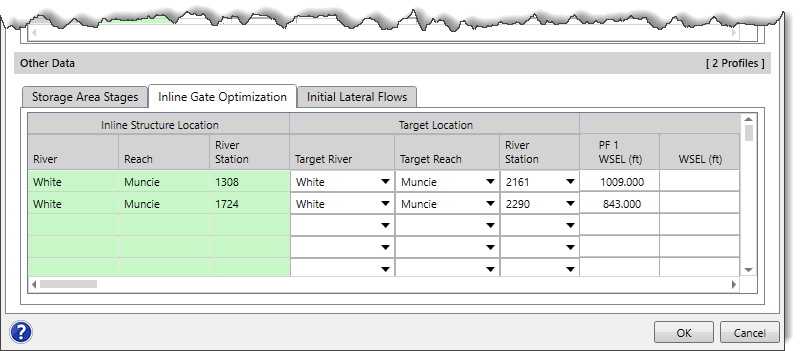
This panel allows the user to direct the software to compute a gate setting at a structure in order to obtain a user-specified water surface upstream of the structure. After defining the upstream stage for each profile, the software will iterate with different gate settings until the desired upstream water surface is obtained.
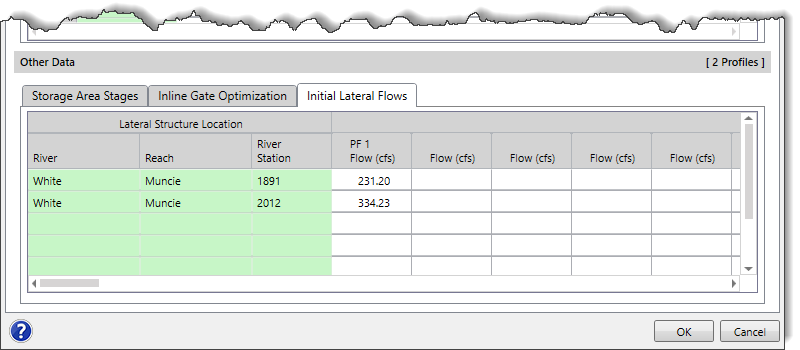
This panel allows the user to enter initial estimates of the flow that is leaving the main river through a lateral structure. Flow values can be entered for each profile. The user-entered flow is subtracted from the main river before the first profile is computed. This panel is very handy in reducing the required computation time or allowing the software to reach a solution that may not have been achievable.


CivilGEO G2 Reviews
4.8/5.0 Rating, Over 230 Reviews

GeoHECRAS is recognized as the top Civil Engineering Design Software with an average of 4.8 out of 5.0 rating from over 230 real user reviews on G2.


We use cookies to give you the best online experience. By agreeing you accept the use of cookies in accordance with our cookie policy.
When you visit any web site, it may store or retrieve information on your browser, mostly in the form of cookies. Control your personal Cookie Services here.


