In hydraulic modeling, a time series node refers to a specific point or location within a hydraulic system where time series data are collected, analyzed, or specified. These nodes are used to define the time-varying boundary conditions or parameters at a particular location along a river or channel.
Time series nodes are commonly used to represent water levels, flow rates, velocities, or any other variable that changes over time. This information helps in project simulation and analysis, and sheds light on how these parameters fluctuate at different points in the hydraulic system, all of which provides insights into:
- Dynamic behavior of water flow
- Flood propagation
- Sediment transport
- Other hydraulic phenomena
In GeoHECRAS, the user can create time series nodes on the Map View using the Assign Time Series Nodes and Draw Time Series Nodes commands. Both commands have similar functionality but somewhat distinct workflows.
Assigning Time Series Nodes
The Assign Time Series Nodes command allows the user to manually assign an existing node on the Map View as a time series node.
Follow the steps below to use the Assign Time Series Nodes command:
- From the Results ribbon menu, click the Time Series Plots dropdown menu and select the Assign Time Series Nodes command.
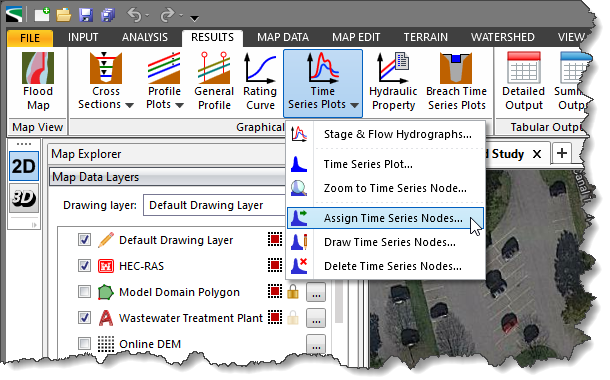
- The Assign Time Series Nodes dialog box will be displayed.
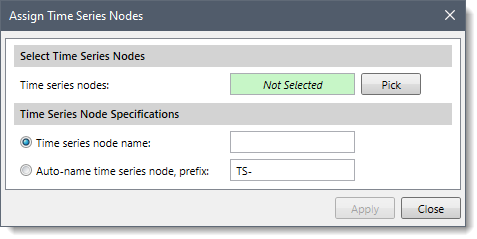
- Click the [Pick] button adjacent to the Time series nodes read-only field.
- The Assign Time Series Nodes dialog box will temporarily disappear, and a prompt will be displayed on the status bar instructing the user to select node(s) from the Map View.
- Select node(s) from the Map View. When finished, press the [Enter] key or right-click and select Done from the displayed context menu.
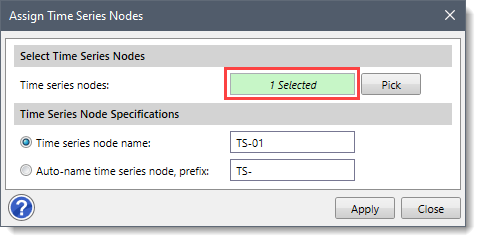
- The Assign Time Series Nodes dialog box will be redisplayed, and the Time series nodes read-only field will display the number of selected node(s).
 Notes:
- If the user selects only one node from the Map View, then the dialog box will be redisplayed with the Time series node name radio button option selected.
- If the user selects more than one node from the Map View, then the dialog box will be redisplayed with the Auto-name time series node, prefix radio button option selected.
- If a single node is selected, then the entry field next to the Time series node name radio button option allows the user to name the selected node.
- If multiple nodes are selected, then the entry field next to the Auto-name time series node, prefix radio button option allows the user to define the prefix for auto-naming the selected nodes. The software auto-names the time series nodes using the defined prefix, for example, TS-##, where ## represents the time series nodes count (i.e., 01, 02, and so on) and TS represents the prefix.
- Click the [Apply] button, and the software will assign the selected node(s) as time series node(s).
Drawing Time Series Nodes
The Draw Time Series Nodes command allows the user to manually draw a time series node on the Map View.
Follow the steps below to use the Draw Time Series Nodes command:
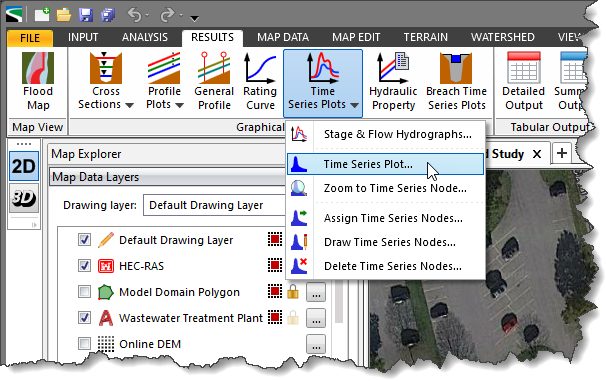
- From the Results ribbon menu, click the Time Series Plots dropdown menu and select the Draw Time Series Nodes command.
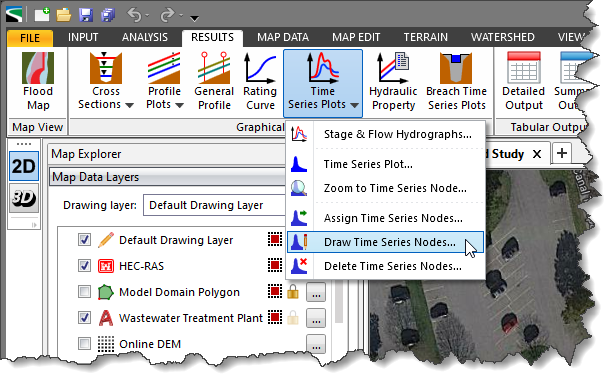
- The Draw Time Series Nodes dialog box will be displayed.
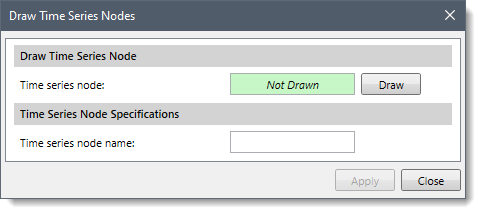
- Click the [Draw] button adjacent to the Time series node read-only field.
- The Draw Time Series Node dialog box will temporarily disappear, and a prompt will be displayed on the status bar instructing the user to draw a node on the Map View.
Notes:
- If the Time series node name radio button option is selected, the user can draw only one time series node at a time.
- If the Auto-name time series node, prefix radio button option is selected, the user can draw multiple time series nodes one after another.
- Draw node(s) on the Map View. When finished, press the [Enter] key or right-click and select Done from the displayed context menu.
- The Draw Time Series Nodes dialog box will be redisplayed, and the status of the Time series node read-only field will change from Not Drawn to Drawn.
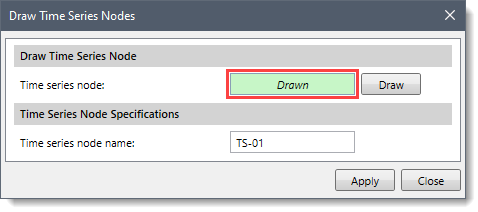
- If a single time series node is drawn, then the entry field next to the Time series node name radio button option allows the user to name it.
- If multiple nodes are drawn, then the entry field next to the Auto-name time series node, prefix radio button option allows the user to define the prefix for auto-naming the time series nodes. The software auto-names the time series nodes using the defined prefix, for example, TS-##, where ## represents the time series nodes value (i.e., 01, 02, and so on) and TS represents the prefix.
- Click the [Apply] button, and the software will create time series node(s) on the Map View.
Displaying Time Series Plot
The Time Series Plot command of the GeoHECRAS software allows the user to request various types of output such as water surface elevation, velocity time series, and flow depth time series along the user-defined time series nodes.
Follow the steps below to use the Time Series Plot command:
- From the Results ribbon menu, click the Time Series Plots dropdown menu and select the Time Series Plot command. Alternatively, the user can double-click on the time series node in the Map View.
- The Time Series Plot dialog box will be displayed.
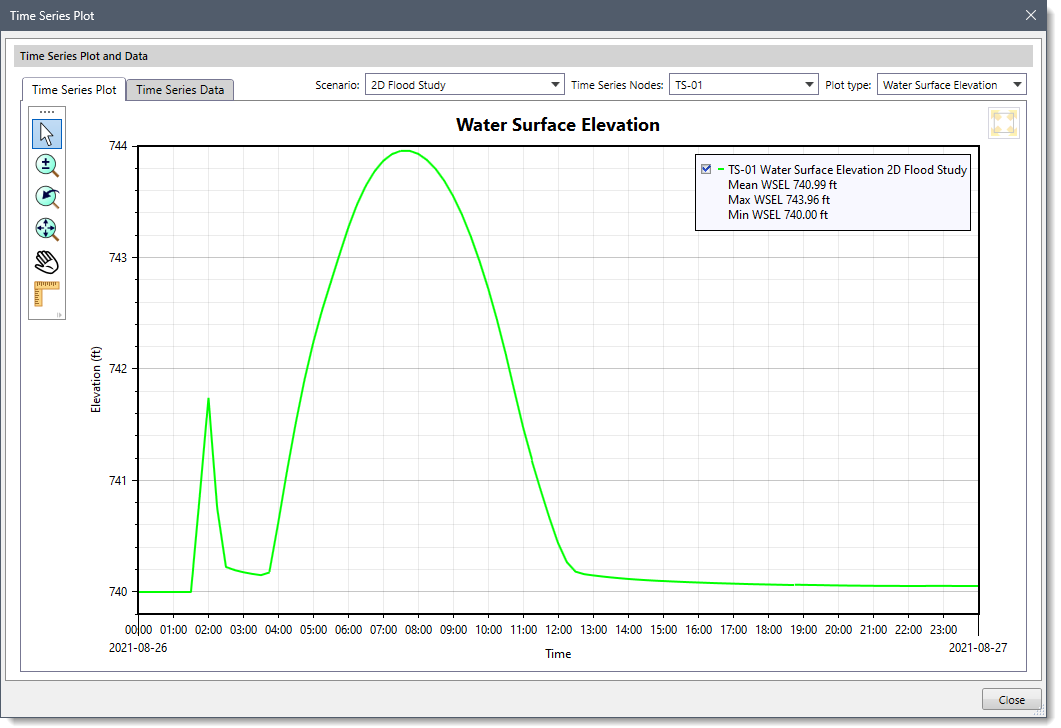
The following sections describe how to use the Time Series Plot command and interact with the above dialog box.
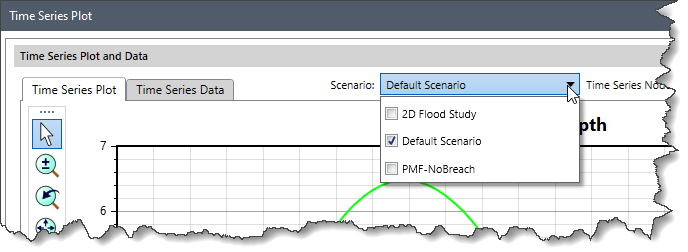
Scenario
The Scenario dropdown combo box allows the user to view output results from different scenarios. To learn more about working with multiple scenarios, refer to this article in our knowledge base.
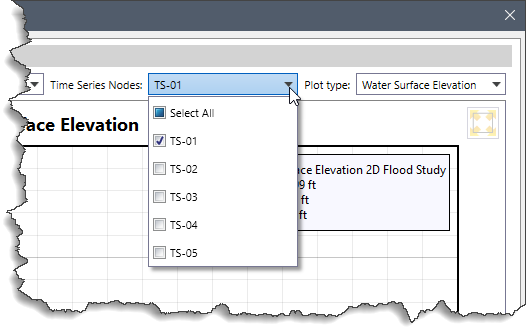
Time Series Nodes
The Time Series Nodes dropdown combo box allows the user to select which output results from time series node to display. The plot can display output results for multiple time series nodes at the same time.
Note that the user can check the Select All checkbox to select all the time series nodes at once.
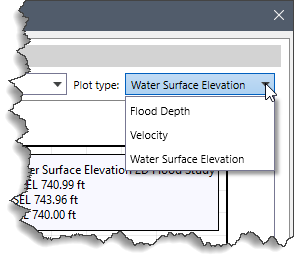
Plot type
The Plot type dropdown combo box allows the user to view various types of data output along the selected time series node(s). The following options are listed in the dropdown combo box:
- Flood Depth
- Velocity
- Water Surface Elevation
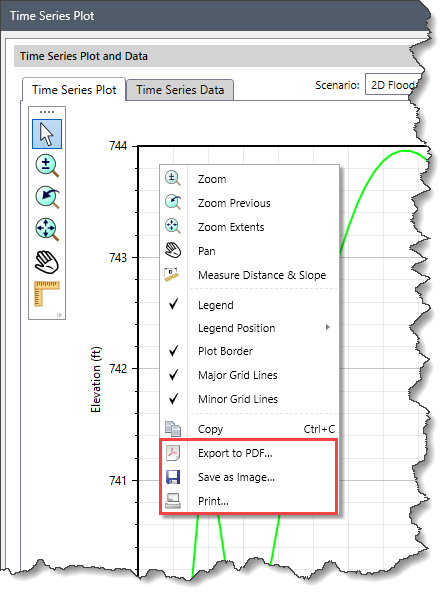
The GeoHECRAS software also allows the user to create professional printouts of time series node plots and to save them as image files as well as export them to PDF files. To print or export the results of a time series node plot into a different format, right-click anywhere on the plot and select the Export to PDF, Save as Image, or Print options.
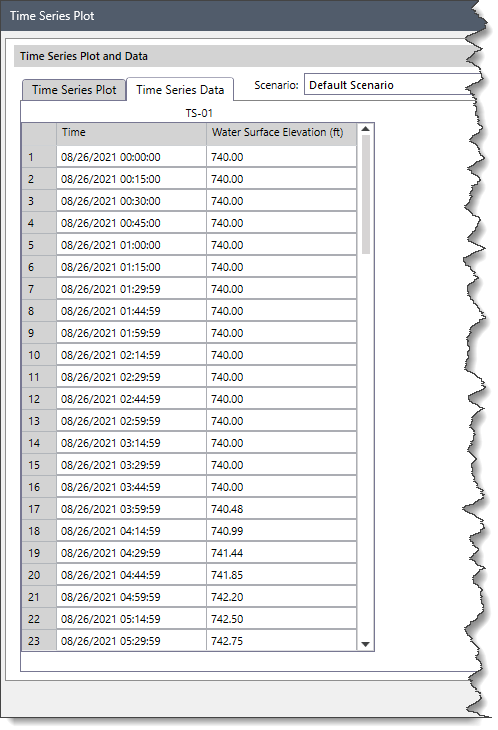
Time Series Data
The Time Series Data tab contains a table that displays results for the selected time series node(s).
Deleting Time Series Nodes
The Delete Time Series Nodes command allows the user to selectively delete the user-defined time series nodes from the project.
Follow the steps below to use the Delete Time Series Nodes command:
- From the Results ribbon menu, click the Time Series Plots dropdown menu and select the Delete Time Series Nodes command.
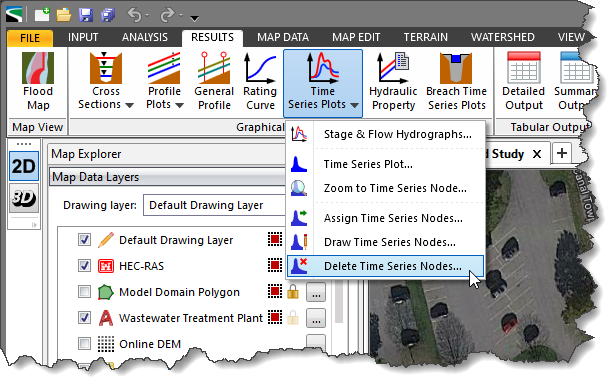
- The Delete Time Series Nodes dialog box will be displayed.
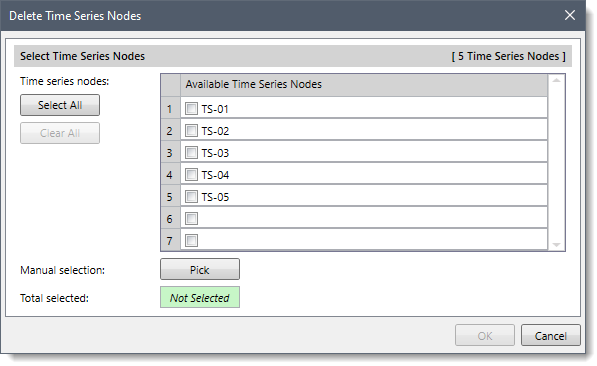
- In the Available Time Series Nodes grid, check the checkboxes corresponding to the time series nodes you want to delete. Alternatively, click the [Pick] button to select the time series nodes from the Map View.
![[Pick] button](/wp-content/uploads/sites/25/2024/03/Time-Series-Nodes-Img-16.png) Note: To select all the time series nodes at once, click the [Select All] button..
Note: To select all the time series nodes at once, click the [Select All] button..
- The number of selected time series nodes will be displayed in the Total selected read-only field.
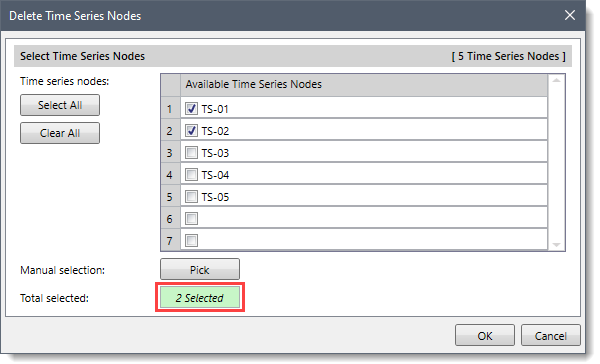 Note: To cancel the previous selection and redo the entire process, click the [Clear All] button.
- After selecting the time series nodes, click the [OK] button.
- The following confirmational dialog box will be displayed.
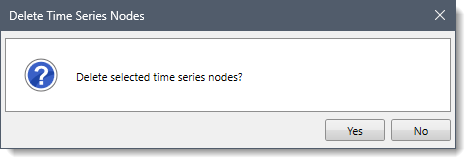
- Click the [Yes] button and the selected time series nodes will be deleted. To abort the process, click the [No] button.
Zooming Time Series Nodes
The Zoom to Time Series Node command allows the user to selectively zoom to the user-defined time series nodes on the Map View.
Follow the steps below to use the Zoom to Time Series Node command:
- From the Results ribbon menu, click the Time Series Plots dropdown menu and select the Zoom to Time Series Node command.
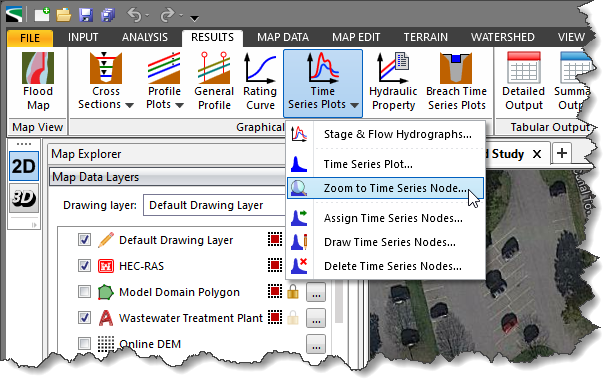
- The Zoom to Time Series Node dialog box will be displayed.
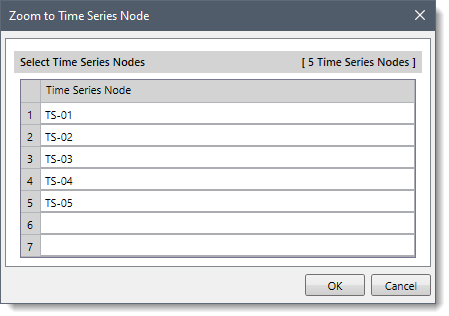
- In the Select Time Series Nodes section, select the time series node you want to zoom to. Click the [Ok] button.
![[Ok] button](/wp-content/uploads/sites/25/2024/03/Time-Series-Nodes-Img-21.png)
- The software will then zoom to the selected time series node and the time series node will be highlighted on the Map View.


