
Welcome to CivilGEO Knowledge Base
Welcome to CivilGEO Knowledge Base
HEC‑RAS has the ability to compute high flows (flows that come into contact with the highest point of the bridge deck low chord) by either the energy equation (standard step method) or by using separate hydraulic equations for pressure and/or weir flow. These two methodologies are explained below.
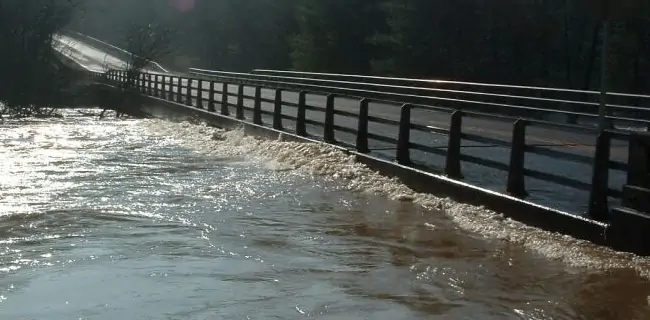
Bridge experiencing pressure (orifice) flow
The energy‑based (standard step) method is applied to high flows in the same manner as it is applied to low flows. The HEC‑RAS computations are based on balancing the energy equation in three steps through the bridge. Energy losses are based on friction and contraction and expansion losses. Output from this method is available at the cross sections inside the bridge as well as outside.
With the energy equation, friction losses are based on the use of Manning’s equation. Contraction and expansion losses are based on the loss coefficient times the change in velocity head.
The energy‑based method performs all computations as though they are open channel flow. At the cross sections inside the bridge, the area obstructed by the bridge piers, abutments, and deck is subtracted from the flow area and additional wetted perimeter is added. Occasionally the resulting water surfaces inside the bridge (at bridge interior cross sections at the upstream and downstream sides) can be computed at elevations that would be within the interior of the bridge deck. The computed water surfaces within the bridge deck reflect the hydraulic gradeline elevations, but not necessarily the actual water surface elevations. Additionally, the active flow area is limited to the open bridge area.
A second approach for computing high flows is to utilize separate hydraulic equations to compute the flow as pressure (orifice) and/or weir flow. The two types of flow are presented below.
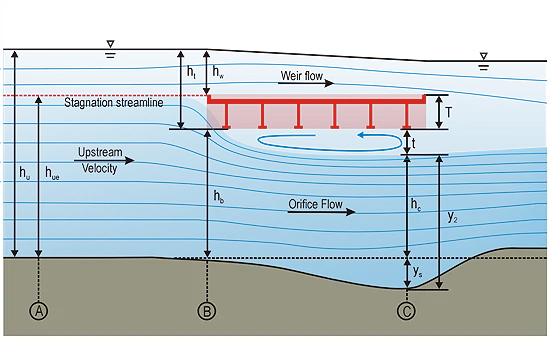
Pressure flow occurs when the flow comes into contact with the low chord of the bridge. Once the flow comes into contact with the upstream side of the bridge, backwater occurs and orifice flow is established. HEC‑RAS will handle two cases of orifice flow:
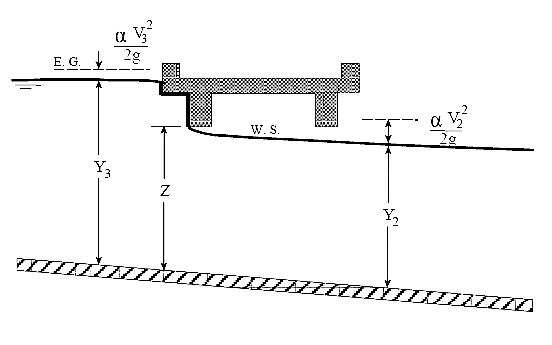
The HEC‑RAS program will automatically select the appropriate equation, depending upon the flow situation. For the first case (see below figure), a sluice gate type of equation is used (FHWA, 1978):
 |
(1) |
Where:
Q = Total discharge through the bridge opening
Cd = Coefficients of discharge for pressure flow
ABU = Net area of the bridge opening at cross section BU
Y3 = Hydraulic depth at cross section 3
Z = Vertical distance from maximum bridge low chord to the mean river bed elevation at cross section BU
The discharge coefficient Cd, can vary depending upon the depth of water upstream. Values for Cd range from 0.27 to 0.5, with a typical value of 0.5 commonly used in practice. The user can enter a fixed value for this coefficient or the program will compute one based on the amount that the bridge opening is submerged. A diagram relating Cd to Y3/Z is shown in given figure.
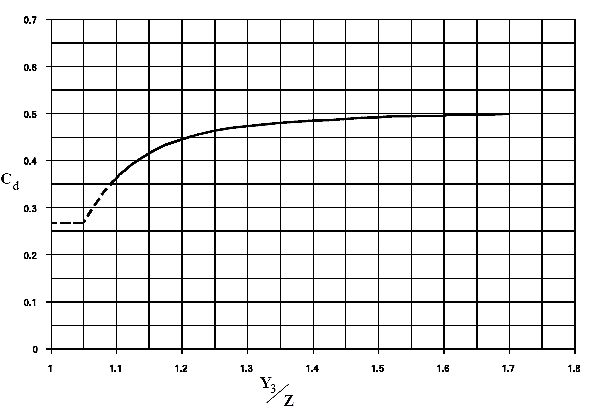
As shown in above figure, the limiting value of Y3/Z is 1.1. There is a transition zone somewhere between Y3/Z = 1.0 and 1.1 where free surface flow changes to orifice flow. The type of flow in this range is unpredictable, and equation mentioned above is not applicable.
In the second case, when both the upstream and downstream side of the bridge is submerged, the standard full flowing orifice equation is used (see below figure). This equation is as follows:
| (2) |
Where:
C = Coefficient of discharge for fully submerged pressure flow. Typical value of C is 0.8.
H = The difference between the energy gradient elevation upstream and the water surface elevation downstream.
A = Net area of the bridge opening.
Figure 3: Example of a bridge under fully submerged pressure flow
Typical values for the discharge coefficient C range from 0.7 to 0.9, with a value of 0.8 commonly used for most bridges. The user must enter a value for C whenever the pressure flow method is selected. The discharge coefficient C can be related to the total loss coefficient, which comes from the form of the orifice equation that is used in the HEC‑2 computer program (HEC, 1991):
 |
(3) |
Where: K = Total loss coefficient
The conversion from K to C is as follows:
 |
(4) |
The program will begin checking for the possibility of pressure flow when the computed low flow energy grade line is above the maximum low chord elevation at the upstream side of the bridge. Once pressure flow is computed, the pressure flow answer is compared to the low flow answer; the higher of the two is used. The user has the option to tell the program to use the water surface, instead of energy, to trigger the pressure flow calculation.
Flow over the bridge, and the roadway approaching the bridge is calculated in HEC‑RAS using the standard weir equation (see the below figure):
| (5) |
Where:
Q = Total flow over the weir
C = Coefficients of discharge for weir flow
L = Effective length of the weir
H = Difference between energy upstream and road crest
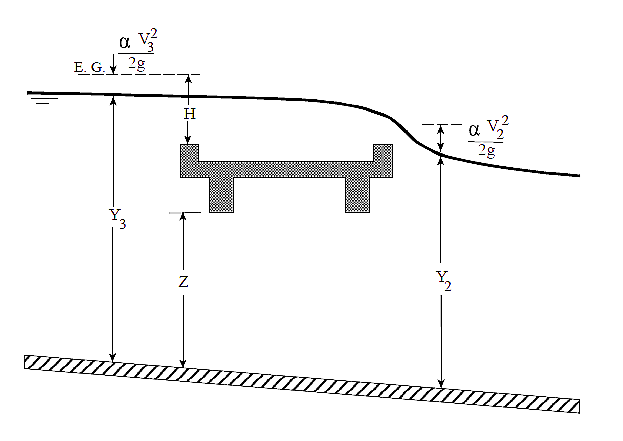
Figure 4: Example bridge with pressure and weir flow
The approach velocity is included by using the energy grade line elevation in lieu of the upstream water surface elevation for computing the head, H.
Under free flow conditions (discharge independent of tailwater) the coefficient of discharge C, ranges from 2.5 to 3.1 (1.38 ‑ 1.71 for metric units) for broad‑crested weirs depending primarily upon the gross head on the crest (C increases with head). Increased resistance to flow caused by obstructions such as trash on bridge railings, curbs, and other barriers would decrease the value of C.
Tables of weir coefficients, C, are given for broad‑crested weirs in King’s Handbook (King, 1963), with the value of C varying with measured head H and breadth of weir. For rectangular weirs with a breadth of 15 feet and a H of 1 foot or more, the given value is 2.63 (1.45 for metric units). Trapezoidal shaped weirs generally have a larger coefficient with typical values ranging from 2.7 to 3.08 (1.49 to 1.70 for metric units).
The “Hydraulics of Bridge Waterways” document (FHWA, 1978) provides a curve of C versus the head on the roadway. The roadway section is shown as a trapezoid and the coefficient rapidly changes from 2.9 for a very small H to 3.03 for H = 0.6 feet. From there, the curve levels off near a constant value of 3.05 (1.69 for metric units).
With very little prototype data available, it seems the assumption of a rectangular weir for flow over the bridge deck (assuming the bridge can withstand the forces) and a coefficient of 2.6 (1.44 for metric units) would be reasonable. If the weir flow is over the roadway approaches to the bridge, a value of 3.0 (1.66 for metric units) would be consistent with available data. If weir flow occurs as a combination of bridge and roadway overflow, then an average coefficient (weighted by weir length) could be used.
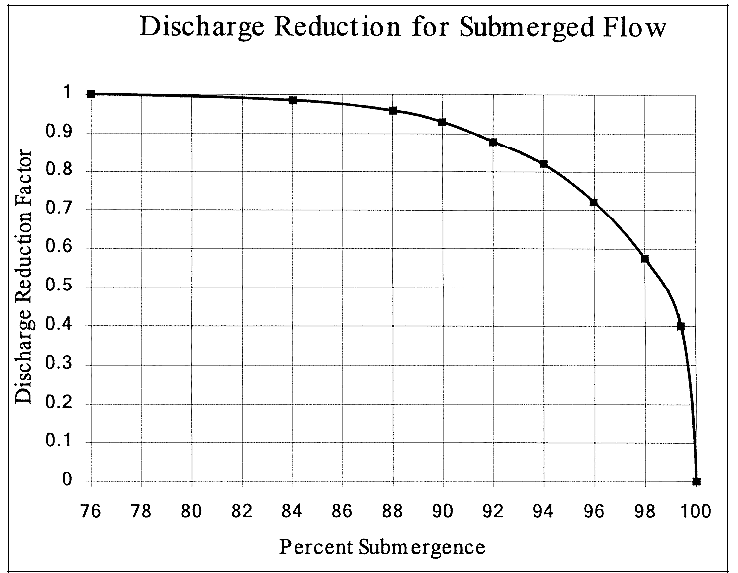
For high tailwater elevations, the program will automatically reduce the amount of weir flow to account for submergence on the weir. Submergence is defined as the depth of water above the minimum weir elevation on the downstream side of the bridge (cross section 2) divided by the height of the energy gradeline above the minimum weir elevation on the upstream side of the bridge (cross section 3). The reduction of weir flow is accomplished by reducing the weir coefficient based on the amount of submergence. Submergence corrections are based on a trapezoidal weir shape or optionally an ogee spillway shape. The total weir flow is computed by subdividing the weir crest into segments, computing L, H, a submergence correction, and a Q for each section, then summing the incremental discharges. The submergence correction for a trapezoidal weir shape is from the “Hydraulics of Bridge Waterways” document (FHWA, 1978). The below figure shows the relationship between the percentage of submergence and the flow reduction factor.
When the weir becomes highly submerged, the program will automatically switch to calculating the upstream water surface by the energy equation (standard step backwater) instead of using the pressure and weir flow equations. The criteria for when the program switches to energy based calculations are user controllable. A default maximum submergence is set to 0.98 (98 percent submerged).
Sometimes combinations of low flow or pressure flow occur with weir flow at a roadway crossing. In these cases, an iterative procedure is used to determine the amount of each type of flow. The program continues to iterate until both the low flow (and pressure flow) method and the weir flow method have the same energy (within a specified tolerance) upstream of the bridge structure (cross section 3). The combination of low flow and weir flow can only be computed with the energy and Yarnell low flow methods.


CivilGEO G2 Reviews
4.8/5.0 Rating, Over 230 Reviews

GeoHECRAS is recognized as the top Civil Engineering Design Software with an average of 4.8 out of 5.0 rating from over 230 real user reviews on G2.


We use cookies to give you the best online experience. By agreeing you accept the use of cookies in accordance with our cookie policy.
When you visit any web site, it may store or retrieve information on your browser, mostly in the form of cookies. Control your personal Cookie Services here.


