
Welcome to CivilGEO Knowledge Base
Welcome to CivilGEO Knowledge Base
DSS stands for HEC Data Storage System, which is primarily designed to store data for water resources applications. The HEC-DSS system can store almost any type of data, but it is most efficient at storing large blocks of data (e.g., time-series data for regular and irregular intervals).
In CivilGEO, the DSS Data File & Path dialog box is used to select the DSS file and the time series data records contained within the DSS file. GeoHECRAS can read data from a DSS file, whereas GeoHECHMS is capable of writing data in a DSS file format. Thus, a DSS file can be used to transfer data between both software, allowing the user to export flow data from a HEC-HMS model and use it in HEC-RAS modeling. Because a DSS file can be used to share information between GeoHECHMS and GeoHECRAS software, it is often necessary to be able to view data contained within a DSS file. Refer to this article in our knowledge base to learn how to export the flow data from a HEC-HMS model and use it for HEC-RAS modeling.
The following sections describe how to view data contained in an HEC-DSS file.
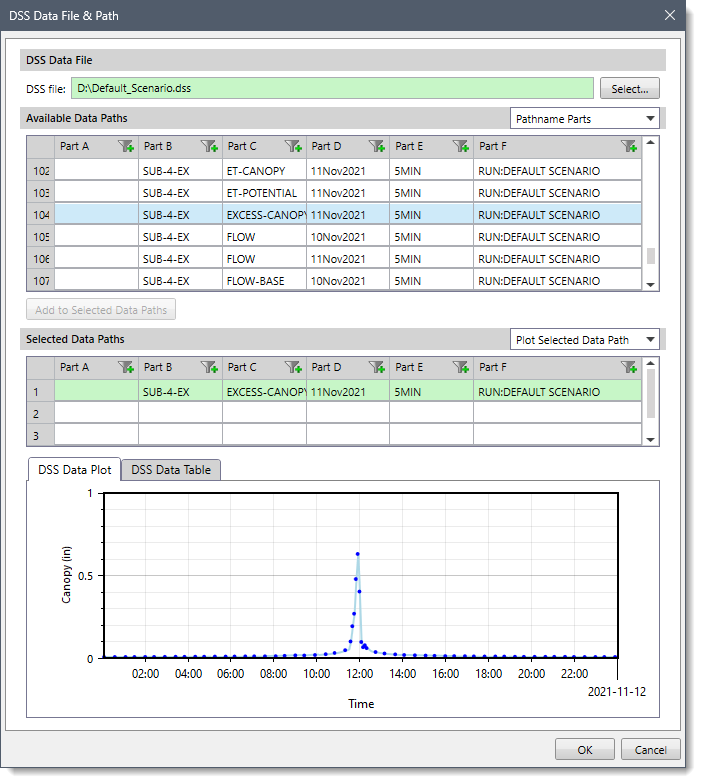
This section allows the user to select the DSS file. Click the [Select] button to specify the directory and the file name for the DSS data file to be selected. On selecting a DSS data file, a list of the available pathnames within that file will be shown in the table next to this section.
This section contains a table that lists all the DSS pathnames by their different parts. Note that the table can display the pathnames only when the DSS data file is selected in the DSS Data File section.
A pathname may consist of up to 391 characters and is, by convention, separated into six parts, which may be up to sixty-four characters each.
| Part | Description |
|---|---|
| A | Project, river, or basin name |
| B | Location |
| C | Data parameters (e.g., FLOW, PRECIP) |
| D | Starting date of block, in a 9-character military format (dd/mm/yyyy) |
| E | Time interval |
| F | Additional user-defined descriptive information |
The dropdown combo box adjacent to the Available Data Paths section allows the user to select one of the following options to list the DSS pathnames in the table: Pathname Parts and Condensed Catalog.
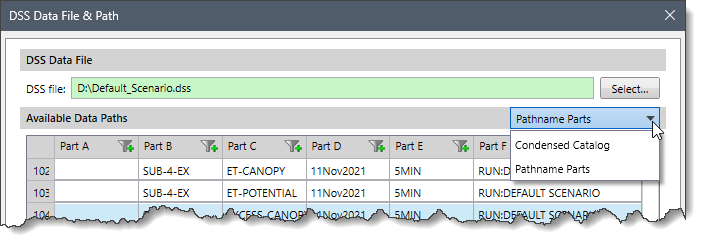
Select the Pathname Parts option to see a list of pathnames where the dates of time series data show a date part for each record in the Part D column of the table. By default, this option is shown selected when the dialog box is displayed.
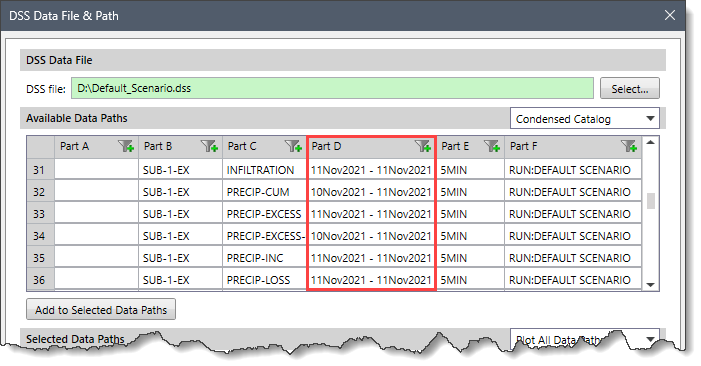
Select the Condensed Catalog option to see a list of pathnames where the dates of time series data are grouped together and show a date span instead of a date part for each record. On selecting this option, the software abridges time series data sets so that the date span for the entire data set will be displayed in the Part D column of the table.
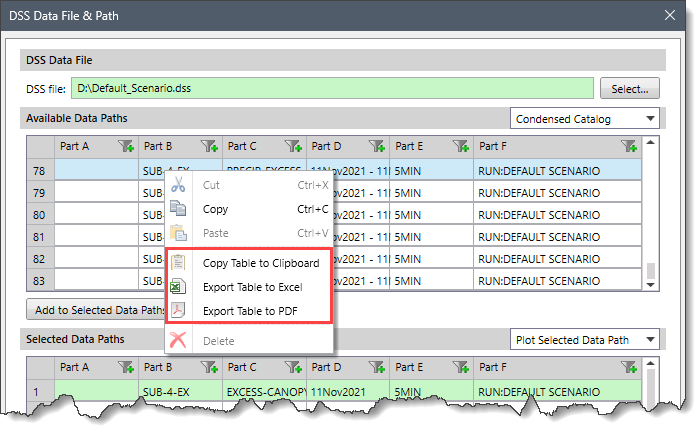
In addition, the data in the Available Data Paths table can be copied to the clipboard or exported as a Microsoft Excel or PDF document by using the Copy Table to Clipboard, Export Table to Excel, or Export Table to PDF commands from the right-click context menu.
The user can select one or more DSS pathnames from the table to be plotted and/or tabulated.
To select a pathname, double-click on a pathname in the Available Data Paths table, and the selected pathname will appear in the Selected Data Paths section. Alternatively, click on a desired pathname in the table, and then click the [Add to Selected Data Paths] button.
![[Add to Selected Data Paths] button](/wp-content/uploads/sites/25/2023/12/DSS-Data-File-and-Path-Imag-5.png)
To select multiple pathnames in the table, click on a pathname and the pathname will be highlighted. The user can use the Control Key plus left mouse click to select additional pathnames. Additionally, the Shift key can also be used to select a range of pathnames. The user can also click and drag across the pathnames, release the mouse button and the block of pathnames will be highlighted.
Once a pathname(s) is selected, click the [Add to Selected Data Paths] button. The selected data path (s) will be added in the Selected Data Paths section. The dialog box also displays the graphical plot for the selected data path in the DSS Data Plot panel.
This section contains a table that lists all of the selected pathnames from the Available Data Paths section. The user can select the desired pathname (s) and the corresponding graphical plot will be displayed in the DSS Data Plot panel.
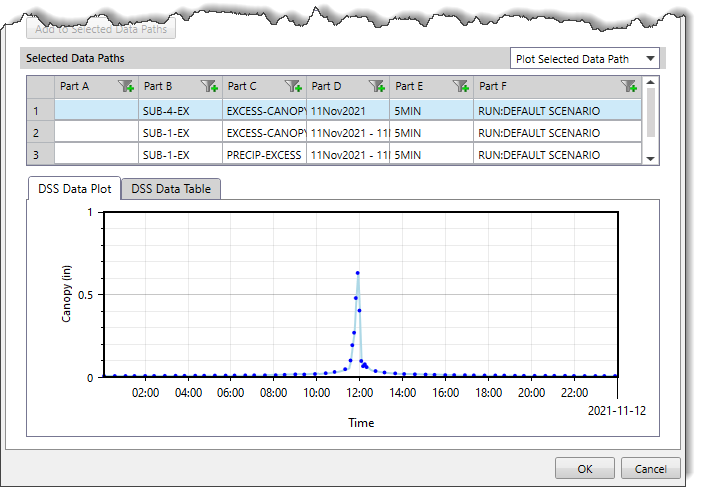
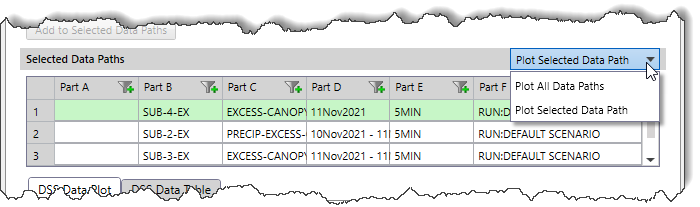
The dropdown combo box adjacent to the Selected Data Paths section allows the user to select one of the following options to be plotted in the graphical plot: Plot Selected Data Path and Plot All Data Paths.
Select the Plot Selected Data Path option to see the graphical plot for the individual pathname. By default, this option is shown selected when the dialog box is displayed.
Select the Plot All Data Paths option to see the graphical plot for all pathnames.
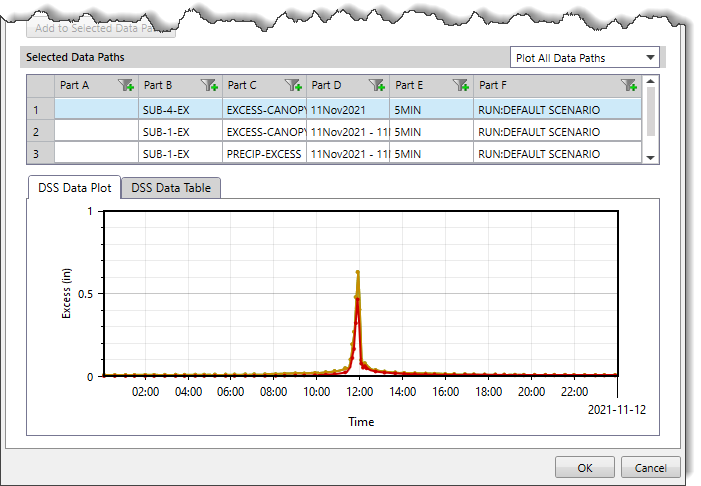
This panel displays the graphical plot of the selected pathname(s). The parameters for the plots are labeled and color-coded, date ranges are specified along one axis, and the units of measure are specified along the other axis. Areas of the graphical plot can also be zoomed in and out.
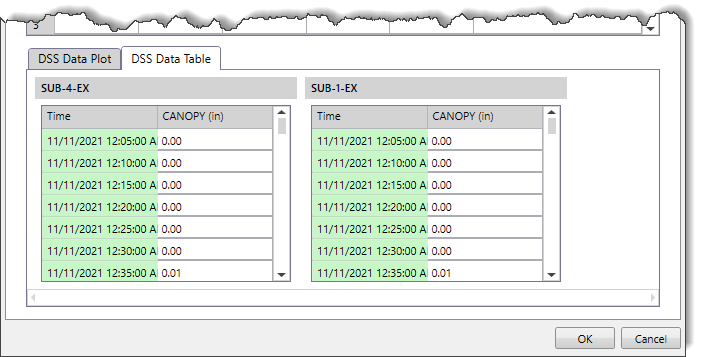
This panel contains a data grid that displays the DSS data table for the selected pathname(s). Note that the displayed table will have the same columns as the axes displayed in the corresponding DSS Data Plot.


CivilGEO G2 Reviews
4.8/5.0 Rating, Over 230 Reviews

GeoHECRAS is recognized as the top Civil Engineering Design Software with an average of 4.8 out of 5.0 rating from over 230 real user reviews on G2.


We use cookies to give you the best online experience. By agreeing you accept the use of cookies in accordance with our cookie policy.
When you visit any web site, it may store or retrieve information on your browser, mostly in the form of cookies. Control your personal Cookie Services here.


