
Welcome to CivilGEO Knowledge Base
Welcome to CivilGEO Knowledge Base
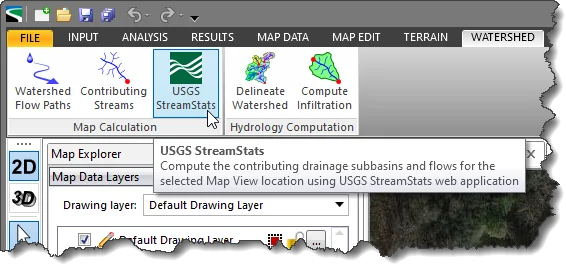
The USGS StreamStats command allows the user to click on a stream location in the Map View, prompting the software to delineate the watershed basin boundary, compute the basin characteristics, and provide estimates for flow based upon site-specific USGS regression equations. The software will generate GIS shapefiles containing the determined watershed boundary and basin characteristics, stream flow path, as well as a PDF results report for the selected site.
Follow the steps below to use the USGS StreamStats command:
The following sections describe the USGS StreamStats command and how to interact with the above dialog box.
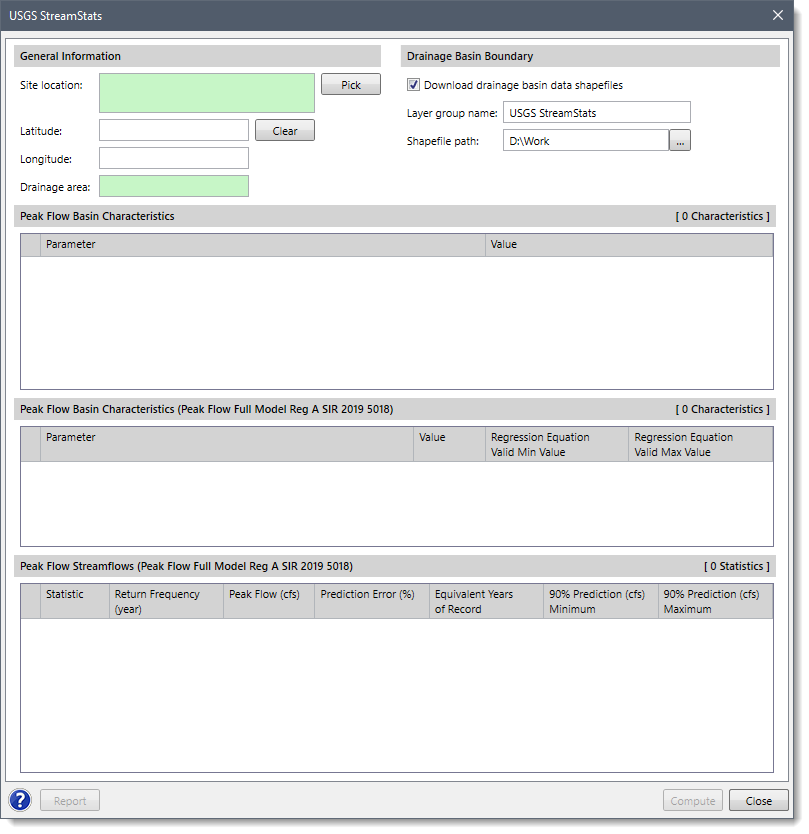
This section is used to define general information on the watershed being computed.
Click the [Pick] button to select a watershed outlet point (or spill point) from the Map View. This selected point should be on a known stream, river, or other waterway. The software will use this point to compute the contributing watershed drainage basin and the discharge at the selected point.
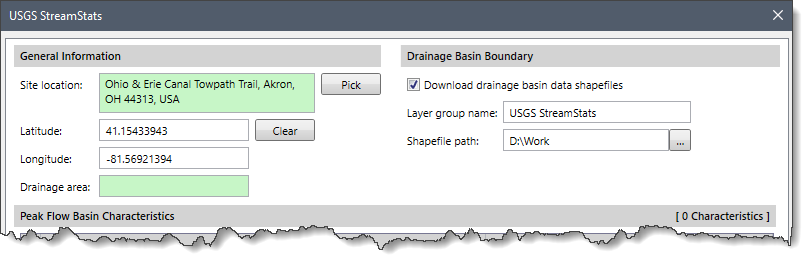
When selecting this watershed outlet point, the dialog box will temporarily disappear, and the user will be prompted to select the outlet point. After selecting the point, the user will be returned to the dialog box and the software will also display the chosen point’s latitude-longitude as well as the corresponding address for the selected point. The user can click the [Clear] button to clear the defined location and redo the entire process.
This section is used to define where the computed results are to be saved and whether the watershed boundary should be added to the Map View.
Provide the name for the layer group in the Layer group name input field. By default, the layer name is set to USGS StreamStats, which can be changed by the user.
Click the […] button beside the Shapefile path entry to specify the directory location to save the computed USGS StreamStats results.
Click the [Compute] button and the software will call the USGS StreamStats webserver with the selected watershed outlet point. The USGS StreamStats webserver will then place your request into a queue (if there are any other user requests in front of it).
![[Compute] button](/wp-content/uploads/sites/25/2017/09/USGS-StreamStats-command-Image-5.png)
Once your request begins processing, StreamStats first determines the drainage basin associated with the selected point. It performs a watershed delineation using the National Elevation Data (NED). It then determines the longest flow path within the computed watershed, along with the stream slope, watershed average slope and other hydrologic parameters. From the computed watershed centroid, it determines which state the watershed is in and which regional runoff regression equation should be used to estimate the flow-duration statistics for the selected point.
The USGS is continually improving this computation, adding regions that were not previously covered as well as updating the runoff regression equations for computing peak flows based upon additional stream gages and revised flow statistics. These changes and improvements are automatically incorporated into the USGS StreamStats webserver.
Once this information has been determined, StreamStats packages together a ZIP file containing the results and sends that ZIP file back to our software. Our software then unpacks the ZIP file and post-processes the provided results and displays them in the dialog box, Map Data Layers panel, and on the Map View.
The following dialog box sections display the computed results:
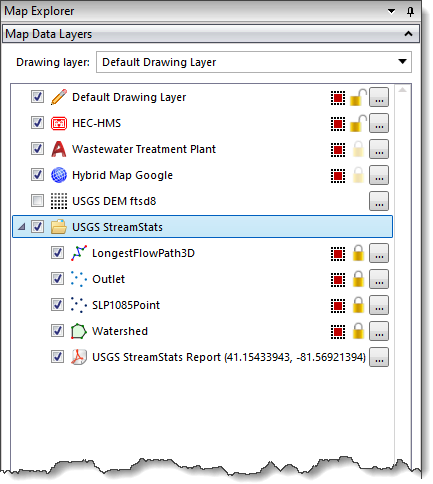
Click the [Report] button to display the USGS StreamStats PDF report showing the streamflow statistics and peak flows. This PDF report is also appended to the Map Data Layers panel data listing for easy retrieval.
![[Report] button](/wp-content/uploads/sites/25/2017/09/USGS-StreamStats-command-Image-6.png)
The Map Data Layers panel also lists the downloaded shapefile layers that were generated by USGS StreamStats. These layers are GIS attributed and contain the computed results. Expand the group to see the details of the loaded layers.
Question: The USGS StreamStats platform is not implemented in some states. A review of the StreamStats status for different states in the US shows that some states fall under the category of “Not Participating”. Do you have any plans for fully implementing the USGS StreamStats across all the states and what is the significance of the term “Not participating”?
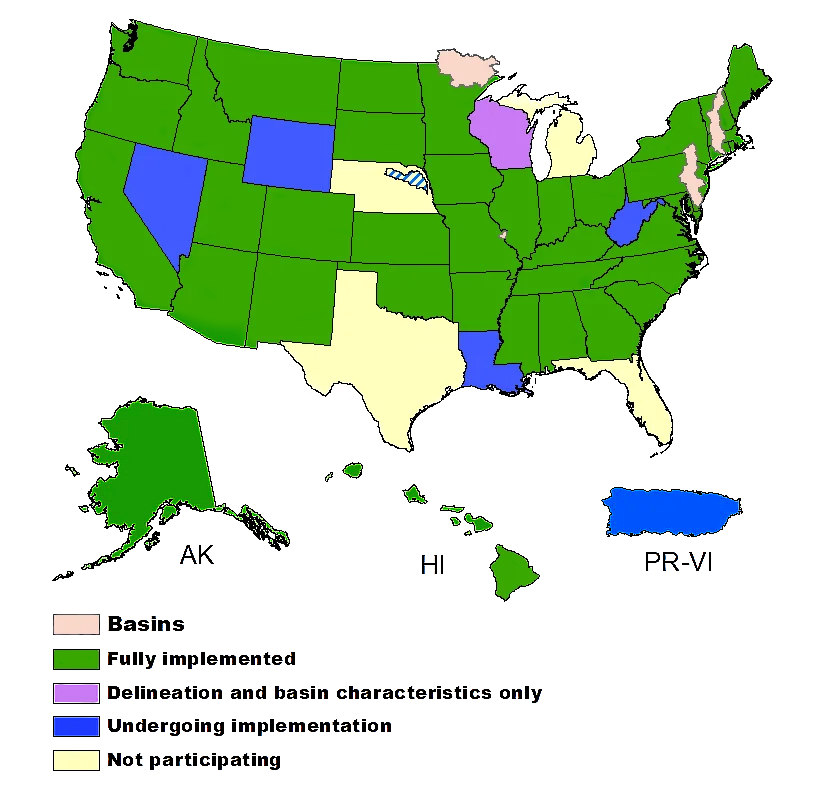
Answer: There is a substantial effort required to develop the GIS data layers needed for a StreamStats application. Although StreamStats is presented as a nationwide interface, the background data layers required for each individual state’s StreamStats implementation are developed by the USGS Water Science Center in that State, through cooperative funding agreements with one or more Local, State, Tribal, or Federal entities. A few Water Science Centers have not been able to identify cooperators willing to help fund the effort, so StreamStats is not yet available in those states. It is possible that Federal funding may someday be allocated for developing StreamStats in the remaining states, but at this time that has not yet occurred.
Question: Purple states show basin delineations and compute basin characteristics but estimates of flow statistics from regression equations are not available. Why is that?
Answer: Wisconsin has developed a StreamStats application but is still in the process of completing Quality Assurance/Quality Control checks before the state’s peakflow regression equations can be made available to the public.
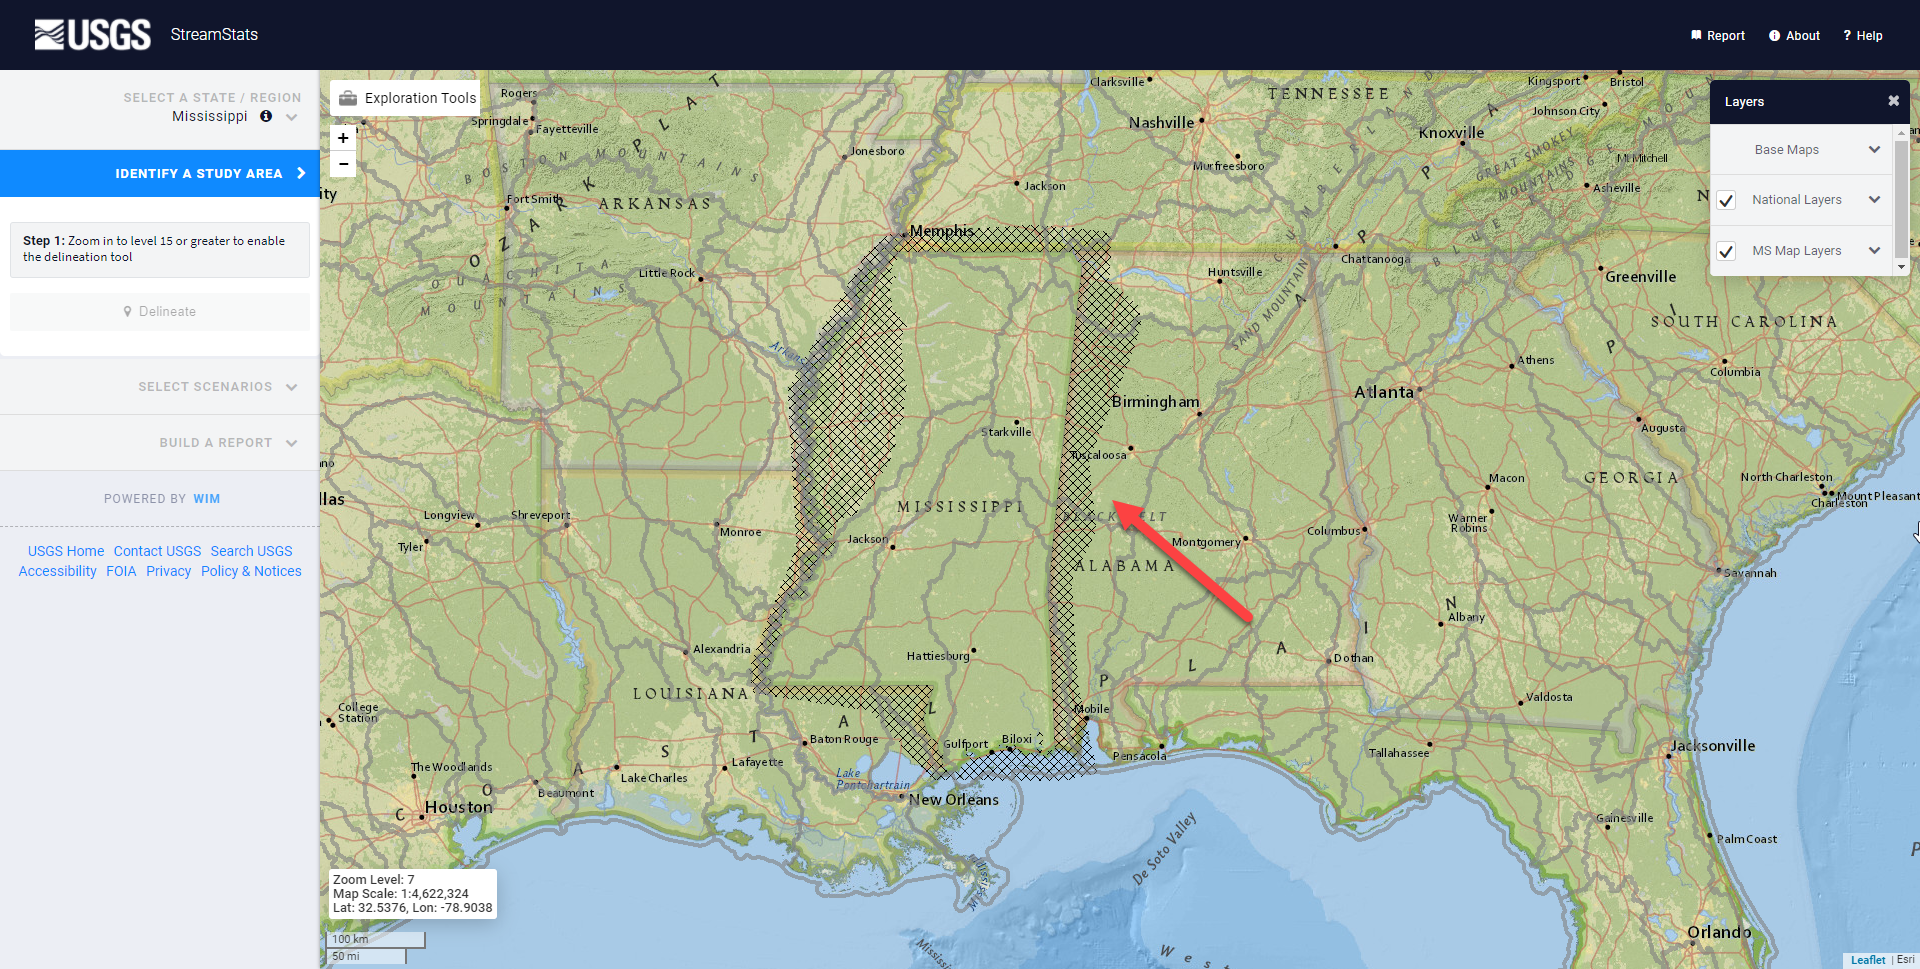
Question: Why is there a hatched region around the state of Mississippi?
Another example is around the state of Missouri.
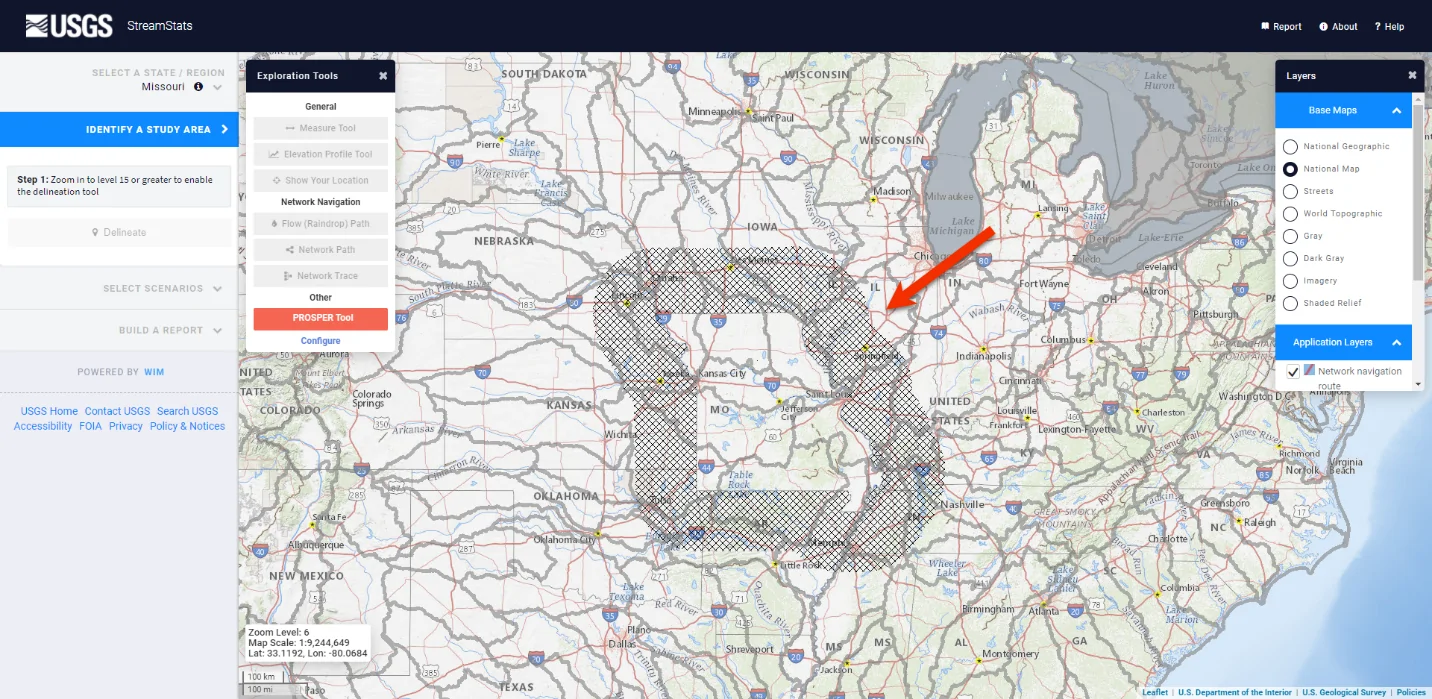
Answer: Please visit this page for more details. Most regression equations are developed for a particular state. While some data is typically included from nearby stream gages in adjacent states, equations are often only considered valid for use in the specific state they were derived for. StreamStats is set up to reflect the area of applicability as stated by the author of the regression report.
Question: What are the steps that can be followed if the following message is received even after repeated attempts?
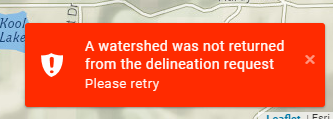 Answer: If you don’t get a successful delineation after a few tries, your browser may need a hard refresh or your computer’s cache may need to be emptied. Each day, StreamStats gets thousands of delineation requests from dozens of users. Internet traffic, browser versions and settings, and other factors outside our control can sometimes lead to “hiccups” that cause problems. Occasionally, there may be transient problems that crop up following network outages or updates. Although StreamStats is not staffed 24/7, please do let us know by submitting a help ticket if you see repeated problems.
Question: How is the Prediction Error computed and what is its significance?
Answer: A detailed discussion of this is available here, but ultimately you may need to consult the regression report specific to the particular flow statistic you are interested in. There are a number of different statistical quality indicators that can be used to measure and describe how well a particular regression equation represents its source dataset. Different authors sometimes choose different indicator statistics, and StreamStats typically will present whichever one was chosen by the author of the regression report.
Question: What is the function of the PROSPER tool under the Exploration tools section?
Answer: The PROSPER tool is relatively new and isn’t yet covered in our FAQs or User Manual. A description for the color symbolization is being developed and will be added to the output. It essentially creates a visualization that shows how likely a particular stream reach is to have perennial flow, based on this article.


CivilGEO G2 Reviews
4.8/5.0 Rating, Over 230 Reviews

GeoHECRAS is recognized as the top Civil Engineering Design Software with an average of 4.8 out of 5.0 rating from over 230 real user reviews on G2.


We use cookies to give you the best online experience. By agreeing you accept the use of cookies in accordance with our cookie policy.
When you visit any web site, it may store or retrieve information on your browser, mostly in the form of cookies. Control your personal Cookie Services here.


