
Welcome to CivilGEO Knowledge Base
Welcome to CivilGEO Knowledge Base
An impervious surface is a hard surface that prevents or stops water from entering the soil mantle or causes water to run off the surface in higher amounts or at a faster rate. Common impervious surfaces include rooftops, walkways, patios, driveways, parking lots, storage areas, concrete or asphalt paving, and gravel roads.
Impervious surface area increases the amount and speed of water entering rivers and other water bodies and limits the amount of water that can soak into the soil, thus increasing the possibility of severe flooding. It serves as one of the critical factors influencing the rainfall-runoff relationship in urban areas. In general, the extent and density of impervious surfaces in urban areas tends to have a greater impact on water quality, streamflow, and overall flood risk than in less developed spaces.
Note that a CRS should be assigned prior to running this command. Otherwise, the software will display the below informational dialog box.
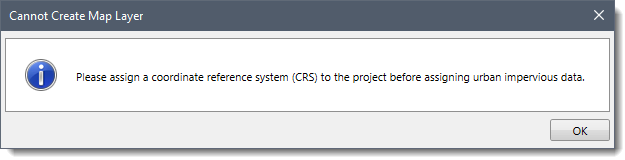
To learn more about the coordinate reference system (CRS), refer to this article in our knowledge base.
The Urban Impervious command of CivilGEO’s software allows the user to display global or regional (United States and Europe only) urban impervious surfaces on the Map View.
To display the urban impervious surface percentage on the Map View, select the Urban Impervious dropdown menu item from the Map Data ribbon menu.
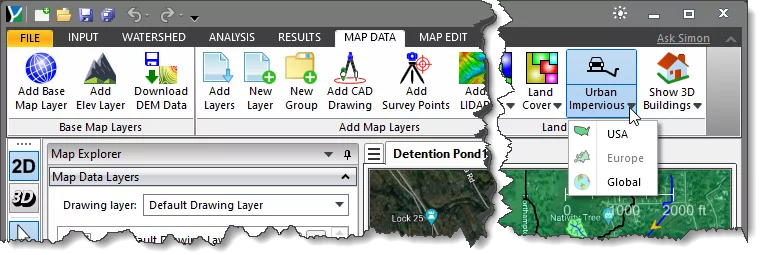
Note: Based on the current CRS of the project, the corresponding region will be enabled.
The following countries are listed under the Urban Impervious menu tab:
Clicking on any of the desired countries listed above will cause the software to display the Urban Impervious dialog box.
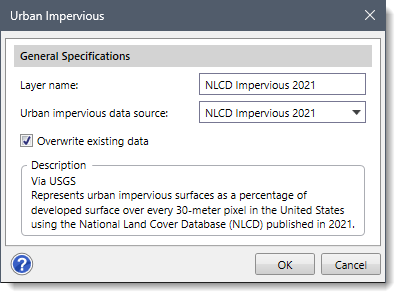
The Layer name entry field allows the user to define the name of a new impervious layer to be created and displayed in the Map Data Layers panel. The software sets “USA Urban Impervious” as the default name for the impervious layer, which can be changed by the user.
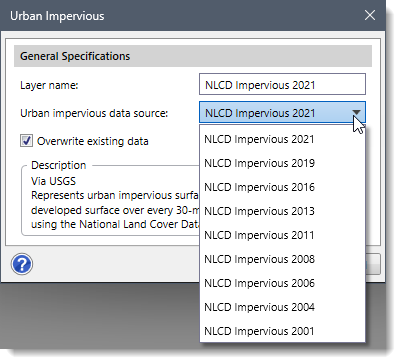
The Urban impervious data source dropdown combo box allows the user to select which impervious data source to utilize for the newly created layer. By default, the software selects the latest available impervious data. The following options are available in the dropdown combo box:
If the “Overwrite existing data” checkbox option is checked, then the new urban impervious data selected in the Urban impervious data source dropdown combo box will overwrite the existing urban impervious data (if one exists).
Note that for countries other than the USA, the Urban impervious data source dropdown combo box and the Overwrite existing data checkbox options are not available.
The user can click on the [OK] button to display the impervious surfaces of the selected region on the Map View.
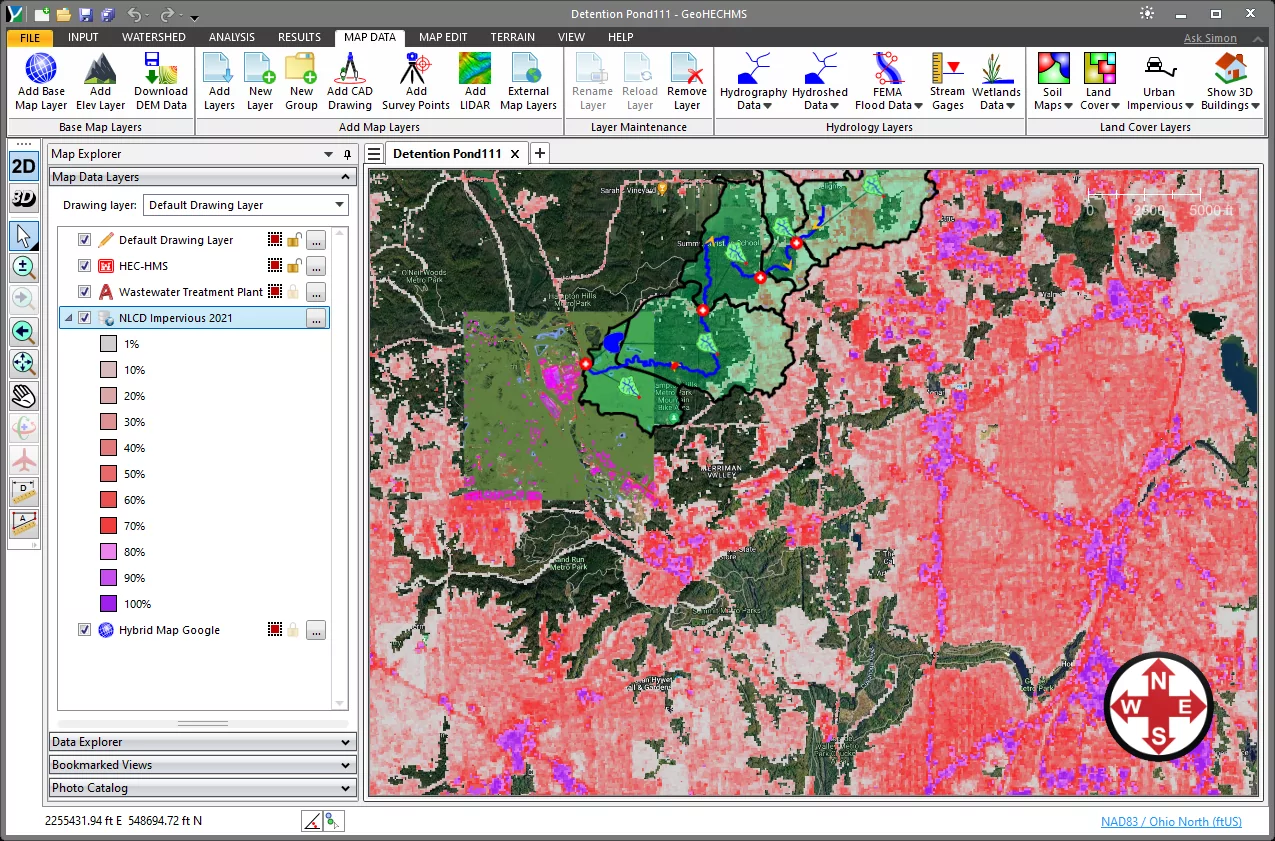
In the Map Data Layers panel, the software will provide a data legend for each impervious surface layer that lists the impervious surface percentage data included within that layer. The user can expand the layer to view the data legend.


CivilGEO G2 Reviews
4.8/5.0 Rating, Over 230 Reviews

GeoHECRAS is recognized as the top Civil Engineering Design Software with an average of 4.8 out of 5.0 rating from over 230 real user reviews on G2.


We use cookies to give you the best online experience. By agreeing you accept the use of cookies in accordance with our cookie policy.
When you visit any web site, it may store or retrieve information on your browser, mostly in the form of cookies. Control your personal Cookie Services here.


