
Welcome to CivilGEO Knowledge Base
Welcome to CivilGEO Knowledge Base
A flood map represents the area of inundation that shows the spatial extent and depth of flooding at specific water-level (stream stage) intervals along an individual stream section. Flood maps are created using the hydraulic data and topographic information of the area. The flood inundation maps are useful for various purposes such as municipal planning, emergency action plans, flood insurance rates, and ecological studies.
In GeoHECRAS, the user can create flood maps from the HEC-RAS computations and user-added digital terrain layers. While GeoHECRAS constructs a flood map representing the area of inundation, it can simultaneously generate an elevation raster grid (or elevation grid) file representing the water surface elevation, flood depth, flood velocity, shear stress, etc. for the mapped area. This raster grid file allows the flood map to be utilized in other software programs, such as ESRI ArcMap and ArcGIS.
Note that the units of the project’s CRS and terrain’s horizontal and vertical units must be the same to generate an accurate flood map. The XY coordinate units represent the horizontal units of the terrain. Whereas, the elevation represents the vertical units (i.e., Z coordinate unit) of the terrain.
Flood maps can be generated for both steady and unsteady flow models. Under steady flow, the user inputs as boundary conditions a discharge upstream and a stage downstream. The model proceeds to calculate stages throughout the interior points, keeping the discharge constant in space. Under unsteady flow, the user inputs a discharge hydrograph at the upstream boundary and a discharge-stage rating at the downstream boundary. The model calculates discharges and stages throughout the interior points.
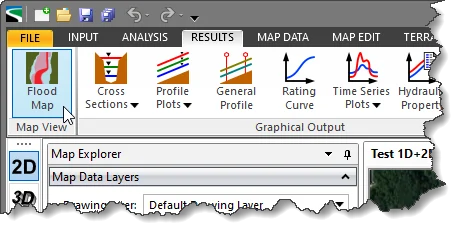
To generate a flood map for a steady or unsteady flow model, select the Flood Map command from the Results ribbon menu. Note that this command can only be used after a successful HEC-RAS analysis run.
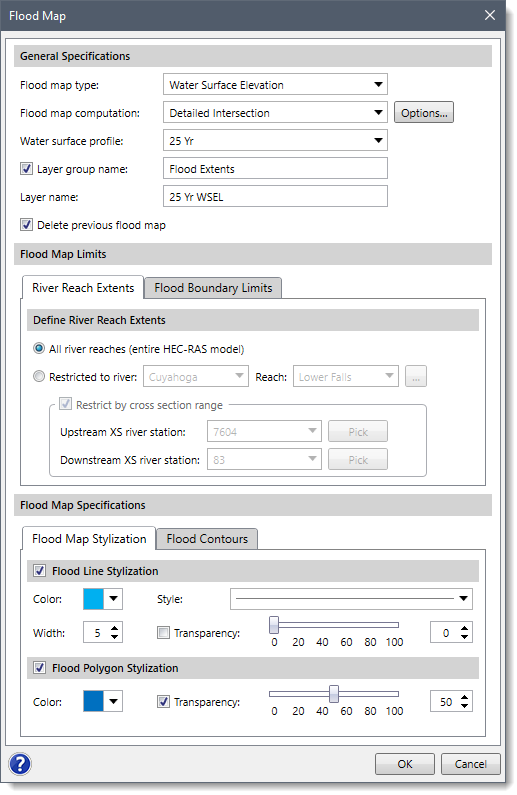
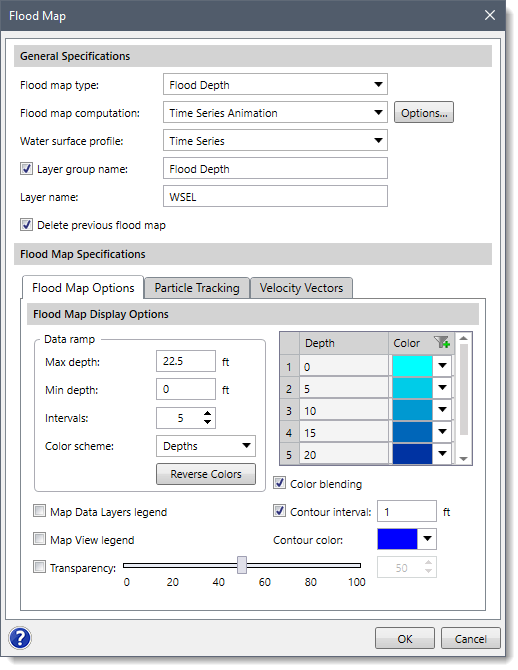
The Flood Map dialog box will be displayed.
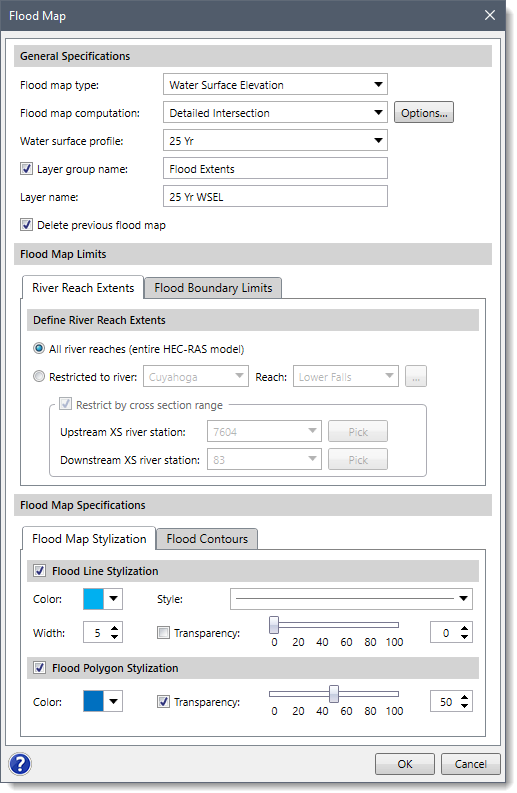
The General Specification section of the above dialog box allows the user to specify several options as described below:
Based on the selection of Flood map computation and Flood map type, the remaining sections of the Flood Map dialog box are modified.
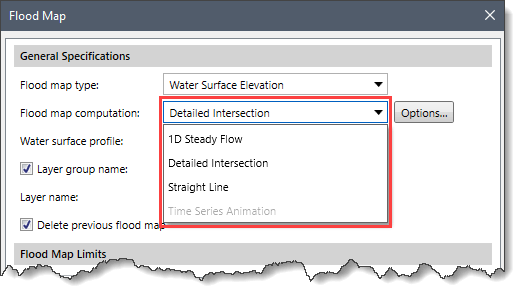
The Flood map computation dropdown combo box allows the user to select the flood map computation type. Based on the flow data (steady or unsteady), the software automatically filters out and lists only those computation types that are relevant to the project model.
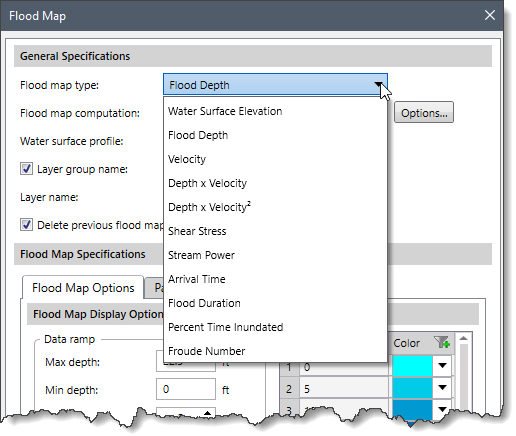
In GeoHECRAS, several different types of flood maps can be generated for steady and unsteady flow analysis. The Flood map type dropdown combo box allows the user to select the type of flood map that is to be generated. The software automatically filters out and lists only those flood map types that are relevant to the selected flood map computation and project model (steady or unsteady).
The below table summarizes all the flood map types that the software can generate for various flood map computation types.
| Flood Map Computation | Model Supported | Flood Map Types |
|---|---|---|
| 1D Steady Flow | 1D Steady |
|
| Detailed Intersection | 1D Steady and Unsteady |
|
| Straight Line | 1D Steady and Unsteady | |
| Time Series Animation | 1D and 2D Unsteady |
|
The 1D Steady Flow computation displays the maximum extent of flooding. It allows the user to create various types of flood maps with particle tracking capabilities to determine the flow’s inconsistency.
Selecting the 1D Steady Flow computation option will display the following Flood Map dialog box.
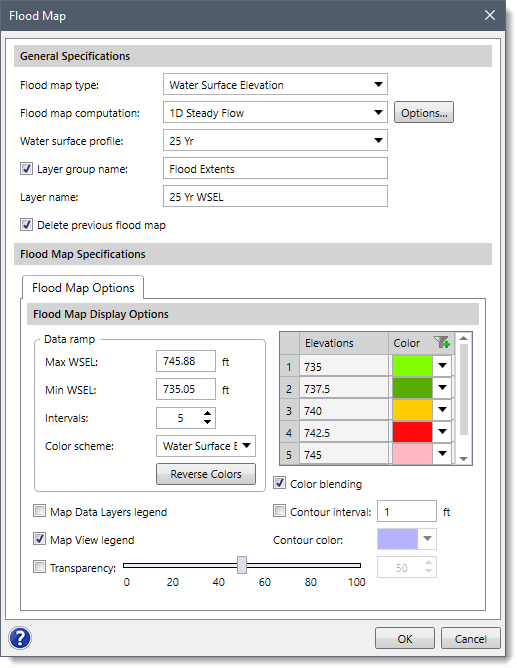
Note that the content of the Flood Map Options panel changes based on the selection of flood map type.
The below sections describe how to generate a flood map using the 1D Steady Flow computation and how to interact with the above dialog box.
To specify computation options for 1D Steady Flow computation, follow the steps below:
![[Options] button](/wp-content/uploads/sites/25/2021/09/Flood-Map-Command-Img-6.png)
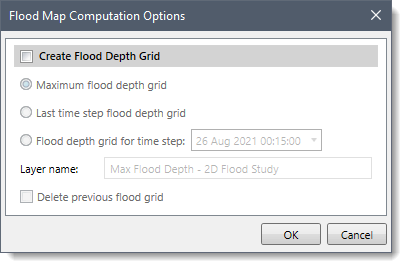
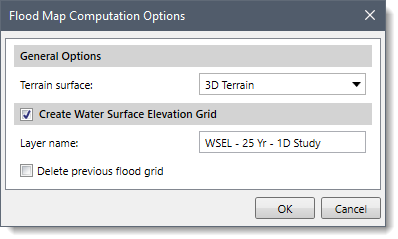 Note that the content of the Flood Map Computation Options dialog box changes based on the selection of flood map type.
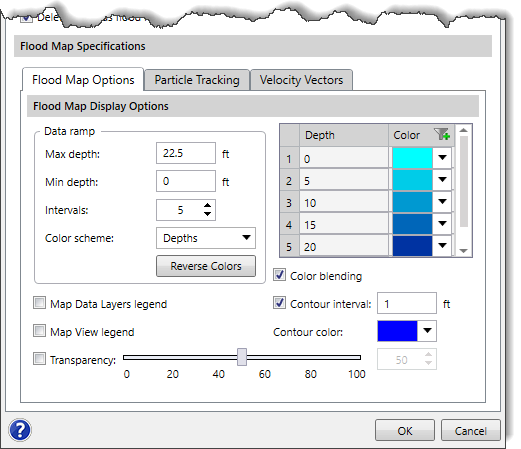
The Flood Map Specifications section of the 1D Steady Flow computation type allows the user to define the display properties of the flood map that is to be generated.
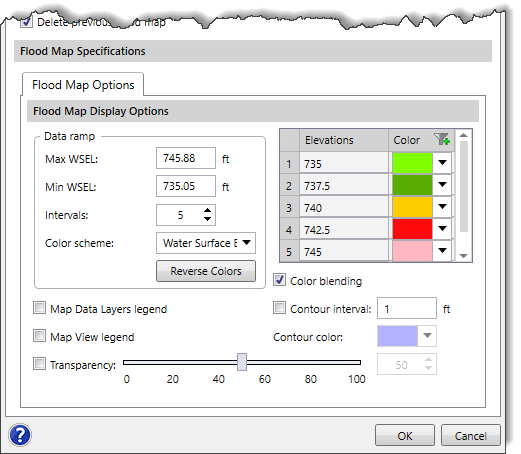
The Data ramp section identifies the maximum and minimum flood inundation values corresponding to the selected flood map type. For example, in the case of the water surface elevation flood map type, the Data ramp section identifies the maximum and minimum water surface elevation (Max WSEL and Min WSEL). In this section, the user can define the color scheme as well as the interval for the color ramp that will be used to depict the range of flood magnitude. The Intervals spin control button allows the user to specify the number of colors that will be used to represent the different flood depths. The default value is 5. However, the user can increase or decrease this number to get a better representation of the data. The Color scheme dropdown combo box allows the user to select the color scheme for the color ramp.
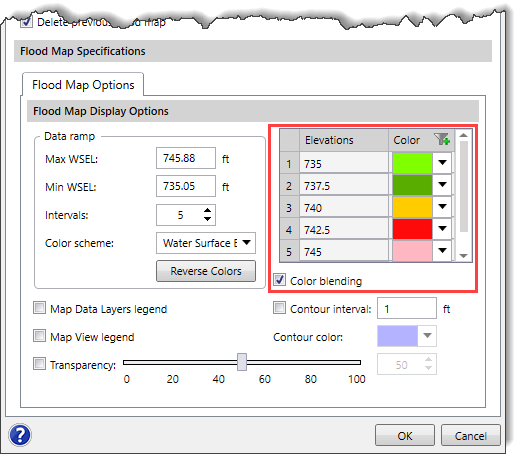
The user can change the default color values for the selected color ramp scheme in the table shown next to the Data ramp section. Checking the Color blending checkbox causes the software to perform color blending when there isn’t enough tonal range to represent all the different colors between the brightest and the darkest points of a gradient.
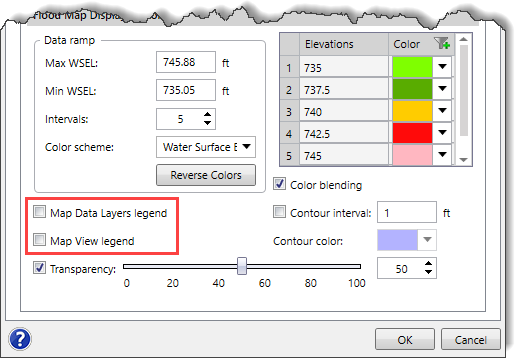
Checking the Map View legend and Map Data Layers legend checkboxes causes the software to create a color legend for the flood map in the Map View and Map Data Layers panel, respectively.
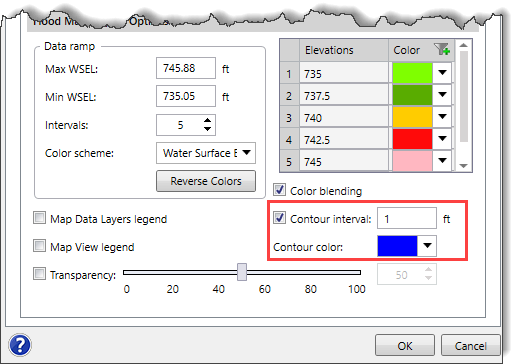
Checking the Contour interval checkbox causes the software to generate contour lines for the flood map. The contour lines for the change in magnitude of flooding are generated based on the defined interval. By default, the software uses a value of 1 unit for the interval. The user can change this value to whatever is desired in the Contour interval input field. Additionally, the user can define the color for contour lines using the Contour color dropdown color palette. Note that this option becomes available after checking the Contour interval checkbox.
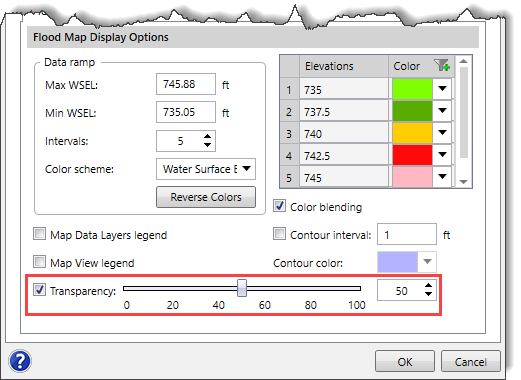
Checking the Transparency checkbox allows the user to adjust the transparency of the flood map that is to be generated. The software uses a default value of 50. The user can change the transparency value to whatever is desired using the bar scale or spin control button.
Once all the options in the Flood Map dialog box are configured, the user can click the [OK] button. The software will generate a flood map for the selected flood map type in the Map View as well as add the corresponding flood map layer to the Map Data Layers panel.
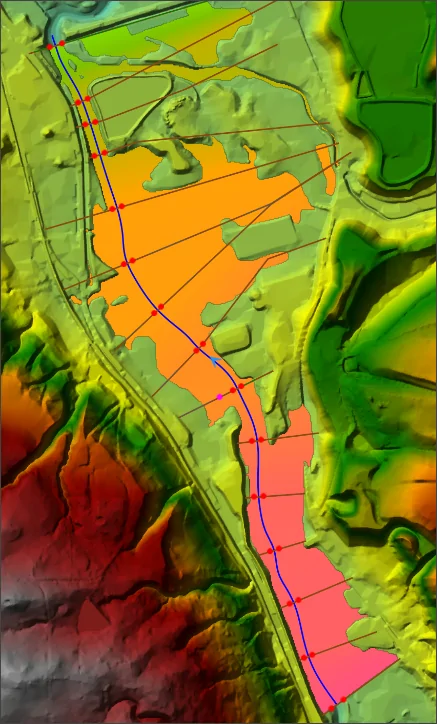
The below image shows a water surface elevation flood map generated using 1D Steady Flow computation.
The Straight Line computation identifies all the reported river stations across each cross section and connects these river stations to generate a flood map in the form of a straight line polygon.
Selecting the Straight Line computation option will display the following Flood Map dialog box.
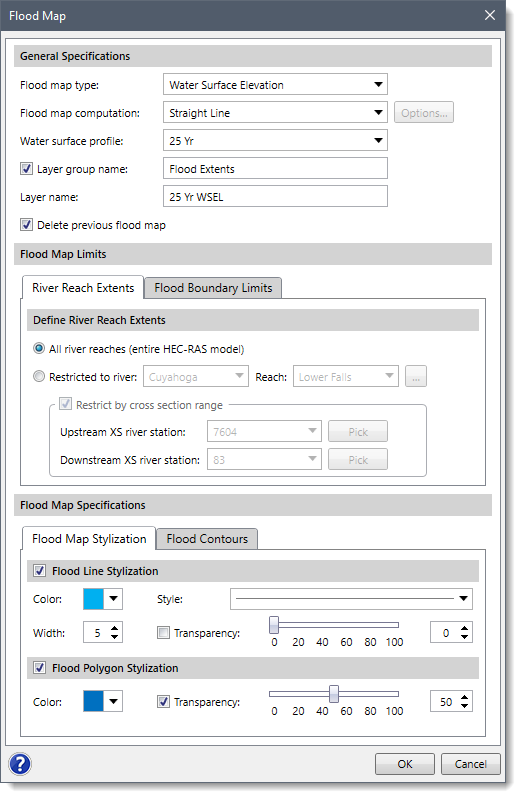
Note that the software does not provide any computation options for Straight Line computation. Hence the [Options] button next to the Flood map computation field is grayed out (disabled).
The below sections describe how to generate a flood map using Straight Line computation and interact with the above dialog box.
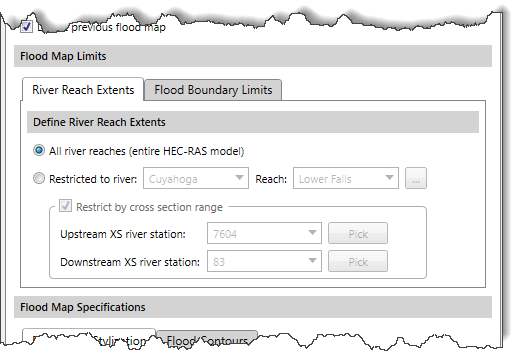
The Flood Map Limits section allows the user to define river reach extent and boundary limits for the flood map.
The River Reach Extents panel is used to define the river reach extent. The All river reaches (entire HEC-RAS model) option causes the software to generate flood maps along all the river reaches present in the entire HEC-RAS model.
To generate a flood map along a selected river reach, the user can select the Restricted to river and Reach options. Here the user can select the river and the corresponding reach along which the flood map is to be generated.
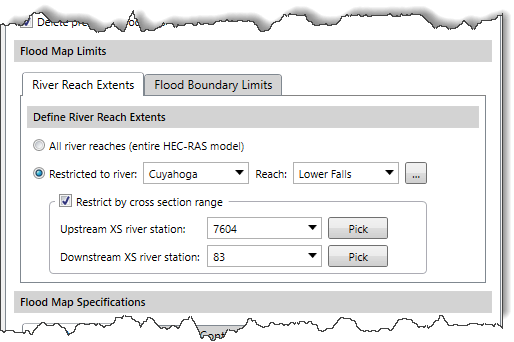
The user can select the river using the Restricted to river dropdown combo box and the corresponding reach using the Reach dropdown combo box. Alternatively, the user can click the […] button next to the Reach dropdown combo box to interactively select the reach from the Map View. The Upstream XS river station and Downstream XS river station dropdown combo boxes allow the user to define the upstream and downstream river station for the selected river reach. Alternatively, the user can click the corresponding [Pick] buttons to interactively select the upstream or downstream river station from the Map View. By default, the software uses the upstream and downstream river stations at the ends of the reach.
The Flood Boundary Limits panel allows the user to define the flood map boundary limits.
Selecting the Use default flood map boundary limits option causes the software to define the boundary limits based on flow data. By default, the software selects this option.
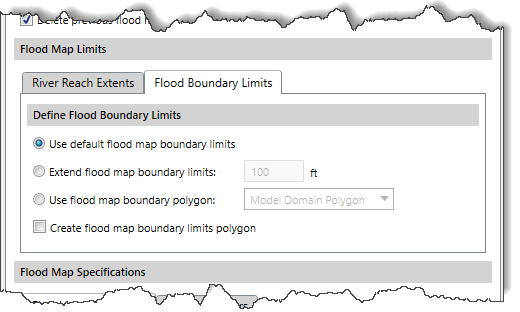
Selecting the Extend flood map boundary limits option allows the user to extend the boundary limits of the flood map to any desired range. By default, the software uses a value of 100 ft.
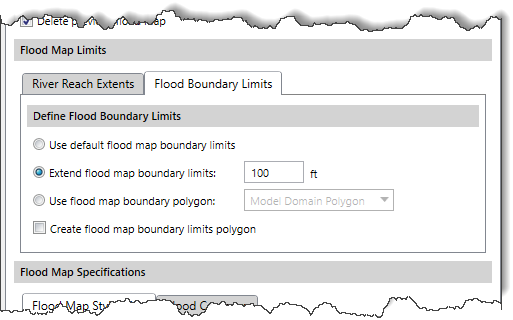
Checking the Create flood map boundary limits polygon checkbox causes the software to generate a polygon around the flood map representing the flood map boundary. Note that this checkbox is enabled only for the first two options.
Selecting the Use flood map boundary polygon option allows the user to define the boundary limits of the flood map using a polygon drawing.
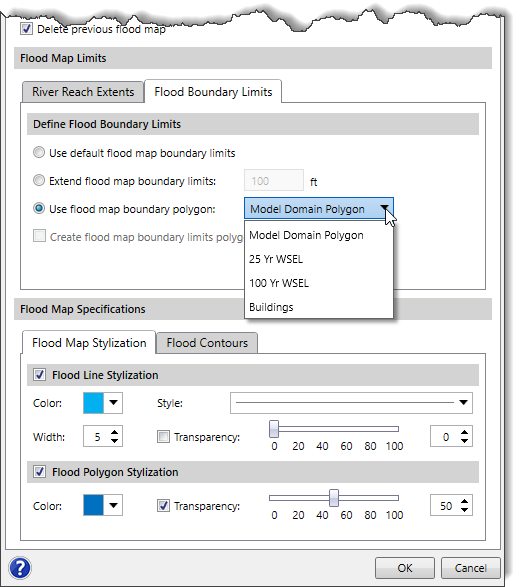
The Flood Map Specifications section of Straight Line computation allows the user to define the display properties of the flood map that is to be generated. The flood map for Straight Line computation is generated using a single color instead of a color ramp.
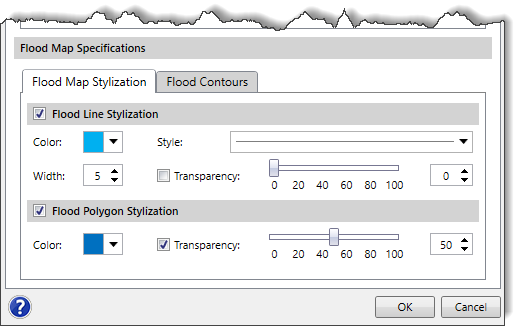
The Flood Map Stylization panel allows the user to specify the display properties of the polylines and polygon that will comprise the flood map. The Flood Line Stylization section allows the user to define the color, width, and transparency of the polylines that will depict the boundary of the flood map. The Flood Polygon Stylization section allows the user to define the fill color and transparency of the polygon that will depict the flood inundation area.
Note that the Flood Line Stylization and the Flood Polygon Stylization checkboxes are selected by default.
The Flood Contours panel allows the user to generate contour lines for the flood map. Selecting the Flood Contour checkbox enables the content of the Flood Contours section. The contour lines depicting the change in the terrain surface elevation are generated based on the defined interval. By default, the software uses a value of 1 ft for the interval. The user can change the interval value to whatever is desired in the Contour interval input field as well as select the color for the contour lines using the Color dropdown color palette.
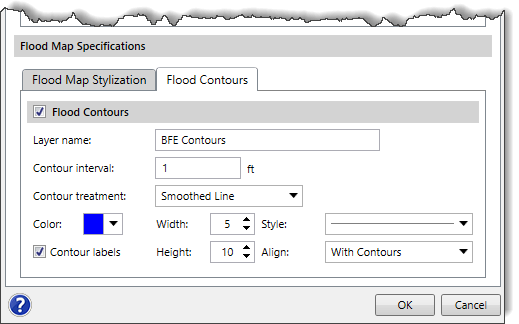
The user can also define the width and height of the contour lines using Width and Height spin control buttons, respectively. The Style dropdown combo box allows the user to select the style of contour lines. The Align dropdown combo box allows the user to either align the contour lines horizontally or with the contour. In addition, the user can elect to check the Contour labels checkbox to include the elevation value as a label on the contour line.
Once all the options in the Flood Map dialog box are configured, the user can click the [OK] button. The software will generate a flood map in the Map View for the selected flood map type.
The below image shows a water surface elevation flood map generated using Straight Line computation.
The main disadvantage of a flood map created using Straight Line computation is that it cannot follow the underlying terrain elevation geometry and hence cannot identify high elevation areas where floodwaters cannot reach. The Detailed Intersection computation identifies the difference between the flood surface and the ground terrain to create accurate flood maps that follow the terrain. Moreover, it can also detect higher elevations within the flood map area and clip it out accordingly.
Selecting the Detailed Intersection computation option will display the following Flood Map dialog box.
The below section describes how to generate a flood map using the Detailed Intersection computation and how to interact with the above dialog box.
To specify computation options for Detailed Intersection computation, follow these steps:
![[Options] button](/wp-content/uploads/sites/25/2021/09/Flood-Map-Command-Img-24.png)
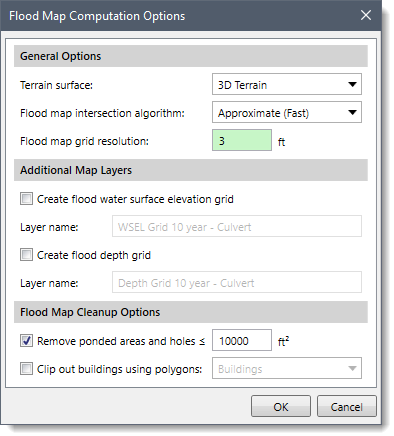
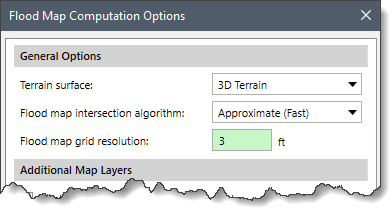 The Terrain surface dropdown combo box allows the user to select the underlying terrain surface. The Flood map intersection algorithm dropdown combo box allows the user to select the algorithm for generating the flood map. By default, the software selects the Approximate (Fast) method. This method uses the default grid resolution of 5ft to generate the flood map. On selecting the Precise (Slow) option, the Flood map grid resolution input field becomes editable. The user can define the grid resolution in the range of 5 to 20 ft.
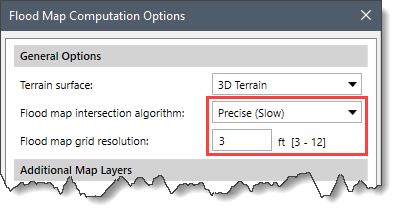
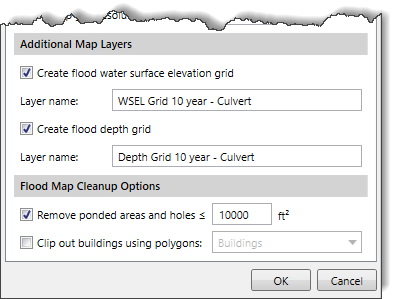 Checking the Create flood water surface elevation grid checkbox causes the software to generate a water surface elevation raster grid. The user can define the name of this layer under the corresponding Layer name input field.
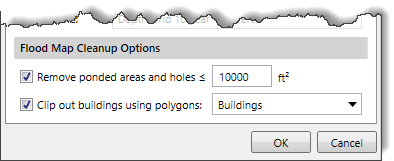 Checking the Remove ponded areas and holes ≤ checkbox allows the user to define a maximum area value. The software will remove any ponded areas or holes that have area coverage of less than the defined area value.
The Food Map Limits and Flood Map Specifications sections for Detailed Intersection computation type are similar to what was shown in Straight Line computation type.
Once all the options in the Flood Map dialog box are configured, the user can click the [OK] button. The software will generate a flood map for the selected flood map type in the Map View.
The below image shows a water surface elevation flood map generated using Detailed Intersection computation.
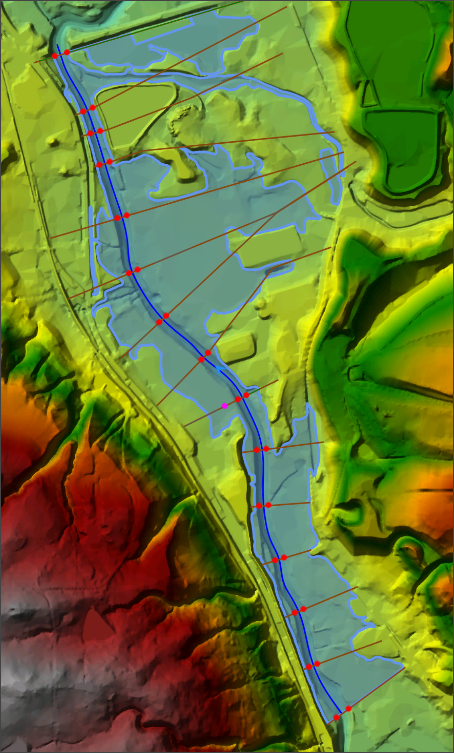
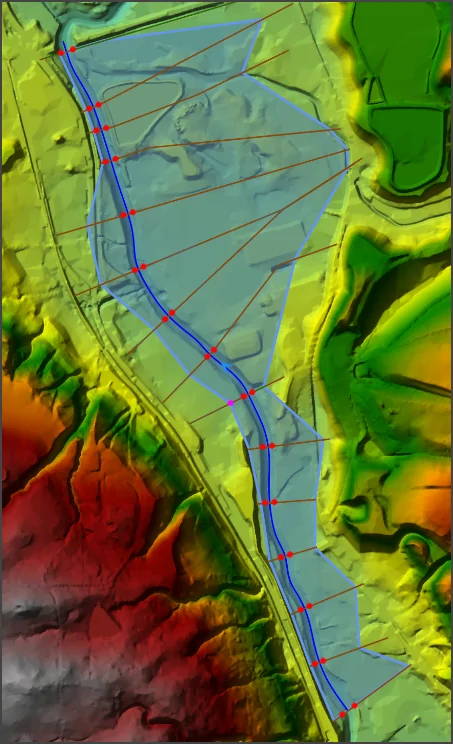
The below image shows the overlap view of the flood maps generated using Straight Line and Detailed Intersection computation.
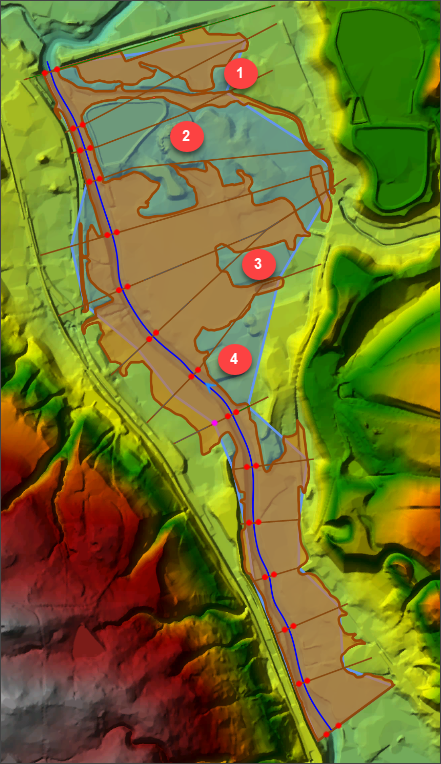
The blue-colored flood map is generated using the Straight Line computation, and the red-colored flood map is generated using the Detailed Intersection computation. The callout points 1, 2, 3, and 4 represent the high grounds in the flood map that were not identified during Straight Line computation.
Time Series Animation is a visual way to illustrate the flood flow with respect to time. It allows the user to view data between certain time intervals in animated format. The user can generate time series flood map animation for various flood map types such as water surface elevation, flood depth, shear stress, and Froud number.
Selecting the Time Series Animation computation option will display the following Flood Map dialog box.
Note that the content of the Flood Map Options panel changes based on the selection of flood map type.
The below sections describe how to generate a flood map using Time Series Animation computation and interact with the above dialog box.
To specify computation options for Time Series Animation computation, follow these steps:
![[Options] button](/wp-content/uploads/sites/25/2021/09/Flood-Map-Command-Img-31.png)
The Flood Map Specifications section of the Time Series Animation computation type allows the user to define the display properties of the flood map, velocity vectors, and particle tracking. Note that the content of the Flood Map Options panel changes based on the selected flood map type.
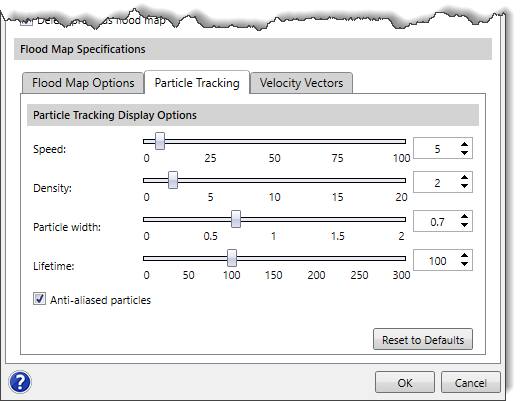 Checking the Anti-aliased particles checkbox causes the software to remove any jaggies from the particle flow field.
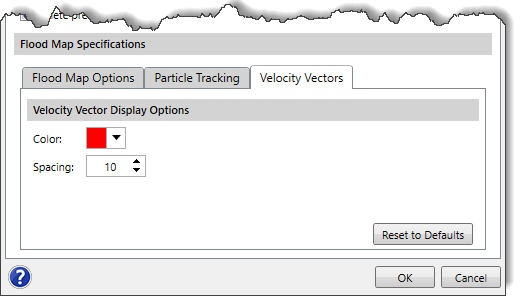 The user can select the color for the velocity vector using the Color dropdown color palette and define the spacing between the two velocity vectors using the Spacing spin control button.
Once all the options are configured in the Flood Map dialog box, the user can click the [OK] button. The software will generate a time series animation of the flood map corresponding to the selected flood map type in Map View.
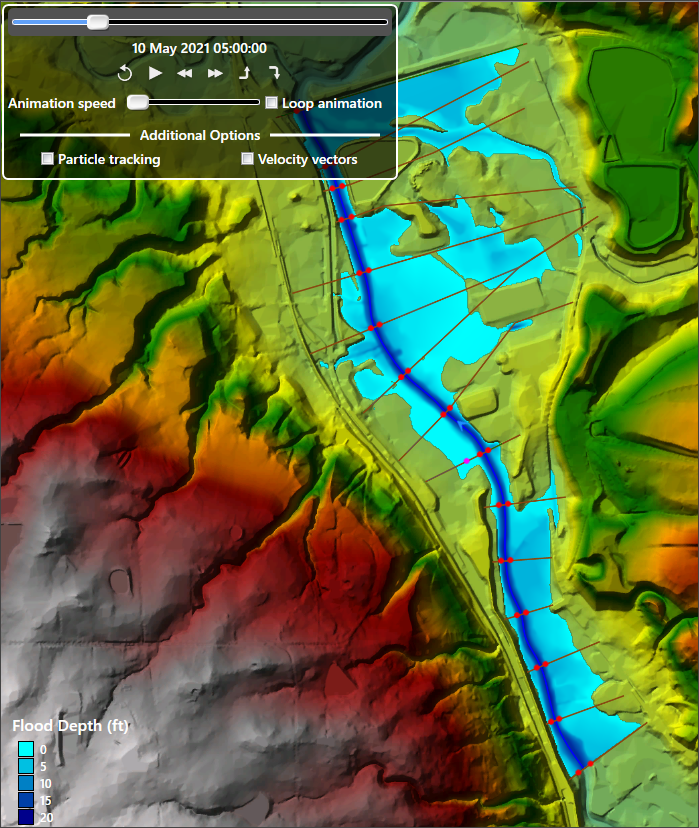
The below image shows a flood map generated using Time Series Animation computation. The animation control panel shown at the top left of the flood map allows the user to control the flow animation.


CivilGEO G2 Reviews
4.8/5.0 Rating, Over 230 Reviews

GeoHECRAS is recognized as the top Civil Engineering Design Software with an average of 4.8 out of 5.0 rating from over 230 real user reviews on G2.


We use cookies to give you the best online experience. By agreeing you accept the use of cookies in accordance with our cookie policy.
When you visit any web site, it may store or retrieve information on your browser, mostly in the form of cookies. Control your personal Cookie Services here.


