
Welcome to CivilGEO Knowledge Base
Welcome to CivilGEO Knowledge Base
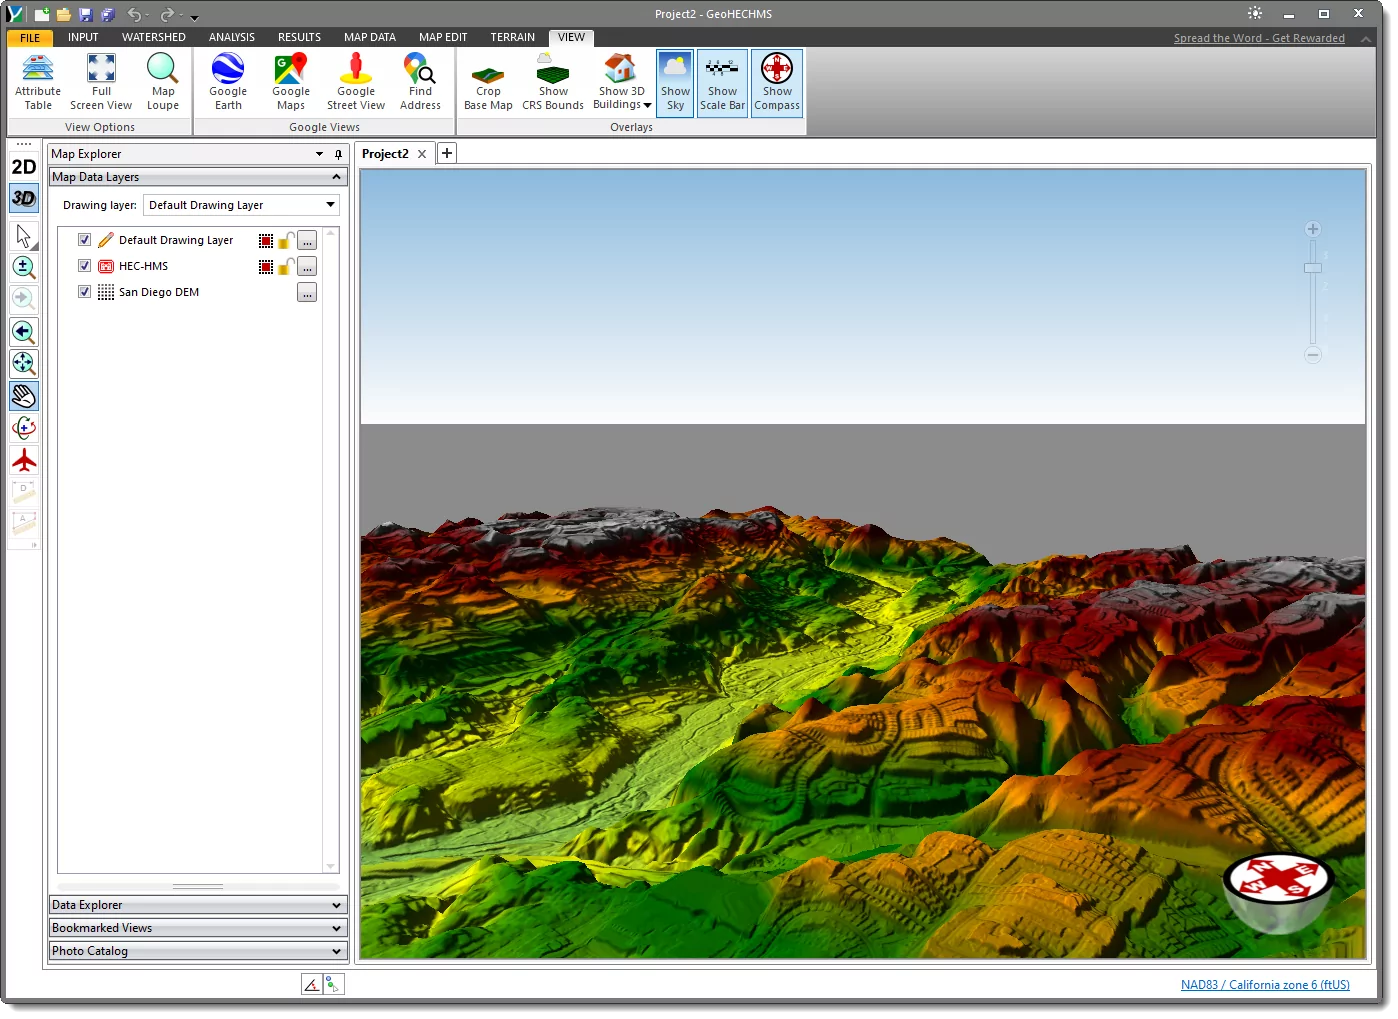
In CivilGEO’s software, the user can incorporate more than one terrain surface or elevation grid into the project. The software can compute a color ramp and generate a corresponding color fill for the added elevation grids. The generated color fill is saved along with the elevation grid so that it will be available with the project file the next time the project is loaded.
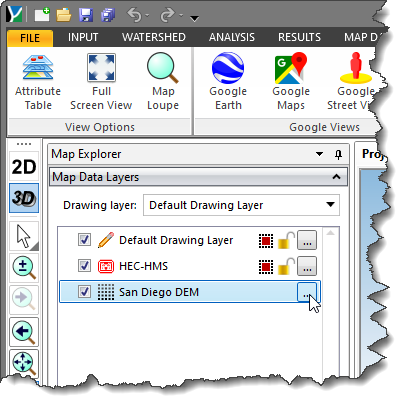
Follow the steps below to view and edit elevation grid properties.
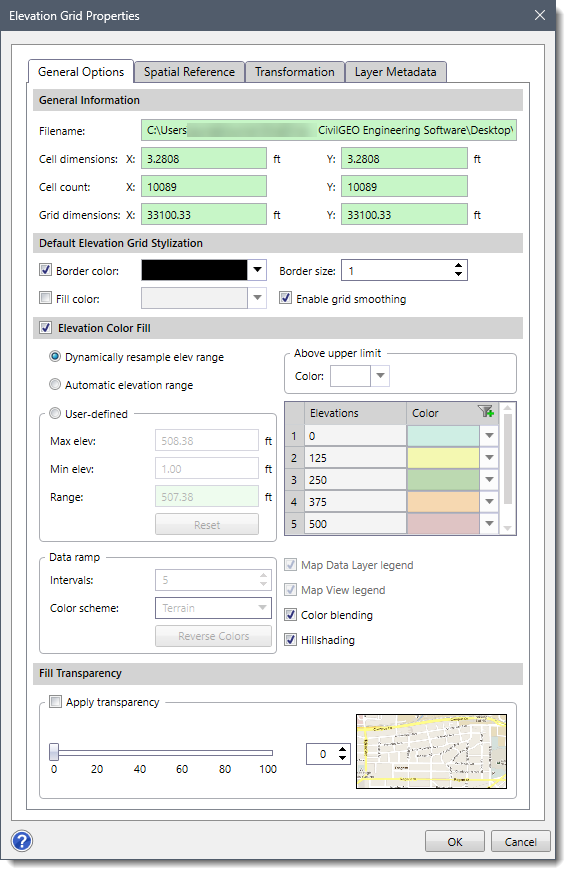
The following sections describe how to use various options in the Elevation Grid Properties dialog box to view and edit the elevation grid properties.
The different options within this tabbed panel are described below:
This section contains read-only information about the system location of the elevation grid file, the cell dimensions, the cell count, and the grid dimensions. The units of the cell and grid dimensions change as per the project units.
This section is used to define various elevation grid stylizations, such as border color, border size, and color fill options. If the Enable grid smoothing option is checked, then it improves the color shades that are used to display colorized (i.e., color ramp) elevation grids. This option makes the colorization much sharper and clearer, showing more details relative to elevation changes within the grid.
By enabling this section, the user can utilize different options that help to improve the color rendering of the terrain surface.
If the Dynamically resample elev range option is selected, then the software dynamically renders the color shading based on the terrain’s elevation range. If the user zooms into a flat area on the Map View, the software then dynamically adjusts the maximum and minimum elevation values for the raster extents to automatically adjust the color fill. This color fill option provides a good range of color shades for the entire terrain surface. By default, this option is selected.
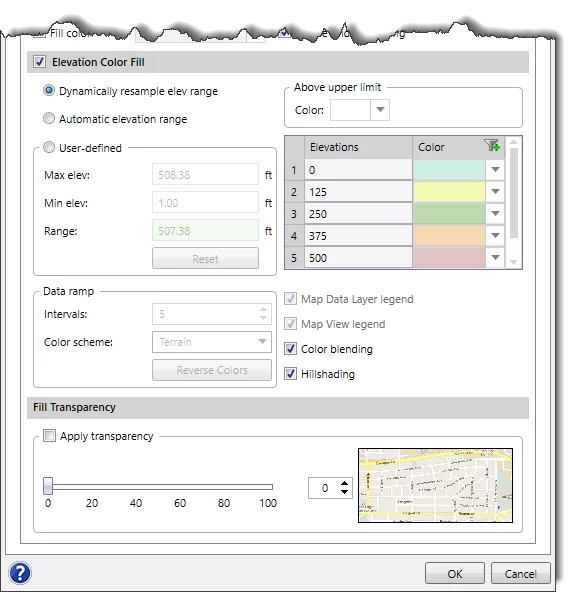
If the Automatic elevation range option is selected, then the software automatically utilizes the maximum and minimum elevation range over the entire raster grid to display the color fill.
If the User-defined option is selected, then it enables all the underlying options, which allows the user to define a custom color fill scheme for the entire elevation grid. By default, the Max elev and Min elev fields display the terrain’s maximum and minimum elevations respectively. The user can also change these maximum and minimum elevations, and their corresponding elevation differences will be displayed in the Range read-only field. Clicking the [Reset] button resets the values to default.
In the Data ramp subsection, the user can define the color scheme as well as the interval for the color ramp that will be used to depict the range of elevation color fill. The Interval’s spin control option allows the user to define the interval of the color ramp. The default data ramp interval is 5. The Color scheme dropdown combo box allows the user to select the color scheme for the color ramp.
The user-defined maximum and minimum elevation range then can be utilized for the elevation color fill. In the Elevations value and Color palette table, the user can then select the desired colors for the entire elevation range defined.
Note that the Intervals defined in the Data ramp subsection create the same number of elevations in the Elevations and Color table.
If there is an upper elevation range that does not fall under the user-defined elevation range, then all those elevations can also be assigned a color using the Above upper limit dropdown color palette.
Checking the Map Data Layer legend and Map View legend checkboxes causes the software to create a color fill legend for the elevation grid in the Map Data Layers panel and on the Map View respectively.
The Color blending checkbox causes the software to perform color blending when there is not enough color range to represent all the different colors between the brightest and the darkest points of a gradient.
If the Hillshading option is checked, then it will render the terrain using a hill shading effect that produces shaded relief based on directing a light source on the terrain, which produces shadows in areas obscured from the light.
This section is used to change the transparency of the image so that the user can see through the image to the background Base Map. A transparency value of 40 to 50% works well.
Note that this section will only be enabled if the Elevation Color Fill section is enabled.
The Spatial Reference tabbed panel allows the user to manually assign the project’s CRS to the non-CRS referenced data layer if the data layer coordinates lie within the project’s CRS. Refer to this article in our knowledge base to learn more about spatial reference.
The Transformation tabbed panel allows the user to automatically apply the transformation scale factor to any particular layer and accurately map it to the project coordinate reference system (CRS). Refer to this article in our knowledge base to learn more about layer transformation.
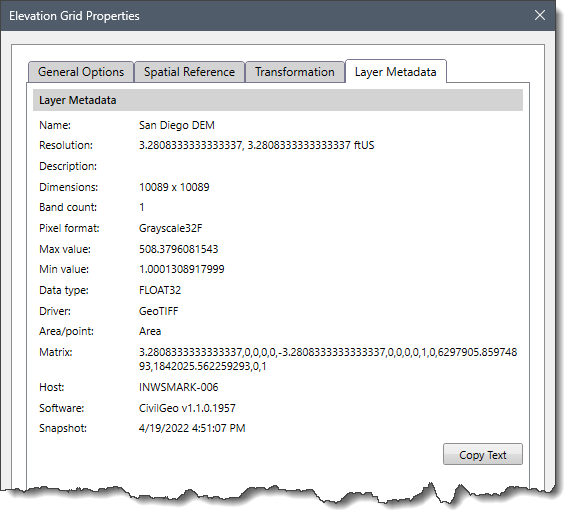
The Layer Metadata tabbed panel contains the meta description of the DEM associated with the project such as the name, resolution, dimensions, data type, pixel format, etc. You can use the [Copy Text] button to copy the metadata of the DEM to the clipboard.


CivilGEO G2 Reviews
4.8/5.0 Rating, Over 230 Reviews

GeoHECRAS is recognized as the top Civil Engineering Design Software with an average of 4.8 out of 5.0 rating from over 230 real user reviews on G2.


We use cookies to give you the best online experience. By agreeing you accept the use of cookies in accordance with our cookie policy.
When you visit any web site, it may store or retrieve information on your browser, mostly in the form of cookies. Control your personal Cookie Services here.


