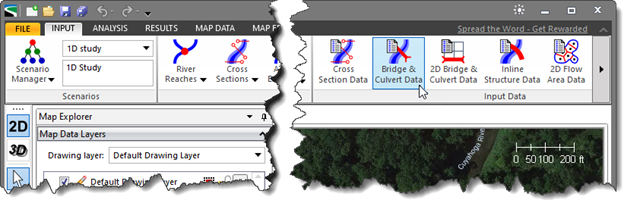
The GeoHECRAS software can model roadway crossing bridges and culverts by using the Bridge & Culvert Data command. The Bridge & Culvert Data command defines the bridge & culvert data, roadway deck geometry, bridge piers, sloping abutments, ineffective flow areas, bridge methodology & parameters, multiple opening stations, internal geometry, and more.
The user can define bridge data for 1D flow areas in the same way as defining bridge data for a 2D model. HEC-RAS provides the same low flow (energy, momentum, and Yarnell) and high flow (energy and pressure/weir) bridge modeling approaches for both 1D and 2D bridge modeling.
The following sections describe how to perform bridge modeling in GeoHECRAS.
Defining 1D Roadway Crossing Centerline
The roadway crossing centerline must be first defined to represent a bridge or culvert in a 1D model. The roadway crossing centerline must be drawn from left to right looking in a downstream direction.
To define the roadway crossing centerline, the user can use the Draw Roadway Crossings or Assign Roadway Crossings commands to either manually draw the roadway crossing centerline or assign an already existing polyline as the roadway centerline. Refer to this article in our knowledge base to learn more about the Draw Roadway Crossings or Assign Roadway Crossings commands.
1D Roadway Crossing Interior and Exterior Cross Sections
The software requires a minimum of four cross sections to be defined for modeling a roadway crossing. Two cross sections are defined at the downstream end of the roadway crossing structure. By contrast, the other two cross sections are defined at the upstream end of the roadway crossing structure. However, additional cross sections can also be defined upstream of the roadway crossing to account for additional backwater created upstream of the roadway crossing.
The two cross sections adjacent to the roadway crossing are placed in the full valley area adjacent to the roadway embankment. They represent the geometry of the river valley without the roadway embankment, which is the roadway fill area. These cross sections are called the Upstream Face Cross Section and the Downstream Face Cross Section since they are located very near the face of the roadway crossing structure.
The cross section drawn at the upstream end of the Upstream Face Cross Section is called the Approach Cross Section. This cross section is drawn upstream of the roadway crossing at a distance far enough where the impact of the flow contracting inward through the bridge or culvert opening is no longer felt. The cross section drawn downstream of the Downstream Face Cross Section is called the Exit Cross Section and is placed at a distance far enough in the downstream direction where the impact of the flow expanding outward is no longer considered significant.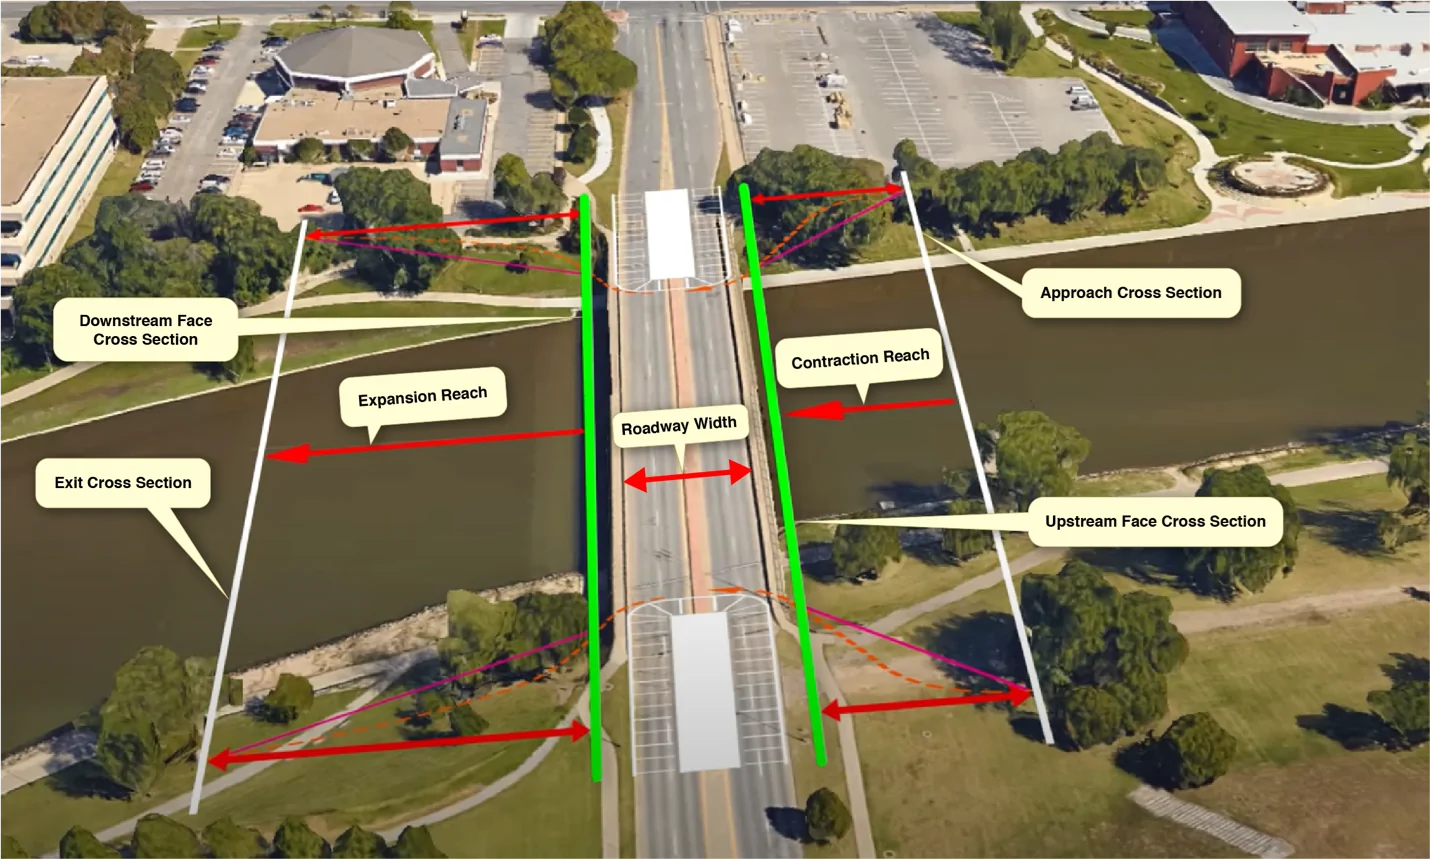
Entering Bridge Data
Once the 1D roadway crossing is defined, the user can enter the data for the 1D bridge in the Bridge & Culvert Data dialog box.
Follow the steps below to enter the bridge data:
- From the Input ribbon menu, select the Bridge & Culvert Data command.
Alternatively, the user can either double click the roadway structure on the Map View or choose the Bridge & Culvert Data command from the Roadway Crossings dropdown menu of the Input ribbon menu.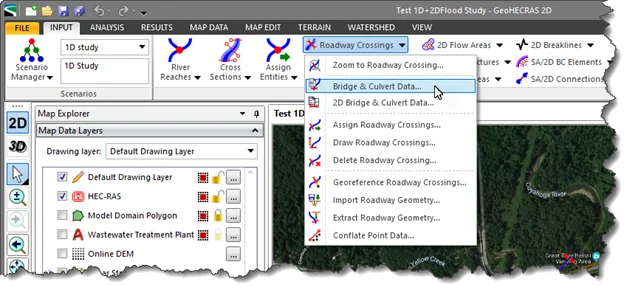
- The Bridge & Culvert Data dialog box will be displayed.
The following sections describe how to enter the bridge data and interact with the above dialog box.
Selecting Roadway Crossing
This section of the Bridge & Culvert Data dialog box is used to switch between roadway crossings. Note that if the user opens the Bridge & Culvert Data dialog box by double-clicking the roadway crossing on Map View, that roadway crossing will be selected by default.
This section contains the following entries:
- River: This dropdown combo box shows all the currently defined rivers. When the user changes a river, then the Reach dropdown combo box also updates to show a valid corresponding river reach.
- Reach: This dropdown combo box shows all the currently defined reaches that correspond to the selected river.
- River station: This is an editable dropdown combo box that shows the currently defined roadway crossing river stations that correspond to the selected reach. The user can also change the river station of the current roadway crossing by clicking on the edit tool option adjacent to the River station dropdown entry or by clicking the […] pick button to graphically select the roadway crossing from the Map View.
- Node name: This entry field allows the user to assign an optional text label to the current roadway crossing.
Roadway Crossing Specifications
This section of the Bridge & Culvert Data dialog box allows the user to select the various roadway specifications from the Roadway Crossing Specifications dropdown combo box. The Roadway Crossing Specifications dropdown combo box lists the following roadway specifications:
- Deck Roadway
- Culverts
- Bridge Piers
- Sloping Abutments
- Ineffective Flow Areas
- Bridge Methodology
- Bridge Parameters
- WSPRO Parameters
- Multiple Openings
- Internal Geometry
- Build Bridge Opening
- Opening Comparison Analysis
- Geometry Adjustment
- Geometry Point Reduction
- Profile Results
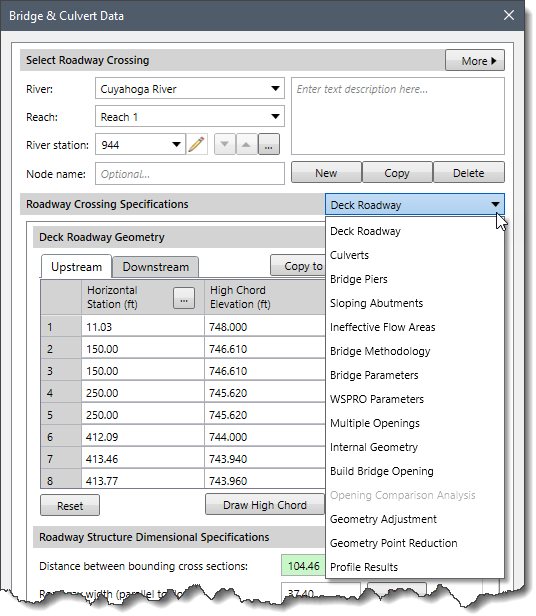
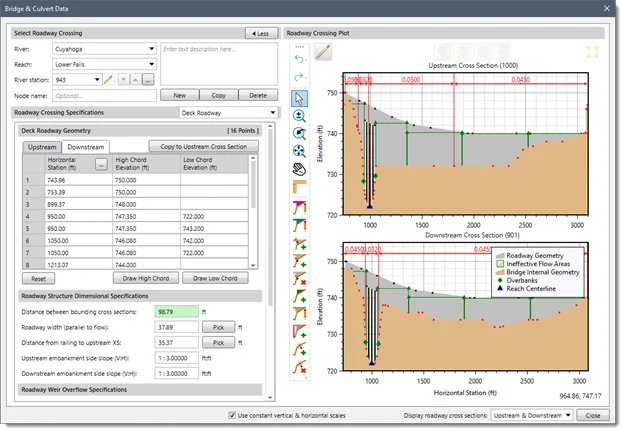
Defining Deck Roadway Geometry
The Deck Roadway data panel is displayed by default when the Bridge & Culvert Data dialog box is displayed. This data panel provides a table for entering and editing the roadway high chord and bridge opening low chord geometry. The data in the table is used to describe the area that is blocked due to the roadway bridge deck, road embankment, and bridge opening vertical abutments.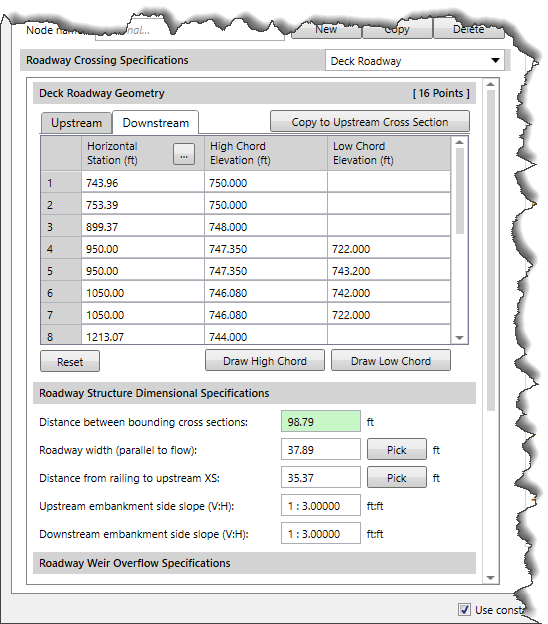
To learn more about the Deck Roadway data panel, refer to this article in our knowledge base.
Defining Culverts
The Culverts data panel is used to define the culverts at a roadway crossing. Select the Culverts option from the Roadway Crossing Specifications dropdown combo box.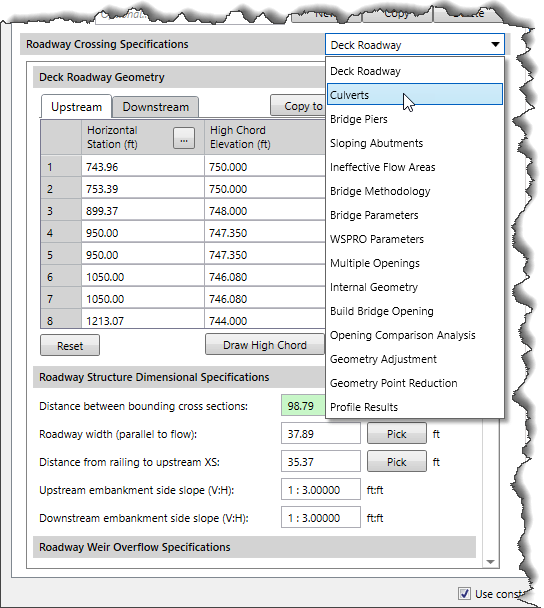
The Culverts data panel will be displayed.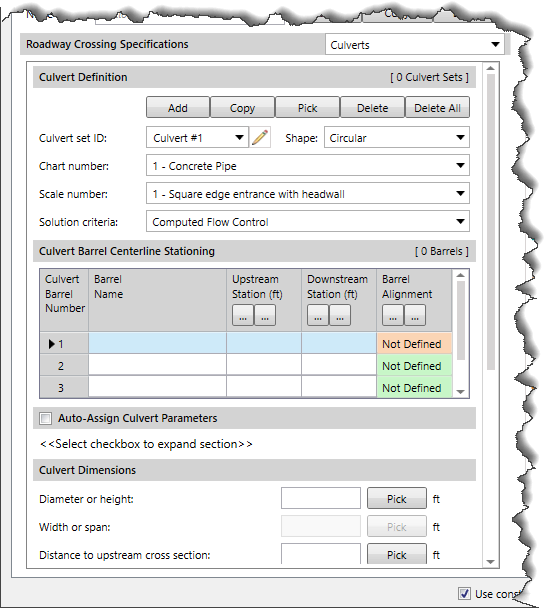
To learn more about the Culverts data panel, refer to this article in our knowledge base.
Defining Piers and Sloping Abutments
After entering the deck roadway and culverts data, the user can define bridge piers and sloping abutments that are inside of the bridge opening.
Bridge Piers
Select the Bridge Piers option from the Roadway Crossing Specifications dropdown combo box.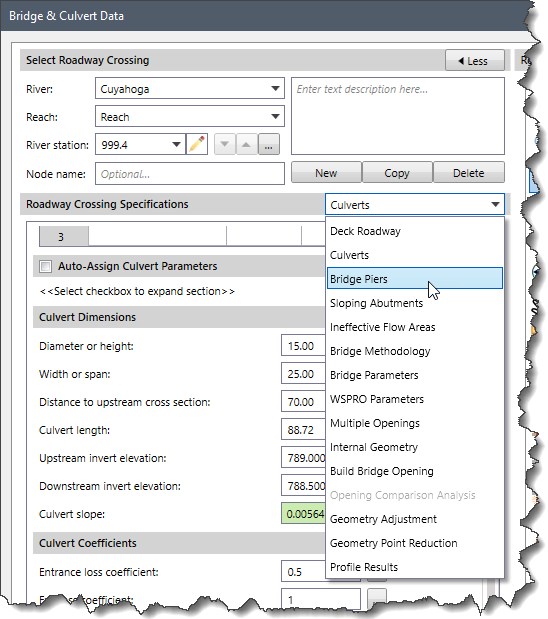
The Bridge Piers data panel will be displayed.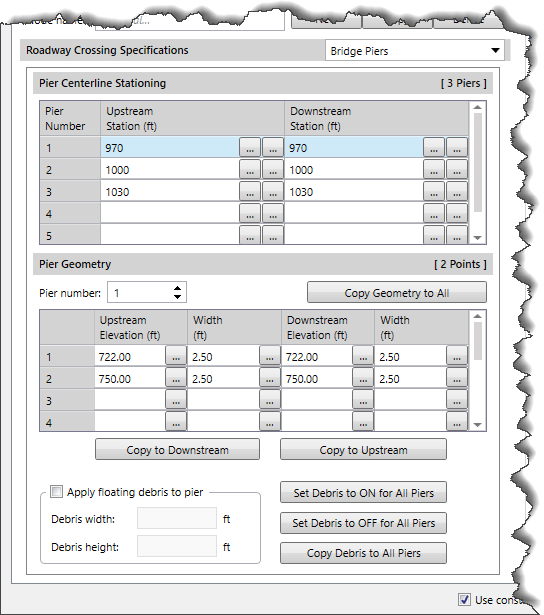
In the above panel, the user can enter the pier data in the same exact manner as required for a 2D bridge. To learn more about the Bridge Piers panel, refer to this article in our knowledge base.
Sloping Abutments
Select the Sloping Abutments option from the Roadway Crossing Specifications dropdown combo box.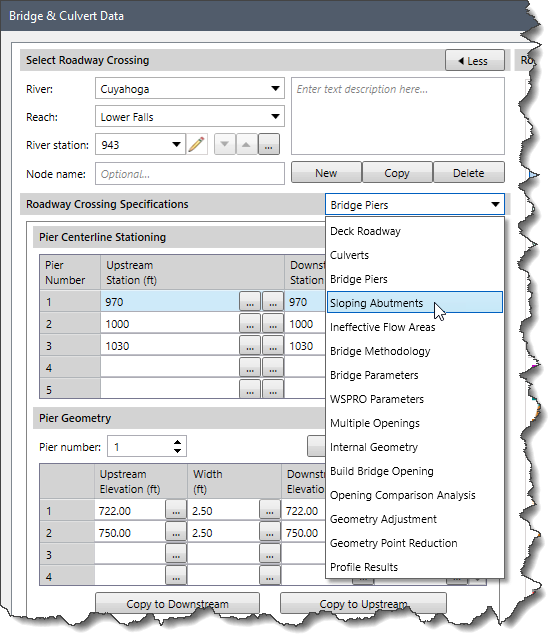
The Sloping Abutments data panel will be displayed.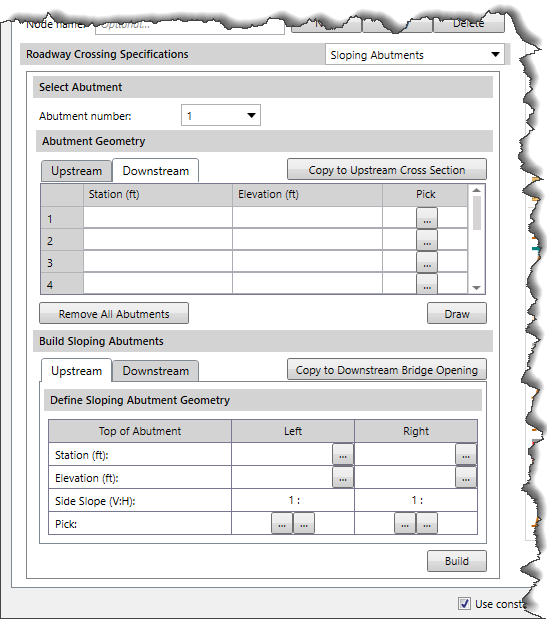
The Sloping Abutments data panel is the same as for 2D bridges and works the same way. To learn more about the Sloping Abutments data panel, refer to this article in our knowledge base.
Defining Ineffective Flow Areas
The user can define ineffective flow areas for the upstream and downstream cross sections outside of the bridge. If the user has included the left and right roadway approaches as part of the bridge, then it may be necessary to define ineffective flow areas for the outside cross sections in order to compute accurate headwater and tailwater elevations for the bridge curves.
Select the Ineffective Flow Areas option from the Roadway Crossing Specifications dropdown combo box.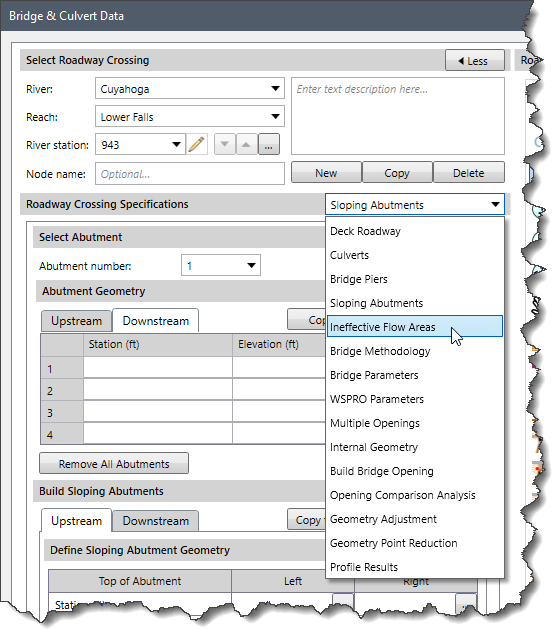
The Ineffective Flow Areas data panel will be displayed.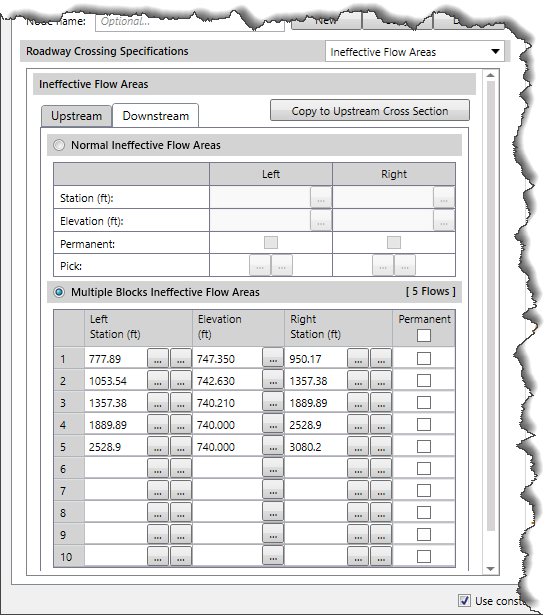
This data panel contains the following two types of ineffective flow areas:
Normal Ineffective Flow Areas
This section allows the user to define a left station and elevation and a right station and elevation for the ineffective flow area. Refer to this article in our knowledge base to learn more about Normal Ineffective Flow Areas.
Multiple Blocks Ineffective Flow Areas
This section allows the user to define up to 10 individual blocks for each cross section. Refer to this article in our knowledge base to learn more about Multiple Blocks Ineffective Flow Areas.
Defining Bridge Modeling Approach
The Bridge Methodology data panel allows the user to define which computational methods HEC-RAS will use at a bridge opening. The user can also select the bridge opening types and bridge pier shapes using this data panel.
Select the Bridge Methodology option from the Roadway Crossing Specifications dropdown combo box.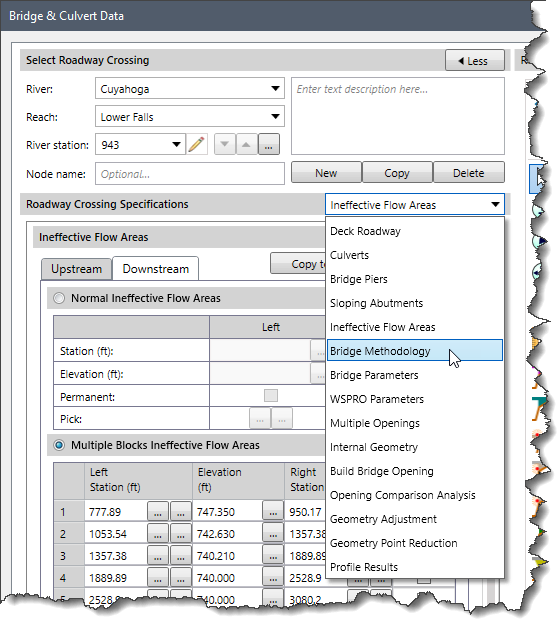
The Bridge Methodology data panel will be displayed.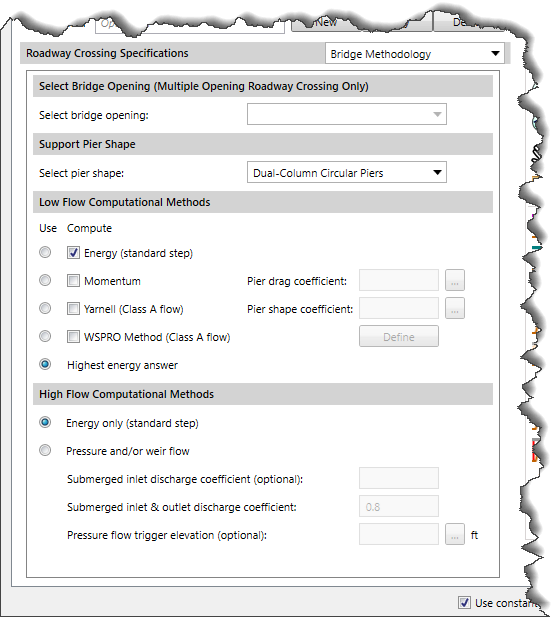
To learn more about the Bridge Methodology data panel, refer to this article in our knowledge base.
Defining Bridge Parameters
The Bridge Parameters data panel allows the user to define the bridge parameters to be used for all bridges (if multiple bridge openings) at a roadway crossing.
Select the Bridge Parameters option from the Roadway Crossing Specifications dropdown combo box.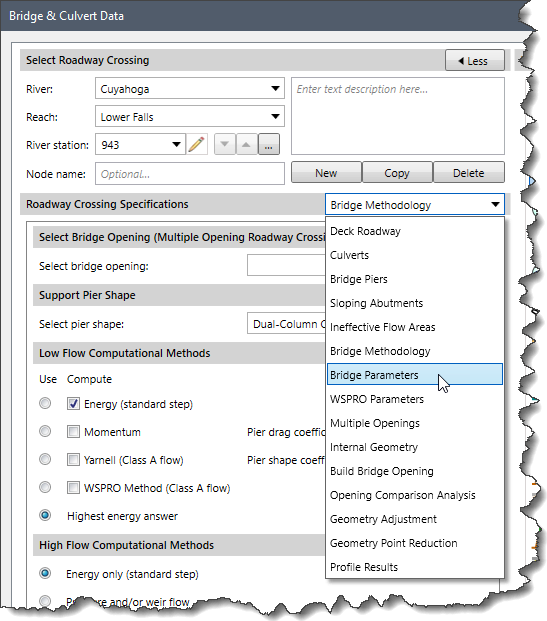
The Bridge Parameters data panel will be displayed.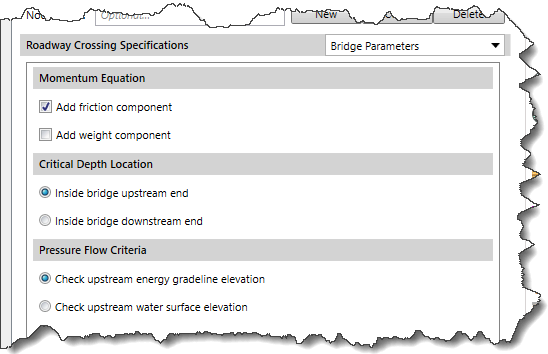
To learn more about Bridge Parameters data panel, refer to this article in our knowledge base.
Defining WSPRO Parameters
The WSPRO Parameters data panel computes the water surface profile through a bridge by solving the energy equation. Select the WSPRO Parameters option from the Roadway Crossing Specifications dropdown combo box.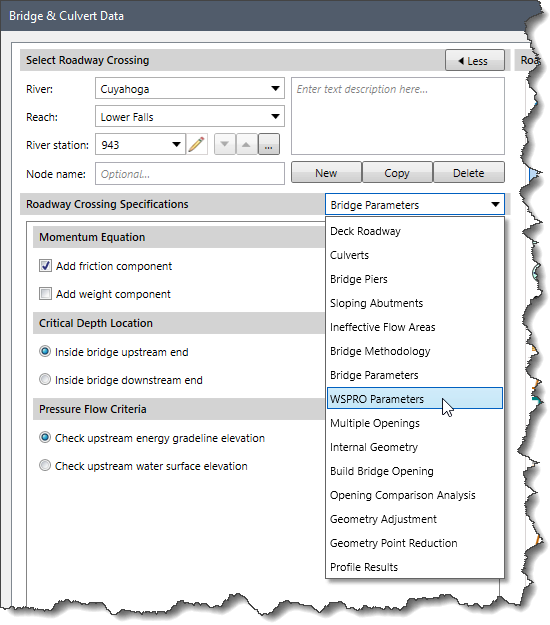
The WSPRO Parameters data panel will be displayed.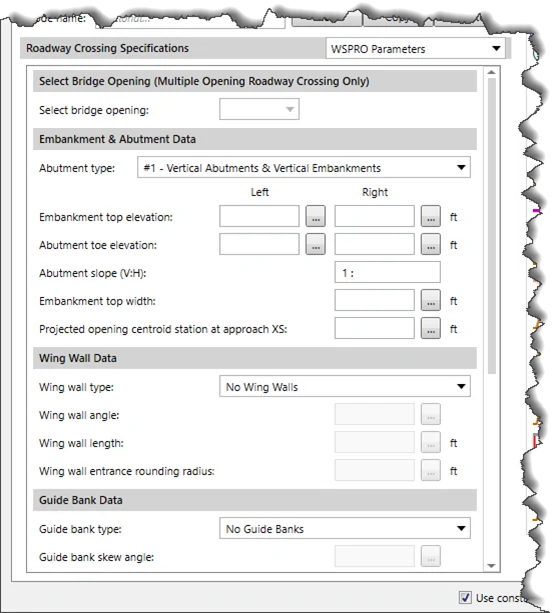
To learn more about the WSPRO Parameters data panel, refer to this article in our knowledge base.
Defining Multiple Openings
The Multiple Openings data panel defines stagnation points for multiple opening roadway crossings. Select the Multiple Openings option from the Roadway Crossing Specifications dropdown combo box.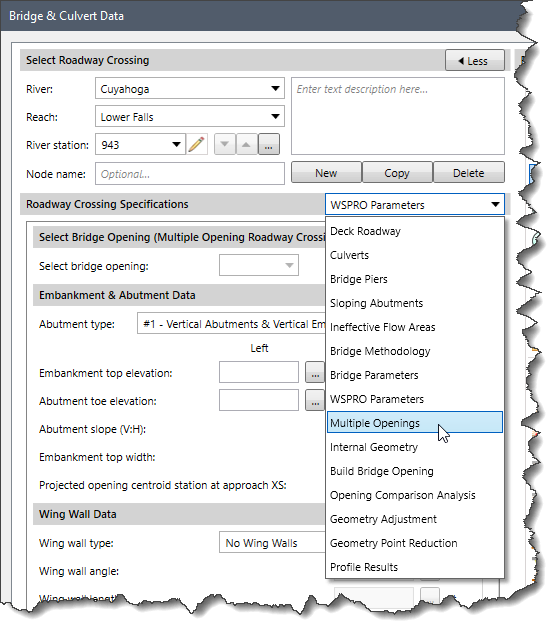
The Multiple Openings data panel will be displayed.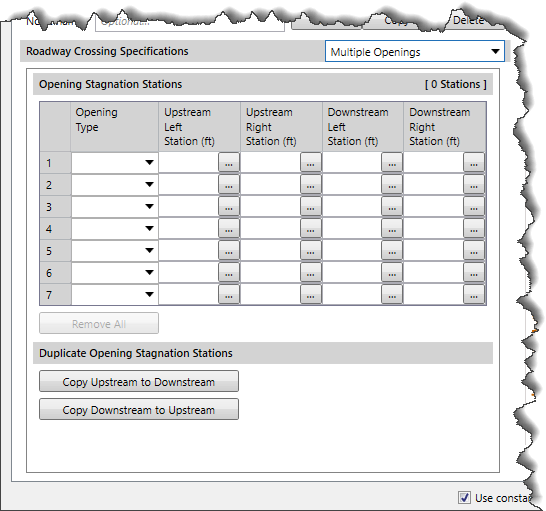
To learn more about the Multiple Openings data panel, refer to this article in our knowledge base.
Defining Internal Geometry
The Internal Geometry data panel allows the user to edit the two-ground geometry cross sections inside of the bridge opening. This panel allows the user to change the station and elevation data, roughness coefficients, and main channel bank stations for each of the two internal bridge cross sections.
Select the Internal Geometry option from the Roadway Crossing Specifications dropdown combo box.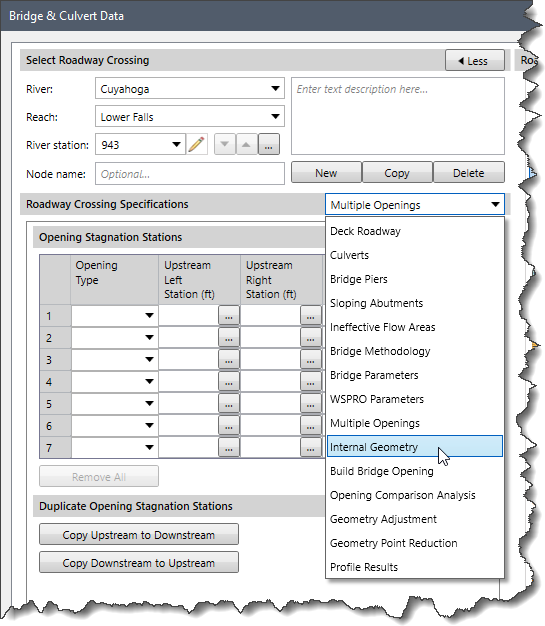
The Internal Geometry data panel will be displayed.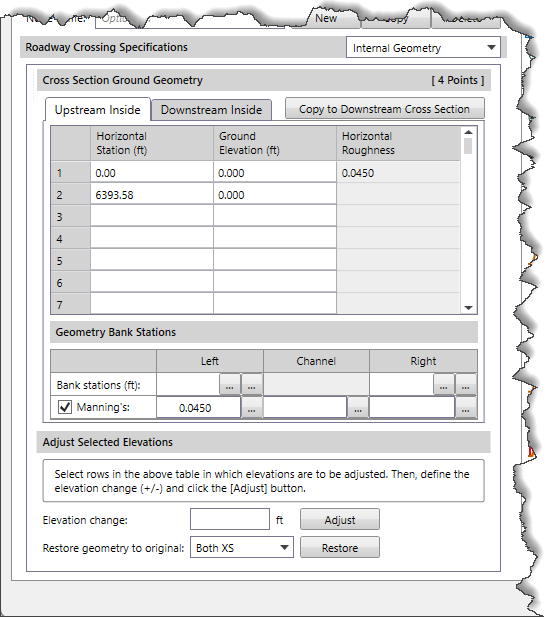
To learn more about the Internal Geometry data panel, refer to this article in our knowledge base.
Defining Build Bridge Opening
The Build Bridge Opening data panel allows the user to define the geometry of the bridge opening by using span or abutment data. Select the Build Bridge Opening option from the Roadway Crossing Specifications dropdown combo box.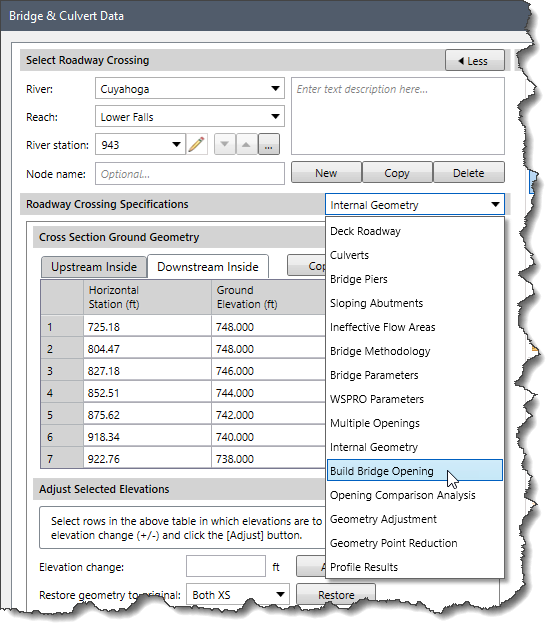
The Build Bridge Opening data panel will be displayed.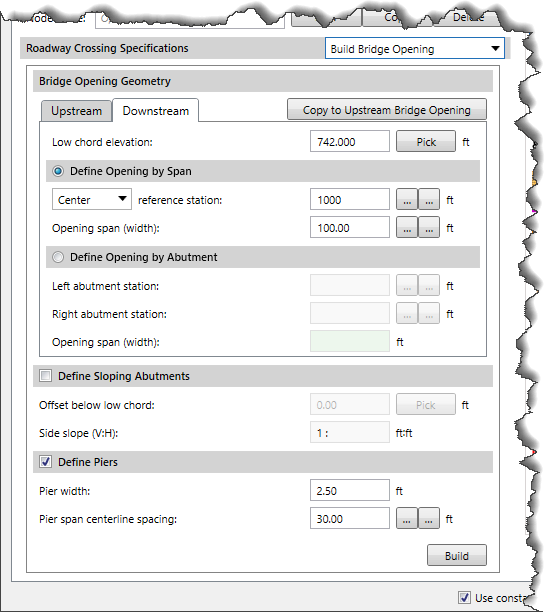
To learn more about the Build Bridge Opening data panel, refer to this article in our knowledge base.
Bridge Opening Comparison Analysis
This data panel analyzes differences between bridge opening data for any two selected scenarios, and then exports the Opening Comparison Analysis results table.
Select the Opening Comparison Analysis option from the Roadway Crossing Specifications dropdown combo box.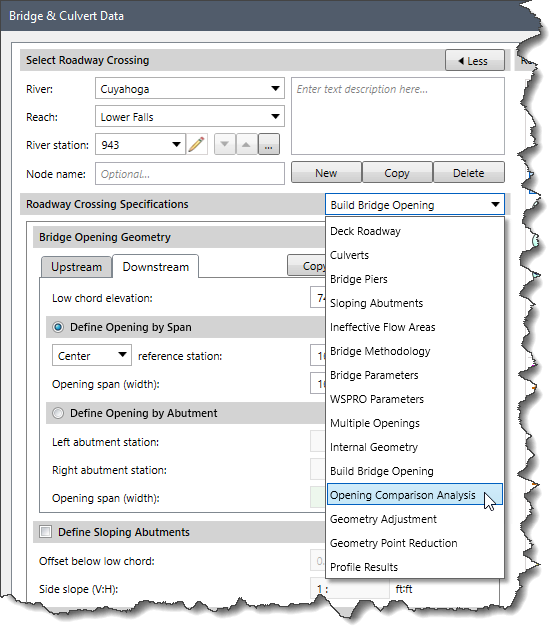
The Opening Comparison Analysis dialog box will be displayed.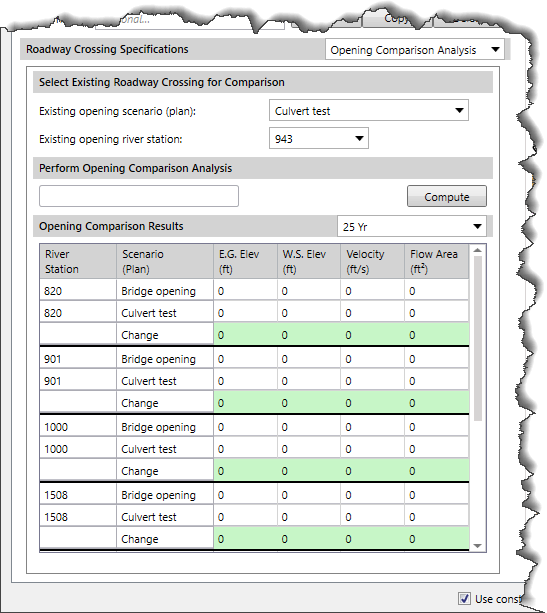
This data panel contains three sections: Select Existing Roadway Crossing for Comparison, Perform Opening Comparison Analysis, and Opening Comparison Results. To know more about this data panel, refer to this article in our knowledge base.
Adjusting Roadway Geometry
The user can adjust the roadway geometry at any time during the modeling process. Select the Geometry Adjustment option from the Roadway Crossing Specifications section.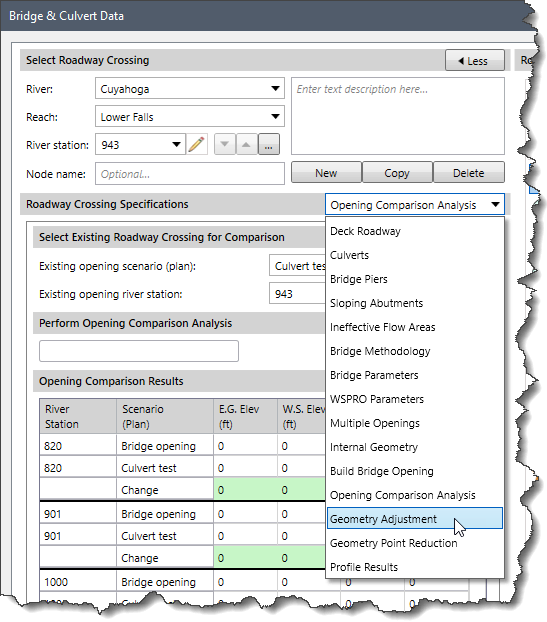
The Geometry Adjustment data panel will be displayed.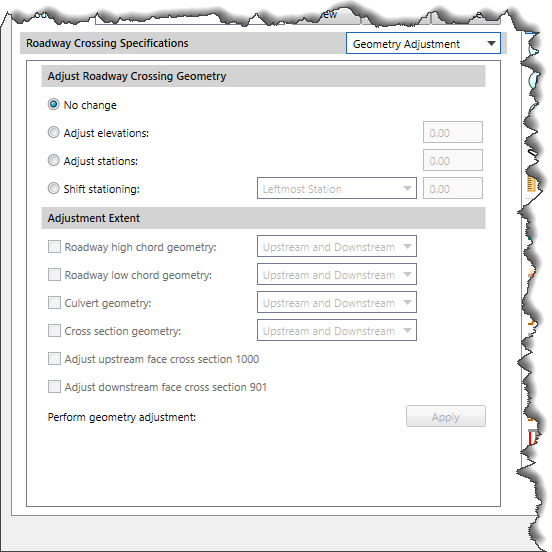
This data panel is similar to the Geometry Adjustment data panel of the 2D Bridge & Culvert Data dialog box. Refer to this article in our knowledge base to learn how to do the adjustment of the roadway geometry.
Geometry Point Reduction in Roadway Crossing
Select the Geometry Point Reduction option from the Roadway Crossing Specifications section.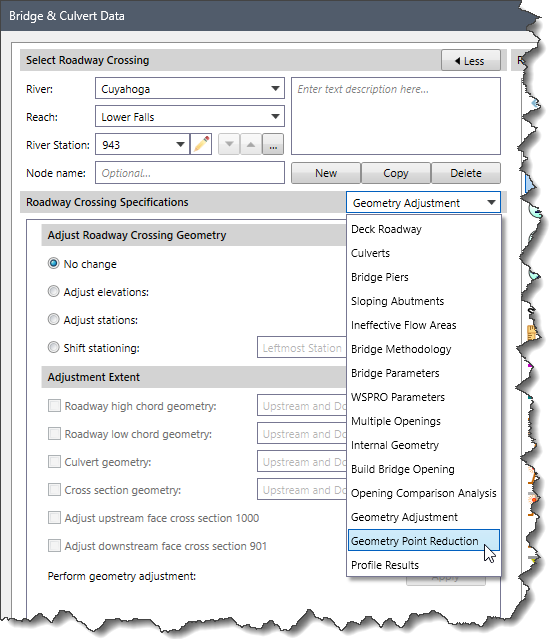
The Geometry Point Reduction data panel will be displayed.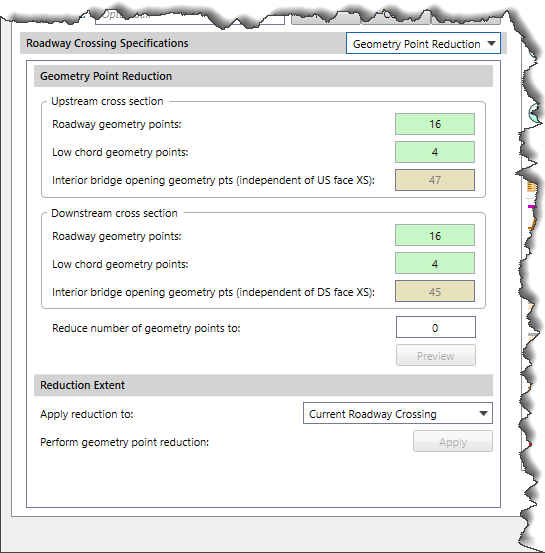
Refer to this article in our knowledge base to learn more about the Geometry Point Reduction data panel in roadway crossing.
Defining Profile Results
The Profile Results data panel allows the user to select the analysis results. Select the Profile Results option from the Roadway Crossing Specifications section.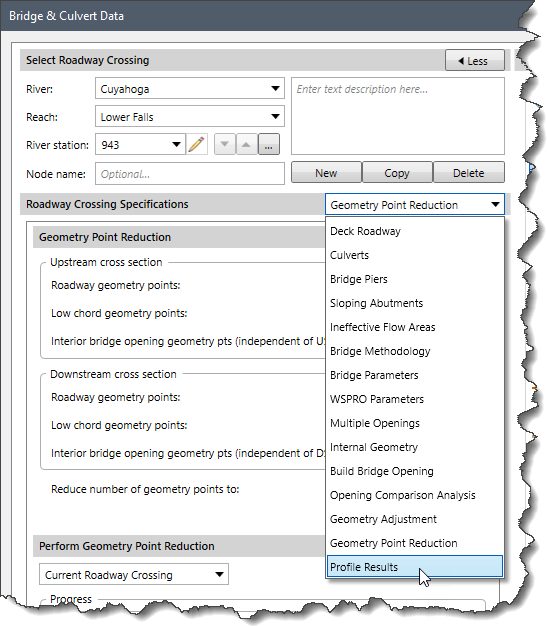
The Profile Results data panel will be displayed.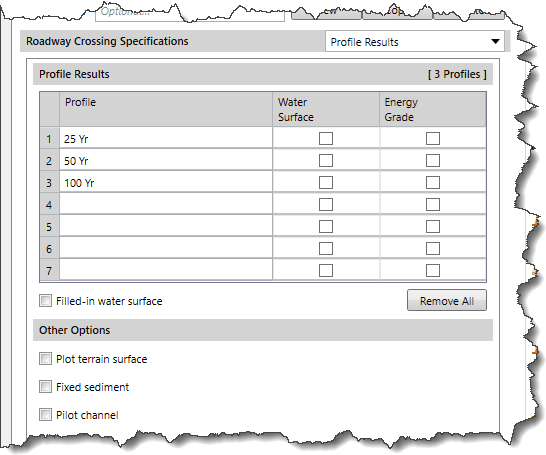
To learn more about the Profile Results data panel, refer to this article in our knowledge base.
Defining HTAB Parameters
After the user has defined the necessary data for the roadway crossing structure, the user needs to define the parameters necessary to create the HTAB (hydraulic table of rating curves). Note that this data is only used for unsteady flow simulations and is ignored for steady flow simulations. To change the flow data from steady to unsteady flow data, go to the Input ribbon menu, click the Scenario Manager dropdown menu, and then select the Scenario Manager command. The Scenario Manager dialog box will be displayed.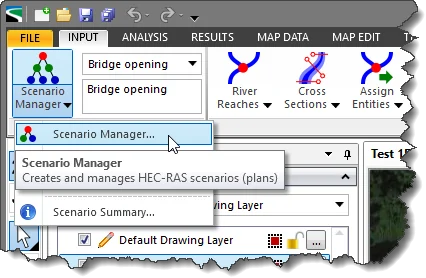
In the Scenario Manager dialog box, enable the Unsteady Flow Data radio button and add new unsteady flow data from the Unsteady flow dropdown combo box. Close the Scenario Manager dialog box and the current scenario flow data is now changed to unsteady flow.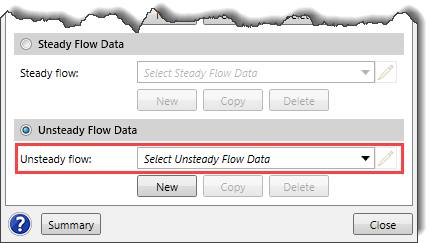
The user can now select the Hydraulic Parameters – Bridges & Culverts command from the Rating Curves – Hydraulic Parameters dropdown menu of the Analysis ribbon menu to define the parameters.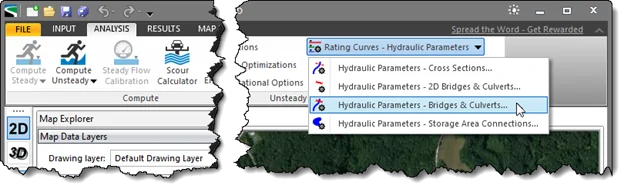
The Hydraulic Parameters – Bridges & Culverts dialog box will be displayed.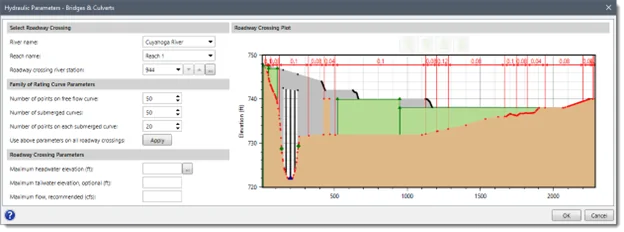
Selecting Roadway Crossing
The Select Roadway Crossing section allows the user to select the roadway crossing for purposes of defining the hydraulic parameters. This section contains three entries: River name, Reach name, and Roadway crossing river station.
Family of Rating Curve Parameters
The Family of Rating Curve Parameters section is used to define the limits of the family of rating curves that are developed for the roadway crossing. This section covers the following parameters:
- Number of points on free flow curve
- Number of submerged curves
- Number of points on each submerged curve
- Use above parameters on all roadway crossings
Roadway Crossing Parameters
This section defines the parameters necessary to compute the rating curves for the selected roadway crossing. This section covers the following parameters:
- Maximum headwater elevation
- Maximum tailwater elevation, optional
- Maximum flow, recommended
The Maximum headwater elevation defines the maximum elevation that the water surface can reach on the upstream side of the roadway crossing. Enter the maximum elevation that you expect the water surface to reach on the upstream side of the bridge in the Maximum headwater elevation entry field. Click on the […] button next to the Maximum headwater elevation entry field to pick the elevation from the roadway crossing plot. To learn more about the maximum headwater parameter settings, refer to this article in our knowledge base.
The Maximum tailwater elevation and Maximum flow parameters are optional. However, entering a maximum flow value is recommended as it will help control the limits of the hydraulic property table at the roadway crossing.
To learn more about the various parameters provided in this dialog box, refer to this article in our knowledge base.
When the data are defined, the user can click the [OK] button to save the entered data and close the dialog box.
Performing the Analysis
After the user has entered the roadway crossing data, the user must run the analysis by selecting the Compute Unsteady command from the Analysis ribbon menu.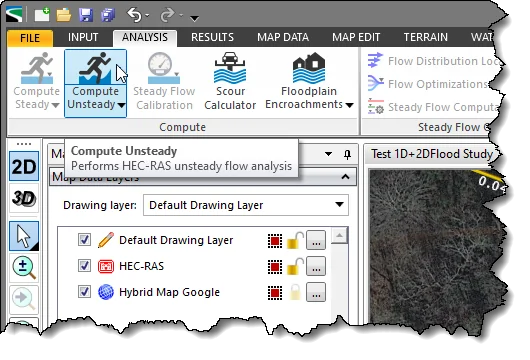
When the analysis run is complete, the software will then generate a family of rating curves for any 1D bridge openings and then perform the 1D flow analysis.
Viewing Output Results
Once the model has finished running, the user can begin to view the output related to the 1D bridge hydraulics.
The software provides several types of output results for 1D bridges, as described below:
- Inundation maps including water surface, velocity, etc.
Refer to this article in our knowledge base to learn how to view inundation maps. - Stage and flow hydrographs
Refer to this article in our knowledge base to learn how to view stage and flow hydrographs. - Cross section plots
Refer to this article in our knowledge base to learn how to view cross section plots.