In stormwater modeling and drainage system design, understanding the behavior of water as it flows through a closed conduit, such as a pipe or culvert, is essential. One crucial aspect to determine this is the water surface profile, which represents the longitudinal variation in flow depth along the pipe.
Accurately determining the water surface profile helps the user anticipate flow conditions, locate hydraulic jumps, and verify that systems perform within acceptable limits.
Factors Impacting the Water Surface Profile
The following factors impact the water surface profile in a pipe:
- Flow Rate
Flow rates can change the flow pattern and affect how full the pipe is.
- Pipe Slope
The slope of the pipe impacts flow velocity and energy grade, which in turn affects depth variations.
- Pipe Geometry
The diameter, shape, and cross-section of the pipe determine the hydraulic radius and flow area, which further impacts the water surface profile.
- Pipe Roughness
The Manning’s roughness value (represented by “n”) impacts the flow velocity and depth.
- Boundary Conditions
Tailwater level, flow pattern, and inlet/outlet control also impact how the water surface profile develops.
Applications of Water Surface Profiling
The following represent widespread applications associated with determining water surface profiles within a pipe:
- Stormwater Management
Determining the water surface profile helps to design pipes that avoid surcharging or flooding during storm events.
- Hydraulic Engineering
Civil engineers can use the water surface profile to analyze the gradually varied flow and identify transitions such as supercritical to subcritical flow (hydraulic jump) within a pipe.
- Water Distribution Systems and Drainage Network
Determining the water surface profile also ensures optimal system performance and flow capacity under varied demand conditions.
Key Hydraulic Equations for Analysis
Continuity Equation
This equation expresses the conservation of mass in a flowing system. The discharge (Q) is the product of flow velocity (v) and cross-sectional flow area (A).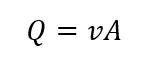
Where:
Q = Discharge (flow rate)
v = Flow velocity
A = Cross-sectional flow area
Manning’s Equation
This equation estimates flow in an open channel or under partially full pipe conditions. It accounts for pipe shape and cross-sectional area (A), surface roughness (or Manning’s roughness) coefficient (n), hydraulic radius (R), and channel slope (S).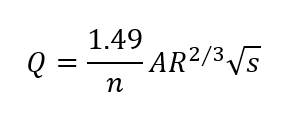
Where:
Q = Discharge (flow rate)
n = Manning’s roughness coefficient
A = Cross-sectional flow area
R = Hydraulic radius
s = Channel slope
Energy Equation
This equation compares energy at two points in the system. It considers velocity head (v²/2g) and elevation head (Y), allowing engineers to evaluate changes in flow energy along the pipe.
Where:
v2/2g = Velocity head
Y = Elevation head
Determining Water Surface Profile within a Pipe
The water surface profile within a pipe is determined by comparing energy levels at two sections along the pipe. Starting from a known depth at one end, the energy is calculated for the next section to estimate the flow depth there. This process is repeated along the length of the pipe until the profile is established from start to end.
To determine the water surface profile within a pipe, the user can:
Define the Pipe System
Define the pipe geometry, that is, length, diameter, and slope of the pipe.
Determine the Flow Pattern
Determine the pattern of the flow through the flow type. The full flow represents the pressurized flow conditions, and the partially full flow represents open channel flow conditions.
Apply the Key Hydraulic Equations
Use the appropriate equations (Continuity, Manning’s, and Energy) to compute the flow depth at each section.
Identify Potential Hydraulic Jumps
In some cases, a hydraulic jump may occur when supercritical flow transitions to subcritical flow, often causing a sudden rise in the water surface. This occurs due to a change in slope, downstream controls, or other energy-loss conditions. Identifying where a hydraulic jump might occur is important for assessing energy dissipation and flow behavior within the pipe. Refer to this article in our knowledge base to learn more about the hydraulic jump.
Water Surface Profiles in GeoSTORM
In GeoSTORM, users can compute and visualize the water surface profile within a pipe using the Profile Plot command. The following illustration displays a typical water surface profile within a pipe in GeoSTORM: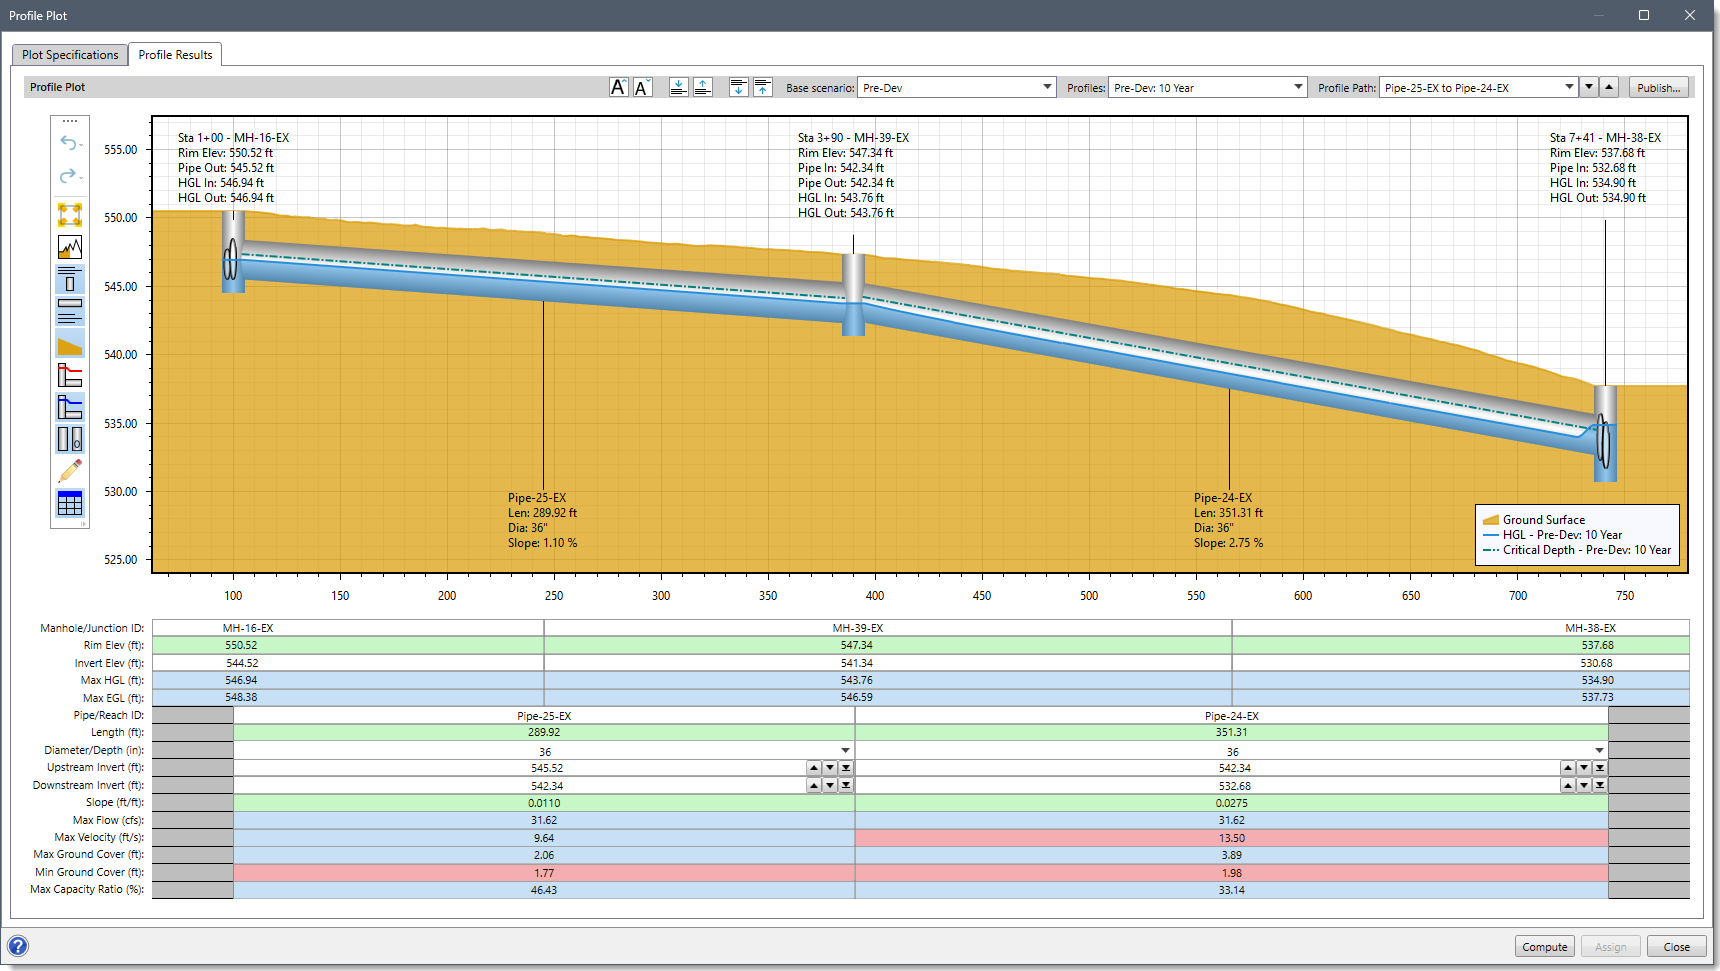
Refer to this article in our knowledge base to learn more about the Profile Plot command.