The Subbasin TOC Data command allows the user to compute the time of concentration (TOC) for one or more subbasins using the SCS Watershed Lag method. The user can select the TOC/Lag time method from the Subbasin – TOC/Lag Time Method dropdown combo box in the General Preferences section of the Options backstage page.
The SCS Watershed Lag method computes TOC using the following equation:
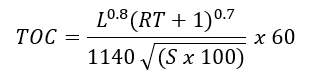
Where:
L = Longest flow path in the subbasin
S = Average subbasin slope
RT = Maximum potential retention
Also,

Here, CN = Curve number
Follow the steps below that describe how to compute time of concentration using the SCS Watershed Lag TOC method:
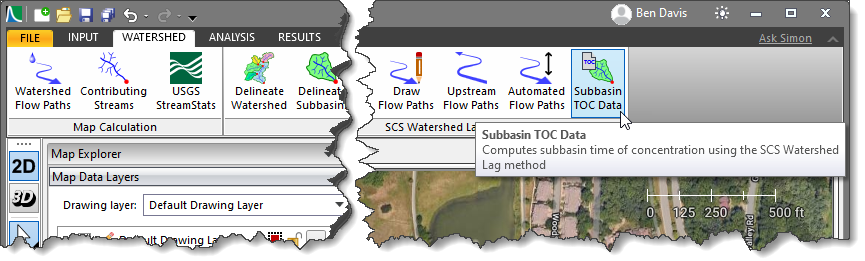
- From the Watershed ribbon menu, select the Subbasin TOC Data command.
Alternatively, from the Input ribbon menu, click the Drainage Subbasins dropdown menu and select the Subbasin TOC Data command.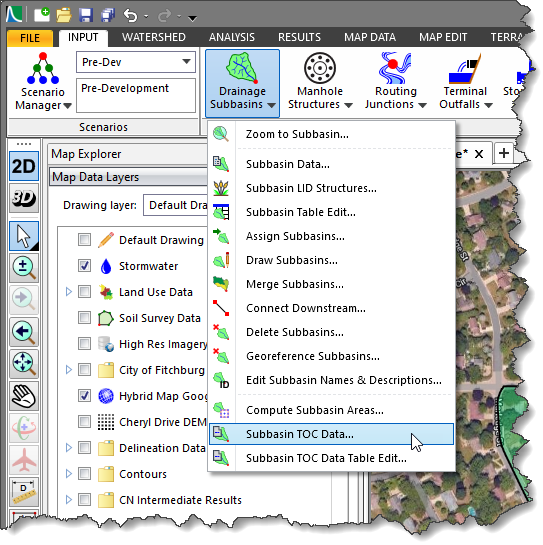
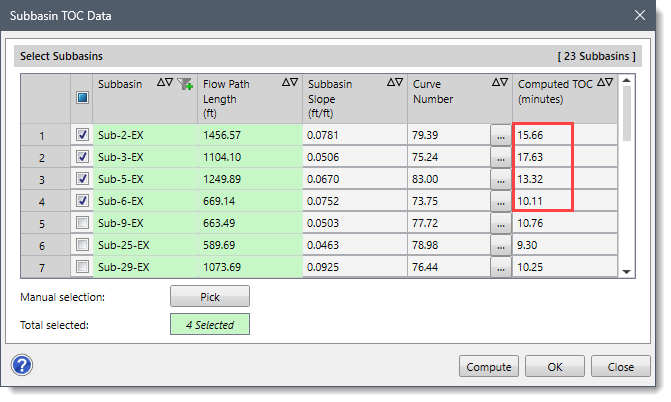
- The Subbasin TOC Data dialog box will be displayed, as shown below.
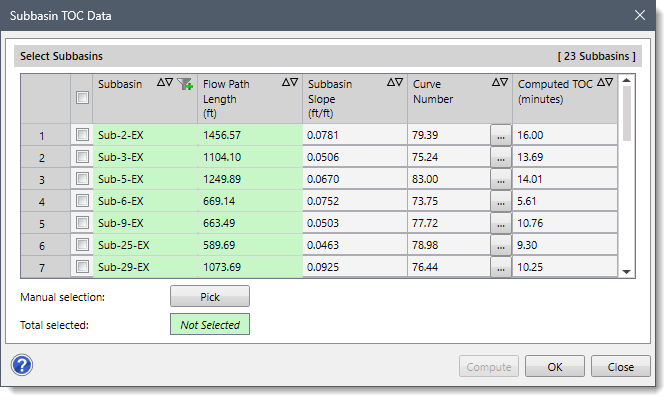
The following sections describe how to use the Subbasin TOC Data command and interact with the above dialog box.
Selecting Subbasins
The Select Subbasins section allows the user to select single or multiple subbasins defined in the current scenario to compute the time of concentration using the SCS Watershed Lag method.
The user can select the subbasin(s) using any of the following methods:
- By checking the checkboxes corresponding to each subbasin in the Select Subbasins section.
- By clicking the [Pick] button. In this selection method, the Subbasin TOC Data dialog box will temporarily disappear, and a prompt will be displayed on the status bar instructing the user to select the subbasin(s) from the Map View. After selecting the subbasin(s), press the [Enter] key or right-click and choose Done from the displayed context menu. The Subbasin TOC Data dialog box will be redisplayed.
After selecting the subbasin(s), the total number of selected subbasins will be displayed in the Total selected read-only field, as shown below.
Note that if the US unit system is selected on the Options backstage page, the US units will be displayed in the Select Subbasins section. The user can also change the unit system to a metric (SI) unit, if necessary. Refer to this article in our knowledge base to learn more about setting the model units to metric (SI) or US units.
The table in the Select Subbasins section contains the following data column entries:
- Subbasin
This read-only entry lists all subbasin IDs contained in the current scenario.
- Flow Path Length (ft)
This read-only entry lists the computed flow path lengths using the Automated Flow Paths command. To learn more about the Automated Flow Paths command, refer to this article in our knowledge base.
- Subbasin Slope (ft/ft)
This editable entry lists the computed subbasin slopes using the Compute Slopes command. To learn more about the Compute Slopes command, refer to this article in our knowledge base.
- Curve Number
This editable entry lists the computed curve numbers using the Compute CN command. Clicking the […] lookup button displays a SCS Curve Number dialog box, which allows the user to select the curve number for urban areas. To learn more about the Compute CN command, refer to this article in our knowledge base.
- Computed TOC (minutes)
This editable entry lists the computed TOC value. By default, this entry lists the TOC value defined in the Subbasin Data dialog box.
Computing TOC
Once all the data have been defined, click the [Compute] button. The software will then compute the time of concentration for the selected subbasin(s) and display the result in the Computed TOC data column entry.