BDE coefficients correspond to three parameters (B, D, and E) in the Federal Highway Administration (FHWA) intensity equation. These coefficients are empirically derived from regional rainfall data and vary according to the storm’s return period (e.g., 2-year, 10-year, 100-year storm events). BDE coefficients are used to compute rainfall intensity based on storm duration (time of concentration) and storm return period. The computed rainfall intensity is then applied to rational-based hydrology methods, such as the Rational method, Modified Rational method, and DeKalb Rational method to determine peak flow rates.
In GeoSTORM, BDE coefficients are one of the available data types for computing rainfall intensity. The software also supports the IDF Data Table and Polynomial Coefficient Table data types to compute rainfall intensity directly from published IDF curves or polynomial-based rainfall relationships. These data types ensure compatibility with a wide range of local drainage criteria and rainfall data sources. To learn more about these data types, refer to this article in our knowledge base.
BDE coefficients are defined using the following mathematical relationship between rainfall intensity, storm duration, and return period, and are typically obtained from Intensity-Duration-Frequency (IDF) curves for a specific region: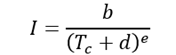
Where:
I = Rainfall intensity
Tc = Storm duration or time of concentration
b, d, e = Regional coefficients
In GeoSTORM, these coefficients are used to generate rainfall intensity–duration relationships for hydrologic computations, ensuring accurate estimation of peak flow rates.
Note: BDE coefficients vary depending on geographic location and storm return period. Many local agencies publish BDE coefficient tables in their stormwater design manuals or municipal ordinances.
For example, the City of Houston, Texas, provides the following rainfall intensity parameters:
| Storm Event | B | D | E |
|---|---|---|---|
| 2-year | 75.01 | 16.2 | 0.8315 |
| 3-year | 77.27 | 17.1 | 0.8075 |
| 5-year | 84.14 | 17.8 | 07881 |
| 10-year | 93.53 | 18.9 | 0.7742 |
| 25-year | 115.9 | 21.2 | 0.7808 |
| 100-year | 125.4 | 21.8 | 0.7500 |
Source: https://houstonrecovers.org/wp-content/uploads/2018/06/IDM-CH-9-Show-changes.pdf
Procedure for Computing Rainfall Intensity Using BDE Coefficients
Follow the steps below to calculate rainfall intensity using the FHWA intensity equation:
- Identifying BDE Coefficients
Obtain BDE coefficients corresponding to the required storm event and project location from a local stormwater design manual or municipal ordinance. Each municipality may define different coefficients based on regional rainfall characteristics.
- Applying FHWA Intensity Equation
Use the following FHWA intensity equation to compute rainfall intensity based on the time of concentration and the corresponding BDE coefficients:
- Computing Rainfall Intensity
Insert the time of concentration and BDE coefficients into the equation to compute the rainfall intensity. For example, for a 2-year storm event in the City of Houston, Texas, with the following coefficients:b = 75.01; d = 16.2; e = 0.8315; Tc = 20 minutesSubstitute these values into the FHWA intensity equation: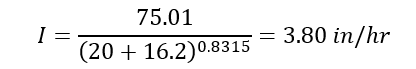
After performing the computation, the rainfall intensity of a 2-year storm event with a 20-minute time of concentration is approximately 3.80 inches per hour.
Using BDE Coefficients in Rational-Based Hydrology Methods
In GeoSTORM, all rational-based hydrology methods (Rational method, Modified Rational method, and DeKalb Rational) use the following equation for computing peak flow rate:![]()
Where:
Q = Peak flow rate
C = Runoff coefficient
I = Rainfall intensity
A = Drainage area
The difference between the rational-based hydrology methods lies in how rainfall intensity (I) is determined. The following sections explain how each method uses rainfall intensity:
Rational Method
In the Rational method, rainfall intensity is computed for a storm duration equal to the watershed’s time of concentration. This intensity value is then used directly in the equation to determine the peak flow rate. Because only one duration is evaluated, this method is simple and widely used for small urban drainage areas.
Modified Rational Method
In the Modified Rational method, the user specifies the storm duration to be analyzed. The rainfall intensity is then computed for this user-defined storm duration. This intensity value is then used directly in the equation to determine the peak flow rate. This method is well-suited for detention basin design or in situations where local design criteria require evaluation of a specific storm duration.
DeKalb Rational Method
The DeKalb Rational method uses the same rainfall intensity and peak flow computation as the standard Rational Method. However, instead of providing only a peak flow, it generates a full hydrograph using a dimensionless curve developed by DeKalb County, with the peak occurring at 5 times the TOC and a total storm duration of 10 times the TOC.
To learn more about these hydrology methods, refer to this article in our knowledge base.
Defining BDE Coefficients in GeoSTORM
In GeoSTORM, the user can define BDE coefficients using the Storm Data command to compute rainfall intensity with the FHWA intensity equation.
Follow the steps below to define BDE coefficients:
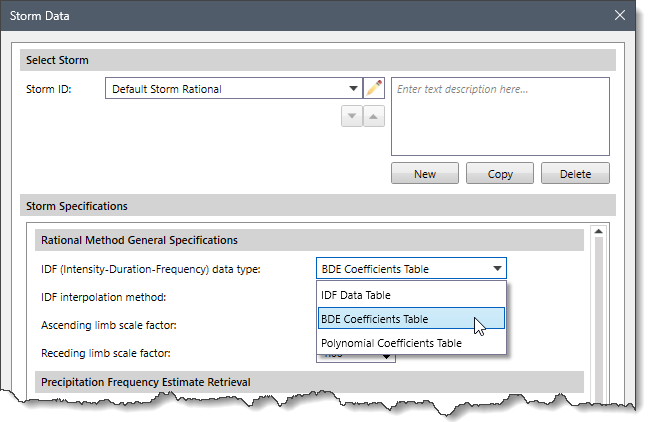
- From the Input ribbon menu, select the Storm Data command.
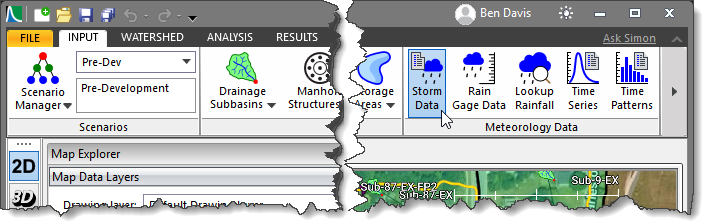
- The Storm Data dialog box will be displayed.

Note: BDE Coefficients are available only when either the Rational Method, Modified Rational, or DeKalb Rational is selected as the Hydrology analysis engine in the Scenario Manager dialog box.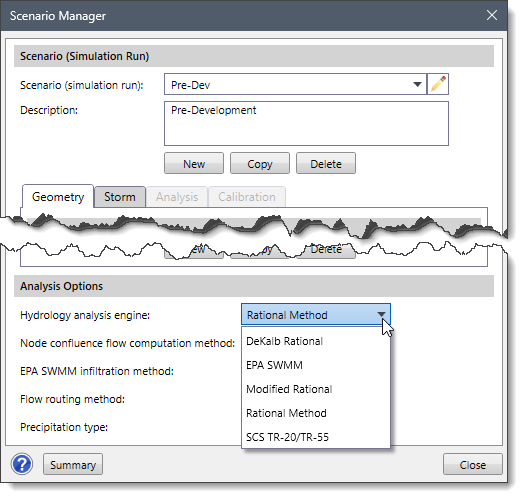
- In the IDF (Intensity-Duration-Frequency) data type dropdown combo box, select the BDE Coefficients Table option.
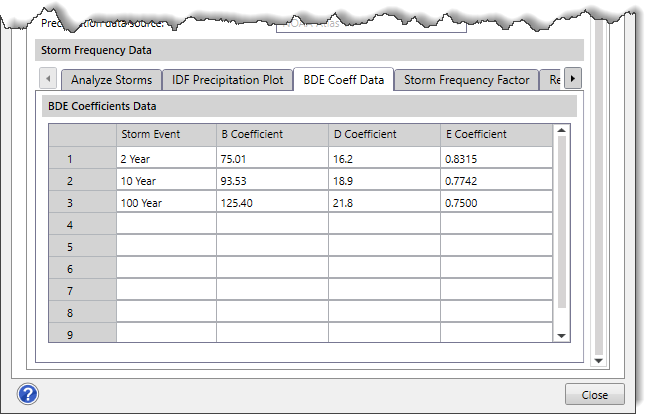
- In the Storm Frequency Data section, select the BDE Coeff Data This tab provides a BDE Coefficients Data Table where the user can enter BDE coefficients for each storm event, as shown below.
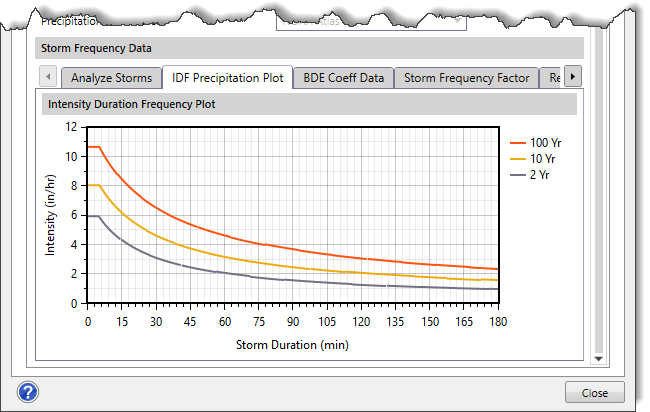
- After defining the BDE coefficients, the software automatically computes rainfall intensities based on the time of concentration and generates the corresponding IDF curve.
- To view the generated IDF curve, select the IDF Precipitation Plot tab in the Storm Frequency Data section, as shown below.
To learn more about the Storm Data command, refer to this article in our knowledge base.