
In GeoSTORM software, the Storm Data command allows the user to define the precipitation/rainfall data based upon the selected hydrology method (or hydrology analysis engine). The following hydrology methods are supported in GeoSTORM:
- Dekalb Rational Method
- EPA SWMM
- Modified Rational
- Rational Method
- SCS TR-20/TR-55
To choose the required hydrology method, select the Scenario Manager command from the Input ribbon menu. The Scenario Manager dialog box will be displayed.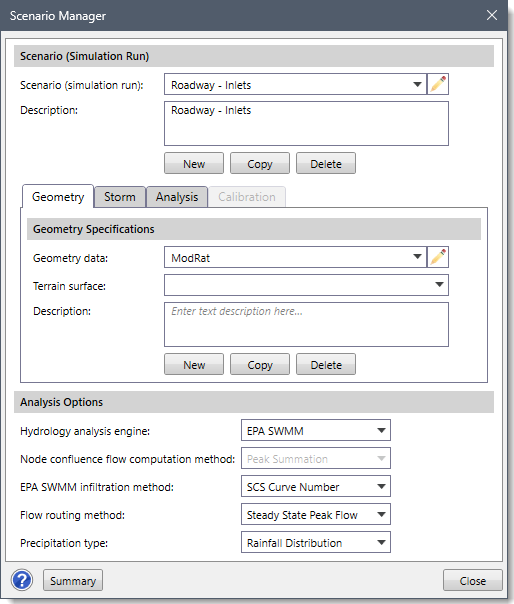
Select the required hydrology method from the Hydrology analysis engine dropdown combo box.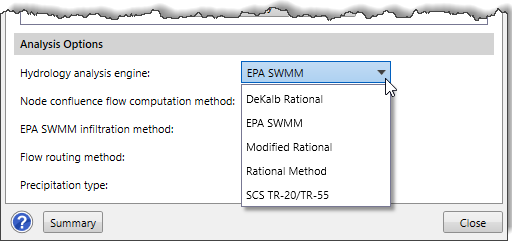
After selecting the required hydrology method, follow the steps below to define precipitation data using the Storm Data command:
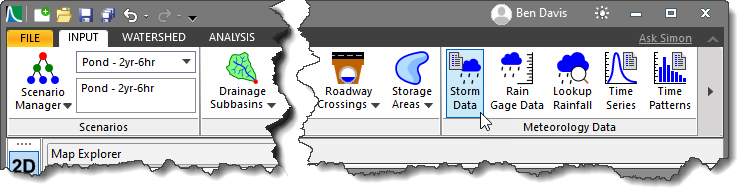
- From the Input ribbon menu, select the Storm Data command.
- The Storm Data dialog box will be displayed.
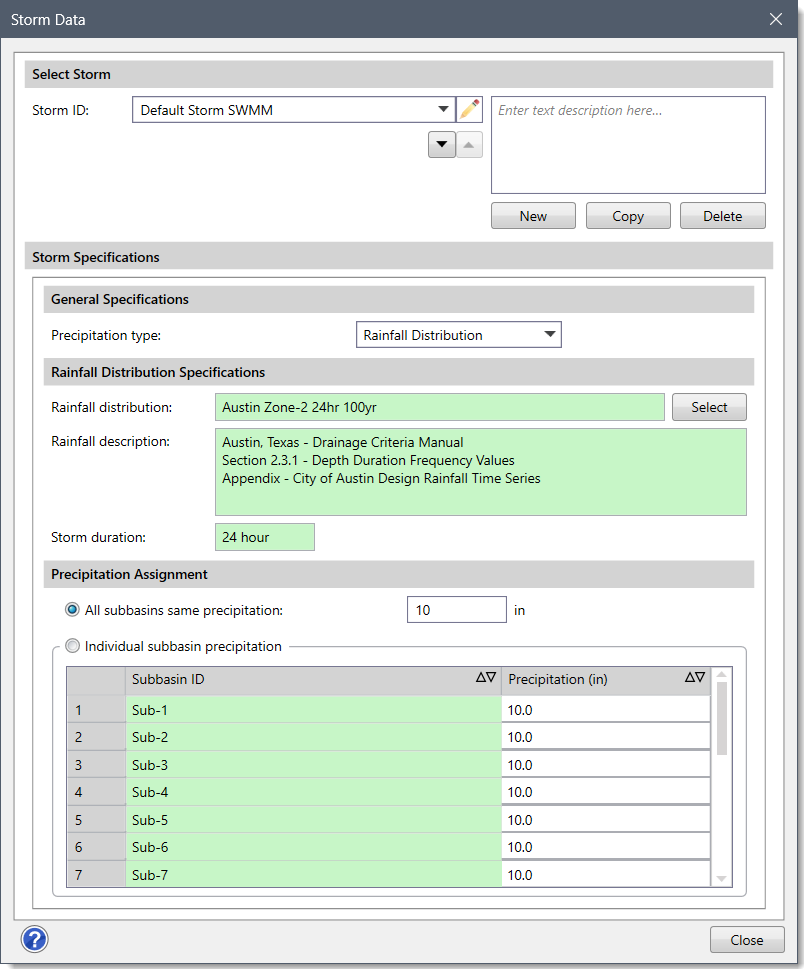
The following sections describe how to interact with the Storm Data dialog box.
Selecting Storm
The Select Storm section of the dialog box allows the user to select the storm for which storm data will be defined. This section is common for all the hydrology methods. In this section, the user can create, delete, and copy existing storm data to a new storm. In addition, the user can navigate between storms and enter a description for each storm.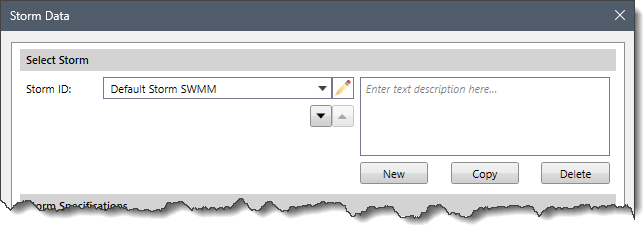
The following entries are provided in this section:
- Storm ID
This dropdown combo box lists all the storms defined in the current scenario of the project. Click on the edit option (i.e., the pencil icon) to edit the storm ID. The user can navigate between the previous and next storms using the Up and Down arrow buttons.
- Description
This optional field allows the user to enter additional information that describes the selected storm.
- New
The [New] button allows the user to create a new storm. The ID of every newly created storm must be unique.
- Copy
The [Copy] button allows the user to copy the currently selected storm along with its associated data to a new storm. The software automatically provides a unique ID to the copied storm.
- Delete
The [Delete] button allows the user to delete the currently selected storm from the current scenario.
Defining Storm Data for Selected Hydrology Method
The content of the Storm Specifications section automatically updates based on the hydrology method selected for the current scenario of the project. The following sections describe how to define storm data for different hydrology methods.
EPA SWMM Hydrology Method
Selecting EPA SWMM as the hydrology method changes the content of the Storm Specifications section, as shown below.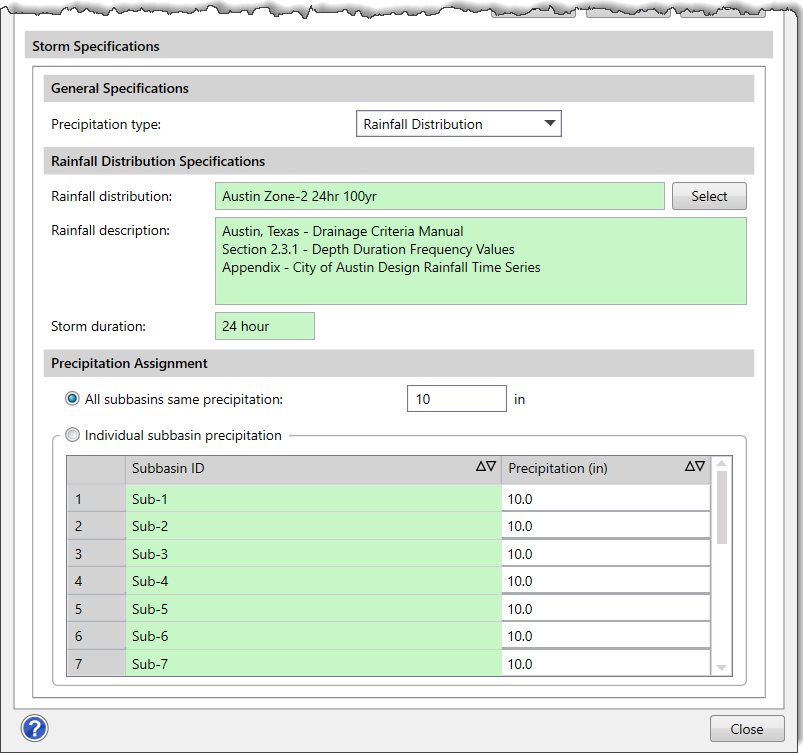
General Specifications
In this subsection, the Precipitation type dropdown combo box entry contains the following precipitation types:
- Rainfall Distribution
- Rain Gage

Note: Changing precipitation type changes the sections and their corresponding content.
Precipitation Type – Rainfall Distribution
The Rainfall Distribution precipitation type is a region-based temporal rainfall distribution of different areas. When Rainfall Distribution is selected as the precipitation type, the content of the Storm Specifications section changes, as shown below. Refer to this article in our knowledge base to learn how the rainfall distribution data is defined for the storm data.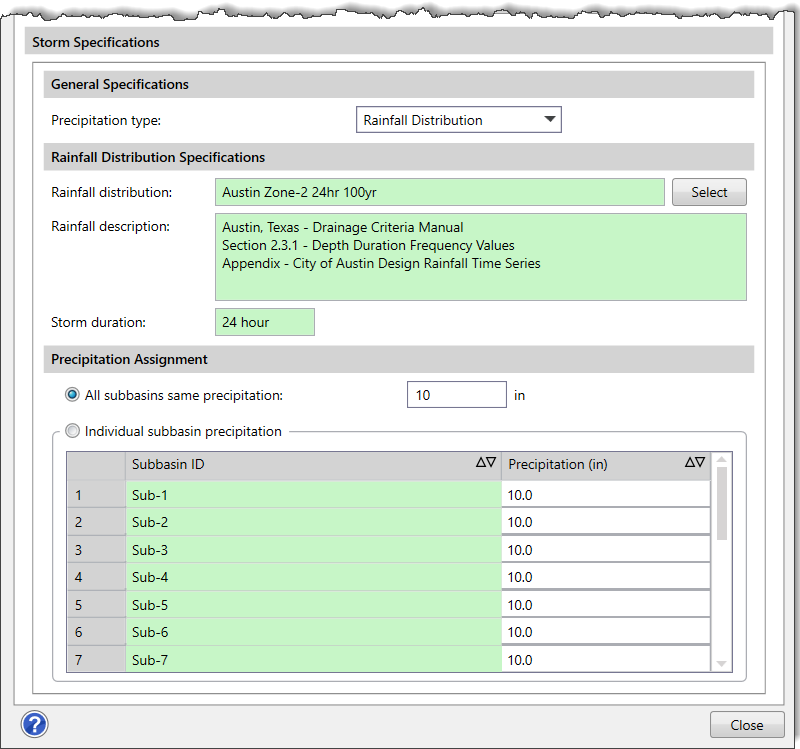
Precipitation Type – Rain Gage
The Rain Gage precipitation type is designed to work with time series recording and single-value recording precipitation gages. When Rain Gage is selected as the precipitation type, the content of the Storm Specifications section changes, as shown below.
Rain Gage Assignment
The following input parameters are available in this subsection:
- All subbasins same rain gage
This radio button dropdown combo box option allows the user to assign the same rain gage ID to all the subbasins present within the model.
- Individual subbasin rain gage
This radio button allows the user to specifically assign the rain gage ID for all the individual subbasins present within the model.
Modified Rational Hydrology Method
Selecting Modified Rational as the hydrology method changes the contents of the Storm Specifications section, as shown below.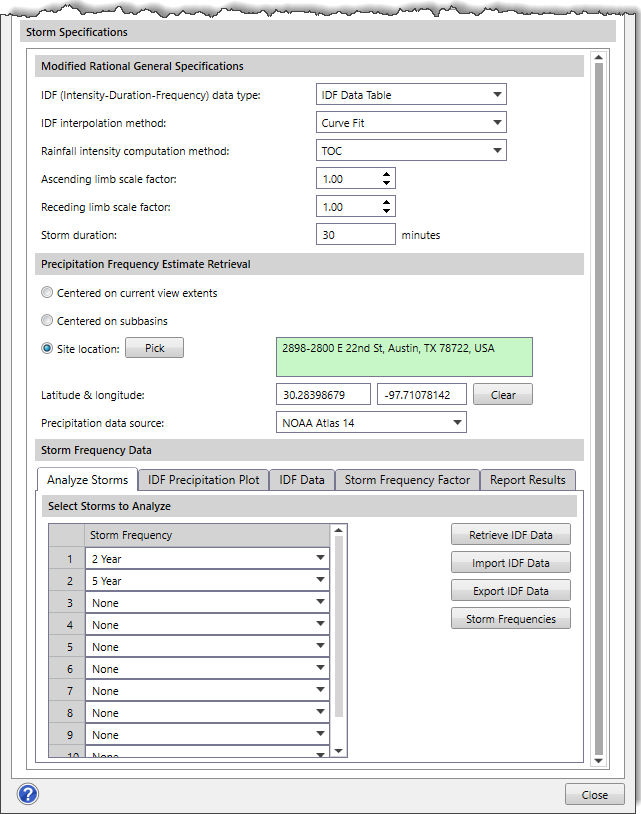
Modified Rational General Specifications

This subsection contains the following options:
- IDF (Intensity-Duration-Frequency) data type
This dropdown combo box entry defines how the IDF (Intensity-Duration-Frequency) data are defined.
The following dropdown entries are provided:
IDF Type Description IDF Data Table Rainfall intensity data (I, inches, or mm) are defined by a table of storm durations (D, in minutes) versus return periods (F, in years). This is the most commonly used option. BDE Coefficients Table Rainfall intensity data (inches or mm) are defined by a table of B-D-E coefficients versus return periods (in years) using the FWHA intensity equation. Polynomial Coefficients Table Rainfall intensity data (inches or mm) are defined by a table of third-degree polynomial coefficients A, B, C, and D versus return periods (in years).
- IDF interpolation method
This dropdown combo box entry defines the IDF interpolation method to be used by the software to interpolate between IDF intensity values and determine the storm intensity of any intermediate duration. Note that this dropdown combo box entry will only be enabled if IDF Data Table is selected from the IDF (Intensity-Duration-Frequency) data type dropdown combo box.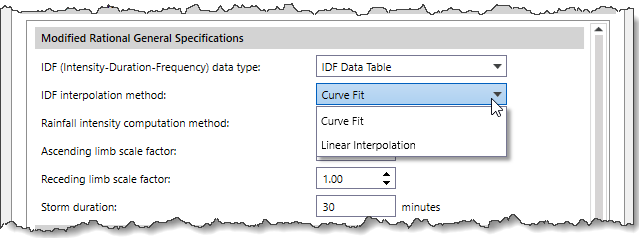
The following dropdown entries are provided:
- Curve Fit: Selecting this method will cause the software to use a curve fit interpolation approach between the IDF intensity values to determine the storm intensity of any intermediate duration.
- Linear Interpolation: Selecting this method will cause the software to use a linear interpolation approach between the IDF intensity values and determine the storm intensity of any intermediate duration.
- Rainfall intensity computation method
This dropdown combo box entry defines the computation method to be used for determining the rainfall intensity, which will be further used to determine the peak flow.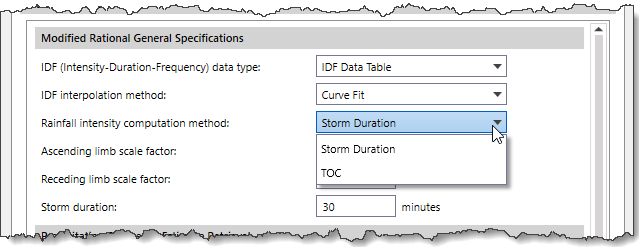
The following dropdown entries are provided:
- Storm Duration: Selecting this method will cause the software to use the value defined in the Storm Duration entry to determine the rainfall intensity.
- TOC: Selecting this method will cause the software to use the time of concentration of each subbasin to determine rainfall intensity.
- Ascending limb scale factor
This entry stretches (or shortens) the ascending limb of the computed triangular Rational Method and Modified Rational hydrograph.
- Receding limb scale factor
This entry stretches (or shortens) the receding limb of the computed Rational Method triangular hydrograph.
- Storm duration
This entry field specifies the Modified Rational storm duration. This value is required and is generally at least two times the maximum time of concentration (TOC) determined for the contributing subbasins.
Precipitation Frequency Estimate Retrieval
This subsection allows the user to define the storm data retrieval location. Note that this subsection is enabled only if the user has selected the IDF Data Table in the IDF (Intensity-Duration-Frequency) data type dropdown combo box entry. Otherwise, the contents of this subsection will be displayed as disabled.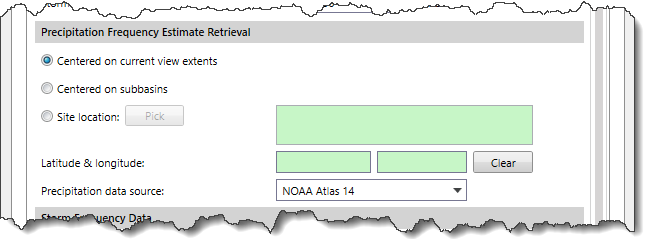
This subsection contains the following options:
- Centered on current view extents
This radio button option enables the software to pick the center of the current view extent of the Map View.
- Centered on subbasins
This radio button option enables the software to calculate and pick the center of the current subbasins present on the Map View.
- Site location
Selecting this radio button option enables the [Pick] button. Further clicking the [Pick] button allows the user to select the location on the Map View for which precipitation data are to be retrieved. After selecting the site location, the Latitude and Longitude are automatically filled in the corresponding entry fields, as shown below. Clicking the [Clear] button clears the selected site location.
Note: The coordinate values entered have the same coordinate reference system (CRS) as the project.
- Precipitation data source
This dropdown combo box lists the precipitation data sources that are available for the selected location.
Storm Frequency Data
This subsection allows the user to define storm frequency data. The following panels are available in this subsection:
Analyze Storms
This panel allows the user to define storm frequencies that should be analyzed for the current scenario.
The following options are provided in this panel:
- Storm Frequency
In the Select Storms to Analyze subsection, the data table contains different storm frequency dropdown entries that are analyzed. When the user selects a specific storm frequency, then the same storm frequency will not be available for other dropdown entries. In that way, the user only sees those storm frequencies that have not yet been selected.For example, if the user selects “1 Year” and “2 Year” as storm frequencies, they will not be available for all other remaining dropdown entries.
- Retrieve IDF Data
If a cloud data source (i.e., Canada, Germany, NOAA Atlas 14, NRCC PFDS, etc.) is selected in the Precipitation data source dropdown entry, then clicking on the [Retrieve IDF Data] button will retrieve and populate the IDF data into the IDF Data panel.![[Retrieve IDF Data] button](https://knowledge.civilgeo.com/wp-content/uploads/2025/12/Storm-Data-Command-Image-19.png)
In addition, the corresponding IDF curves in the IDF Precipitation Plot panel will be displayed.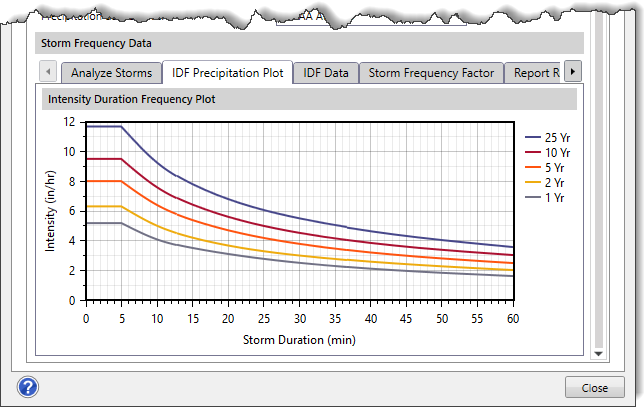
Notes:
The [Retrieve IDF Data] button is only enabled if:
- The user has selected the IDF Data Table in the IDF (Intensity-Duration-Frequency) data type dropdown combo box entry.
- The User-Defined option is not selected in the Precipitation data source entry.
- Import IDF Data
Clicking the [Import IDF Data] button displays the Import IDF Data dialog box, which allows the user to import IDF data from an external ASCII text file in different formats (e.g., *.idf, *.txt, *.hci, *.csv, and *.asc). The user can select the file to be imported and click the [Open] button to import IDF data.![[Import IDF Data] button](https://knowledge.civilgeo.com/wp-content/uploads/2025/12/Storm-Data-Command-Image-21.png)
- Export IDF Data
Clicking the [Export IDF Data] button displays the Export IDF Data dialog box, which allows the user to export the data locally for use on subsequent projects. The user can add the file name and click on the [Save] button to export IDF data.
- Storm Frequencies
Clicking the [Storm Frequencies] button displays the Storm Frequencies dialog box.
The user can manage custom storm frequencies using this dialog box. Clicking the [Add] button adds a custom storm frequency entry at the bottom of the Storm Frequency column. The added custom frequency entry will be displayed as a dropdown combo box entry in the data table under the Select Storms to Analyze subsection.
Note: The user needs to check the checkbox(s) corresponding to the storm frequencies under the Utilize? column to display them as a dropdown combo box entry in the data table under the Select Storms to Analyze subsection.Click the [Delete] button to remove the selected storm frequency. Note that the user can only delete the custom storm frequencies.
IDF Precipitation Plot
This panel allows the user to plot the IDF curves for the defined/retrieved rainfall intensity data.
IDF Data
This panel allows the user to store the retrieved (or user-defined) rainfall intensity data in a data grid.
Note: This panel is only displayed if the user has selected the IDF Data Table in the IDF (Intensity-Duration-Frequency) data type dropdown combo box entry. Otherwise, this panel is hidden.
BDE Coeff Data
This panel allows the user to store the user-defined B-D-E coefficients in a data grid for computing the rainfall intensity data using the FHWA intensity equation.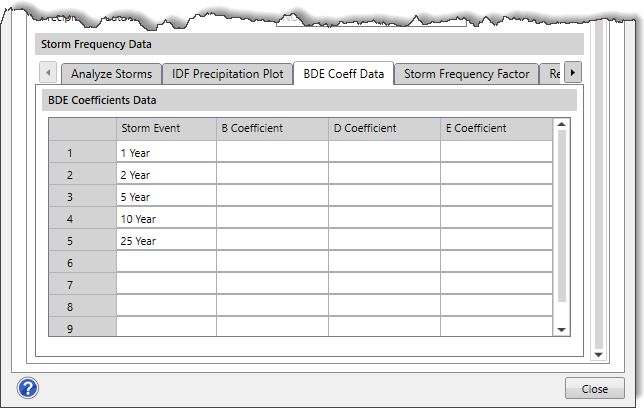
Note: This panel is only displayed if the user has selected the BDE Coefficients Table in the IDF (Intensity-Duration-Frequency) data type dropdown combo box entry. Otherwise, this panel is hidden.
Poly Coeff Data
This panel allows the user to store the user-defined third-order polynomial coefficients in a data grid for computing the rainfall intensity data using the polynomial equation.
Note: This panel is only displayed if the user has selected the Polynomial Coefficients Table in the IDF (Intensity-Duration-Frequency) data type dropdown combo box entry. Otherwise, this panel is hidden.
Storm Frequency Factor
This panel allows the user to store the storm frequency factor (sometimes called a frequency coefficient, frequency correction factor, or climate change factor) data. This data provides an optional calculation adjustment multiplier to increase the runoff coefficient C of the subbasins.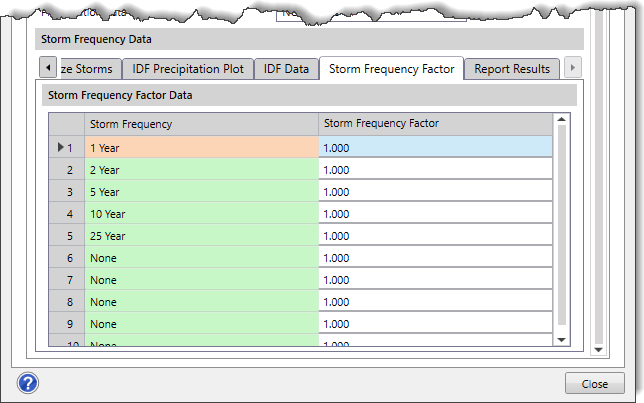
Less frequent, higher-intensity storms require the use of higher runoff coefficients because infiltration and other losses have a proportionally smaller effect on runoff. Therefore, the adjustment for major storms when using the Modified Rational, Rational Method can be made by multiplying the runoff coefficient by the frequency factor.
Report Results
This panel allows the user to select the storm for which the results are to be displayed at the application level. The user can select the specific storm whose results are to be displayed using the Report results for storm dropdown combo box under the Select Storm to Report Results subsection.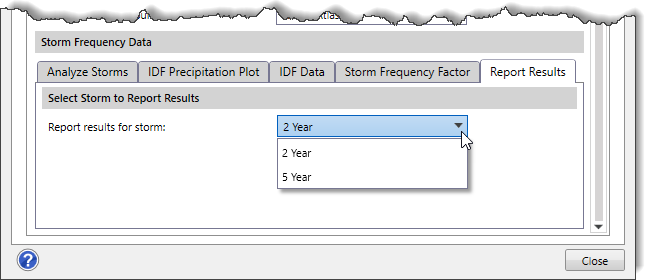
Note: The Report results for storm dropdown combo box list only those entries that are displayed as a dropdown combo box entry in the data table under the Analyze Storms panel.
Rational Hydrology Method
Selecting Rational Method as the hydrology method changes the contents of the Storm Specifications section, as shown below.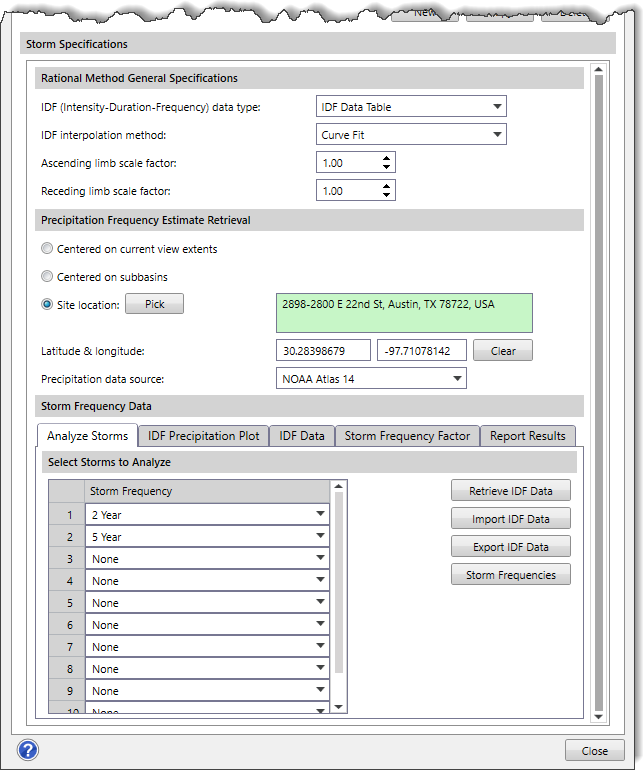
Note: The Storm Data dialog box for the Rational Method hydrology method is nearly identical to the dialog box displayed for the Modified Rational hydrology method, except for the Storm duration entry, which is unavailable here.
SCS TR-20/TR-55 Hydrology Method
Selecting SCS TR-20/TR-55 as the hydrology method changes the contents of the Storm Specifications section, as shown below.
General Specifications
In this subsection, the Precipitation type dropdown combo box entry contains the following precipitation types:
- None
- HMR52 Storm
- Rainfall Distribution
- SCS Storm

Note: Changing precipitation type changes the sections and their corresponding content.
Precipitation Type – None
When None is selected from the Precipitation type dropdown combo box entry, the entire content below this entry will become unavailable.
Precipitation Type – HMR52 Storm
The HMR52 Storm precipitation type is used to compute the probable maximum precipitation (PMP) for a watershed. Concentric ellipses are used to construct the storm spatial pattern, where each ellipse represents an isohyet of precipitation depth. The storm is located over the watershed by specifying the center of the pattern and the angle of the major axis of the ellipses. Total precipitation depth is computed using a specified storm area and area-duration curves.
The total precipitation depth is converted to a temporal pattern based on the selected placement of the peak intensity within the storm duration. The HMR52 storm precipitation type includes several parameters to describe the location, orientation, and temporal distribution of the storm.
HMR52 PMP Storm Specifications
This subsection allows the user to define the HMR52 PMP storm specifications data.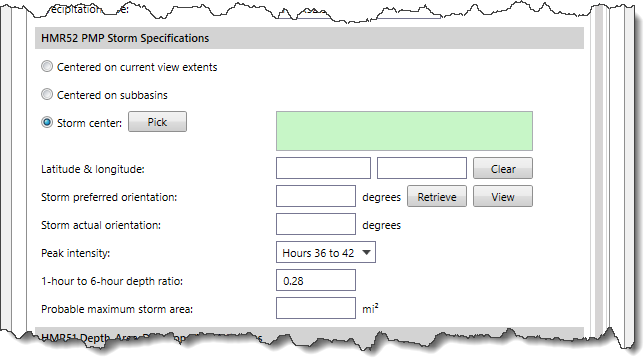
The following options are available in this subsection:
- Centered on current view extents
This radio button option enables the software to pick the center of the current view extent of the Map View.
- Centered on subbasins
This radio button option enables the software to calculate and pick the center of the current subbasins present on the Map View.
- Storm Center
Selecting this radio button option enables the [Pick] button. Further clicking the [Pick] button allows the user to select the storm center on the Map View. The Latitude and Longitude of the selected location get automatically filled after the selection of the storm center. The entered coordinate value will have the same coordinate reference system (CRS) as the project. Clicking the [Clear] button clears the selected storm location.
- Storm preferred orientation & Storm actual orientation
The preferred and actual storm orientation angles are measured in degrees, increasing clockwise from North. Clicking the [Retrieve] button retrieves the storm preferred orientation for the selected location, as shown below.
Clicking the [View] button displays the HMR52 Storm Preferred Orientation dialog box to view the storm preferred orientation data, as shown below.
- Peak Intensity
This dropdown combo box entry is used to select the 6-hour peak intensity for the HMR52 storm. This peak intensity parameter specifies the period within the 72-hour storm when the precipitation will be the greatest. The 6 hours of peak intensity can be set to begin as early as hour 24 of the storm or as late as hour 60 of the storm. The depth of rain falling during the period of peak intensity is subdivided into 1-hour increments using the 1-hour to 6-hour depth ratio parameter.
- 1-hour to 6-hour depth ratio
This entry field displays the ratio of the 1-hour to 6-hour depth during the 6-hour peak intensity period. The depth of rain falling during the period of peak intensity is subdivided into 1-hour increments using this parameter.
- Probable maximum storm area
This field specifies the total storm area.
HMR51 Depth-Area-Duration PMP Estimates
The table under this subsection allows the user to enter the precipitation depths from the HMR51 PMP (Probable Maximum Precipitation) data corresponding to different storm sizes and storm durations.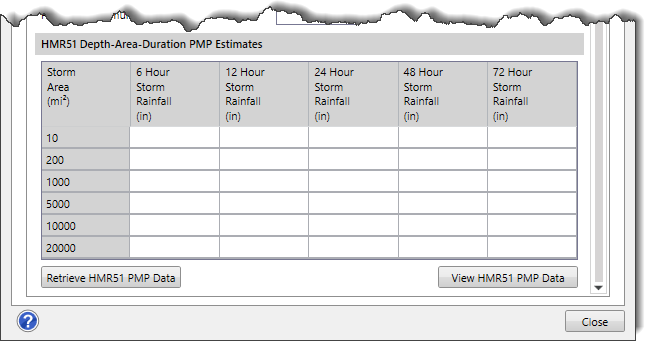
Clicking the [Retrieve HMR51 PMP Data] button enables the software to interpolate the values for the HMR51 Depth-Area-Duration PMP Estimates table, as shown below.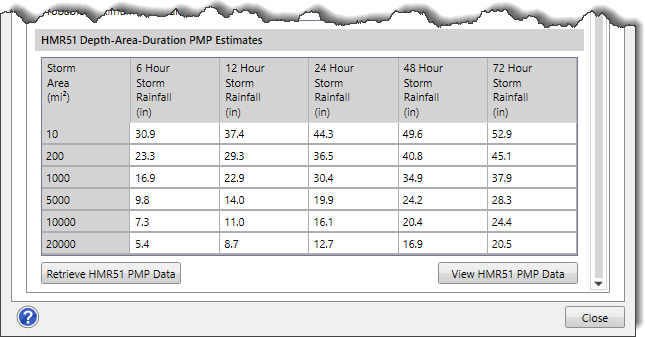
Clicking the [View HMR51 PMP Data] button displays the HMR51 PMP Data dialog box that displays the graphical plots of the HMR51 PMP rainfall data, as shown below.
Precipitation Type – Rainfall Distribution
When Rainfall Distribution is selected as the precipitation type, the contents of the Storm Specifications section changes, as shown below.
Note: This data panel is identical to the Rainfall Distribution data panel displayed for the EPA SWMM hydrology method.
Precipitation Type – SCS Storm
Drainage planning in the United States is often performed using hypothetical storms developed by the Soil Conservation Service (SCS), now known as the Natural Resources Conservation Service (NRCS). These storms were developed by the SCS as averages of rainfall patterns; they are represented in a dimensionless form. The SCS designed this storm method for a small drainage area. This precipitation type is designed to estimate both peak flow rate and runoff volume from precipitation of a “critical” duration.
Precipitation Frequency Estimate Retrieval
This subsection allows the user to select the location for which the storm data is to be retrieved.
Note: This subsection is nearly identical to the Precipitation Frequency Estimate Retrieval subsection for the Modified Rational hydrology method. However, the above section displayed for the SCS Storm precipitation type contains the following additional entries:
- Storm recurrence interval
This dropdown combo box allows the user to select a storm recurrence interval.
- Storm duration
This dropdown combo box entry allows the user to define the duration of the storm.
- Retrieve Data
This button allows the user to retrieve the rainfall data for the selected precipitation data source. The [Retrieve Data] button is enabled when the user selects a site location. Otherwise, this button is displayed as disabled.
SCS Precipitation Data
This subsection allows the user to define the SCS precipitation data.
The following options are available in this subsection:
- SCS storm distribution
This dropdown combo box entry allows the user to select the SCS storm distribution. The following options are available within this dropdown combo box:
- Area-Dependent
- Type I
- Type IA
- Type II
- Type III

- Rainfall Depth
This entry field allows the user to define the rainfall depth from NOAA Atlas 14. Clicking the […] button displays the NOAA rainfall data web page for the current map location.
Note: This button is disabled for precipitation data sources other than NOAA Atlas 14.
DeKalb Rational Hydrology Method
Selecting Dekalb Rational as the hydrology method changes the contents of the Storm Specifications section, as shown below.
Note: The contents under the Storm Specifications section for the DeKalb Rational hydrology method is identical to the Rational Method hydrology method.