
The Soil Survey Data Download command allows the user to download hydrologic soil groups as shapefile data. To learn how to display the hydrologic soil groups on the Map View for different regions, refer to this article in our knowledge base.
Follow the steps below to use the Soil Survey Data Download command:
- From the Map Data ribbon menu, click the Soil Maps dropdown menu and then choose the Soil Survey Data Download command.

- The Soil Survey Data Download dialog box will be displayed.
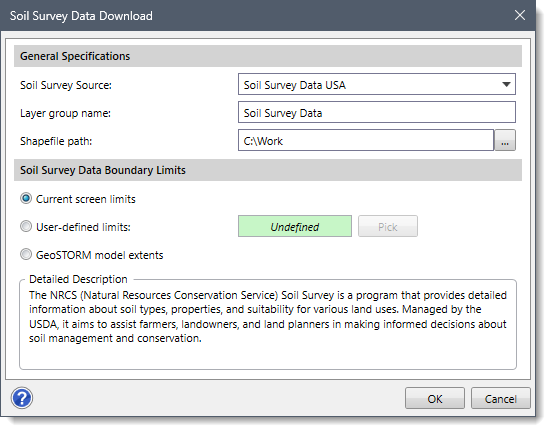
The following sections describe how to use the Soil Survey Data Download command and interact with the above dialog box.
General Specifications
This section allows the user to define the general specifications for the soil survey data.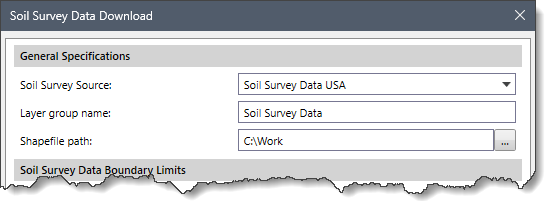
The following options are available in the General Specifications section:
- Soil Survey Source
This dropdown combo box allows the user to select the source of the soil survey data to download. The dropdown combo box contains the following entries:
- Soil Survey Data Africa
- Soil Survey Data Canada
- Soil Survey Data Ontario
- Soil Survey Data USA

- Layer group name
This entry field defines the name of the layer group that will be created in the Map Data Layers panel. The default layer group name is Soil Survey Data, which is editable.
- Shapefile path
This entry field defines the file path and name of the shapefile to save the downloaded hydrological soil data. Click the […] browse button to select the directory location and shapefile name.
Soil Survey Data Boundary Limits
This section allows the user to define the boundary limits for downloading soil survey data. In addition, a detailed description of the selected soil survey source is also displayed in the Detailed Description pane.
The following options are available in the Soil Survey data Boundary Limits section:
- Current screen limits
When this option is selected, the software will use the Map View screen display as a boundary limit.
- User-defined limits
When this option is selected, the user can draw a rectangle on the Map View representing user-defined limits for the soil survey data to be downloaded. Click the [Pick] button to define the soil survey data limits. The Soil Survey Data Download dialog box will temporarily disappear, and a prompt will be displayed on the status bar instructing the user to draw a rectangular region on the Map View. Click and drag a rectangular region to define the limits. After releasing the mouse, the user will be returned to the Soil Survey Data Download dialog box. A layer will be created with a rectangular box to represent the user-defined selected region.
- Model extents
When this option is selected, the software will create a rectangular bounding region matching the extents of the defined model, along with an additional buffer boundary
Downloading Soil Survey Data
After all the options have been defined, click the [OK] button. The software then downloads the hydrologic soil group data as a shapefile to the selected location and displays the soil survey data on the Map View. Note that the maximum downloading area of the Soil Survey Data Download command is 5000 sq. km.
An example of NRCS soil survey data is shown below.
In the Map Data Layers panel, the software provides a data legend for each hydrologic soil group layer that lists the soil survey data included within that layer. The user can expand the layer to view the data legend.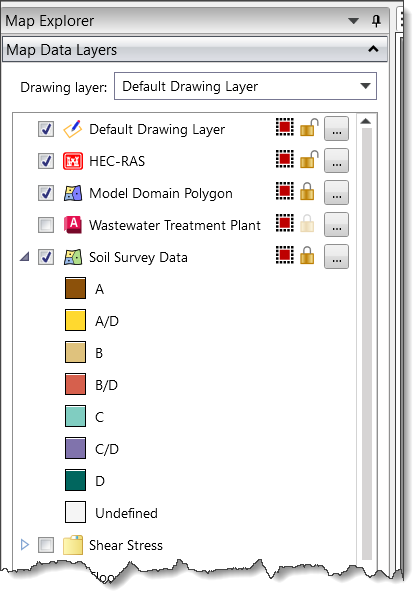
Clicking the […] button adjacent to the soil survey data layer will display the GIS Polygon Properties dialog box, which allows the user to:
- define various soil survey data and their associated properties
- define the color scheme for the color ramp
- style the border associated with the soil survey data polygon(s)
- change the image’s transparency
- change the current CRS (coordinate reference system) of the project, etc.
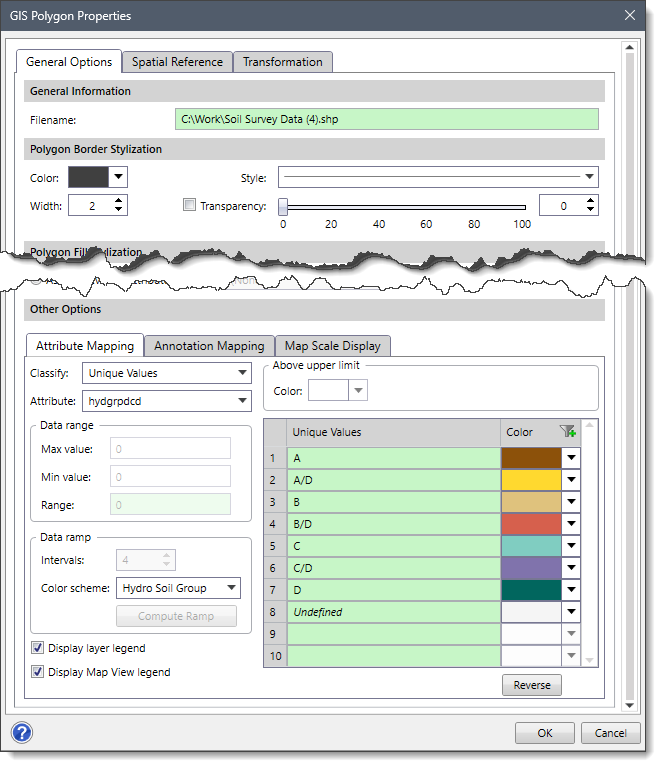
Refer to this article in our knowledge base to learn more about the GIS Polygon Properties dialog box.