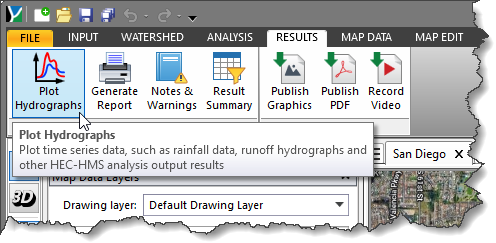
The Plot Hydrographs command allows the user to plot time series data such as rainfall data, runoff hydrographs, and other stormwater analysis output results for any location in the drainage network. In addition, the hydrographs can be copied to the Windows clipboard and printed for later use.
Follow the steps below to use the Plot Hydrographs command:
- From the Results ribbon menu, select the Plot Hydrographs command.
- The Plot Hydrographs dialog box will be displayed.
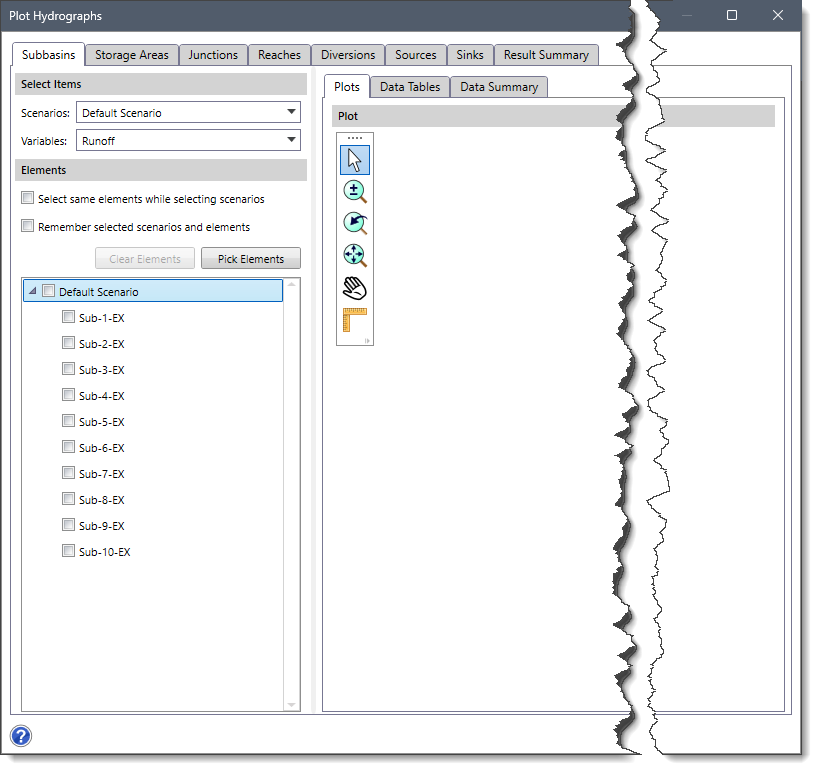
The following sections describe how to use the Plot Hydrographs command and interact with the above dialog box.
Displaying Hydrograph Plot for Subbasins
The Subbasins panel displays the output results for subbasins present in the project.
The Scenarios dropdown combo box of the Select Items section allows the user to select the preferred scenario associated with an element type.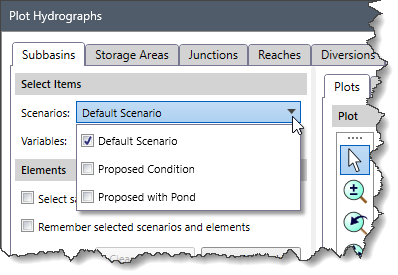
The Variables dropdown combo box of the Select Items section allows the user to select the desired output variables associated with subbasins whose results are to be displayed. For subbasins, the output results of variables such as baseflow, runoff, direct runoff, cumulative excess precipitation, cumulative precipitation, cumulative precipitation loss, excess precipitation, precipitation, precipitation loss, soil infiltration, etc. can be plotted.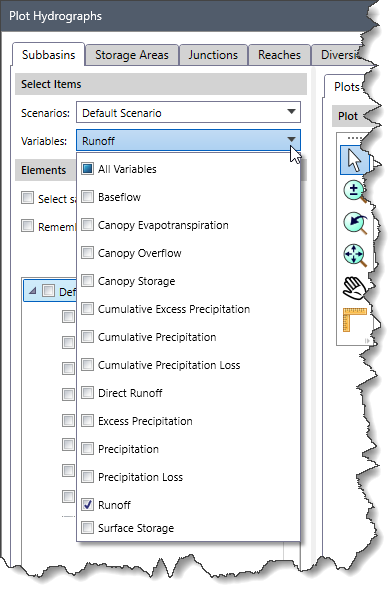
All elements (corresponding to the element type) present in the selected scenario will be displayed under the Elements section. The user can check the checkboxes corresponding to the preferred element(s) to see output results associated with them.
The Select same elements while selecting scenarios checkbox option in the Elements section allows the software to retain selected elements when adding or switching scenarios. This eliminates the need to manually reselect elements each time a new scenario is selected. By default, this checkbox option is unchecked.
The Remember selected elements and scenarios checkbox option in the Elements section allows the software to retain selected elements and scenarios when reopening the Plot Hydrographs dialog box. By default, this checkbox option is unchecked.
Alternatively, the user can click the [Pick Elements] button to select element(s) from the Map View. Clicking the [Pick Elements] button will cause the Plot Hydrographs dialog box to temporarily disappear, allowing the user to select elements from the Map View. Upon returning to the Plot Hydrographs dialog box, the output results related to the selected element(s) will be displayed under the Plots, Data Tables, and Data Summary panels. By default, the dialog box opens in the plotting view.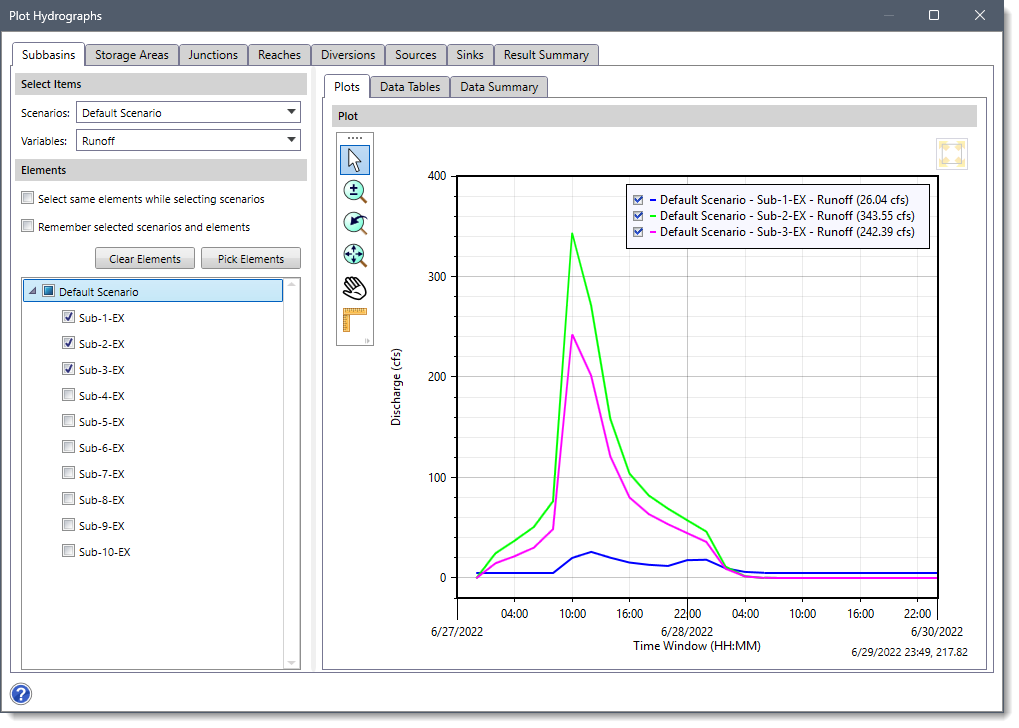
The user can click the [Clear Elements] button to deselect the currently selected elements and redo the entire process.
Displaying Hydrograph Plot for Storage Areas
The Storage Areas panel displays the output results for the storage areas present in the project. Similar to the display of hydrograph plots for subbasins, the user can select the preferred scenario from the Scenarios dropdown combo box and output variables such as inflow, outflow, storage, stage, pool elevation, and reservoir area from the Variables dropdown combo box of the Select Items section. The software will then display the output results for the element(s) selected in the Elements section under the Plots, Data Tables, and Data Summary panels.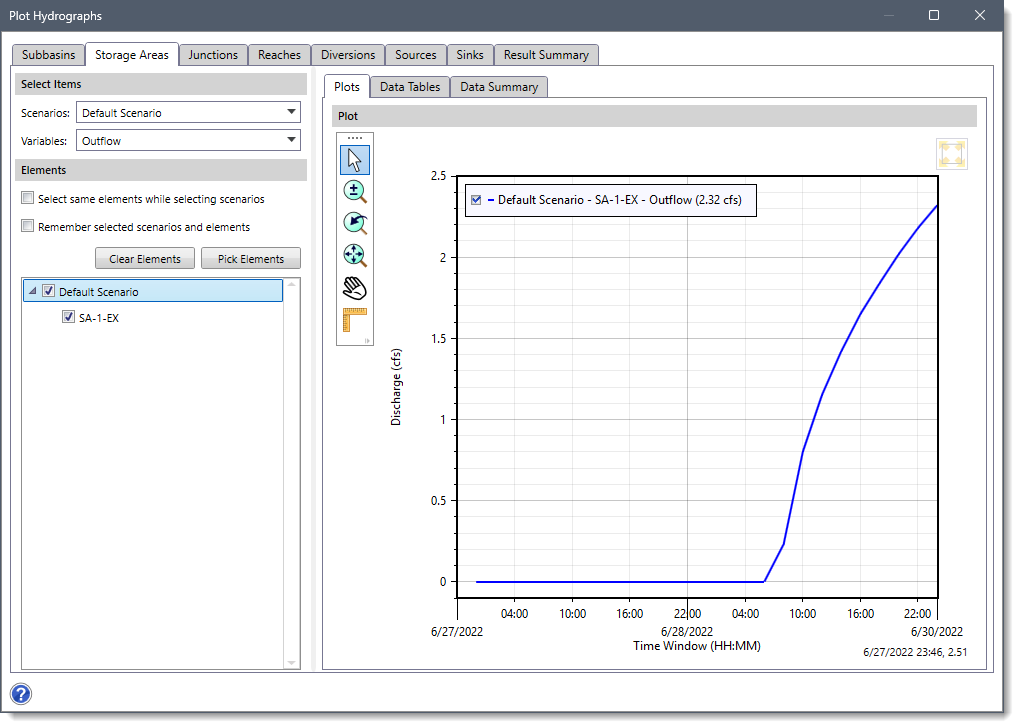
Displaying Hydrograph Plot for Junctions
The Junctions panel displays the output results for the junctions present in the project. Similar to the display of hydrograph plots for subbasins, the user can select the preferred scenario from the Scenarios dropdown combo box and output variables such as inflow and outflow from the Variables dropdown combo box of the Select Items section. The software will then display the output results for the element(s) selected in the Elements section under the Plots, Data Tables, and Data Summary panels.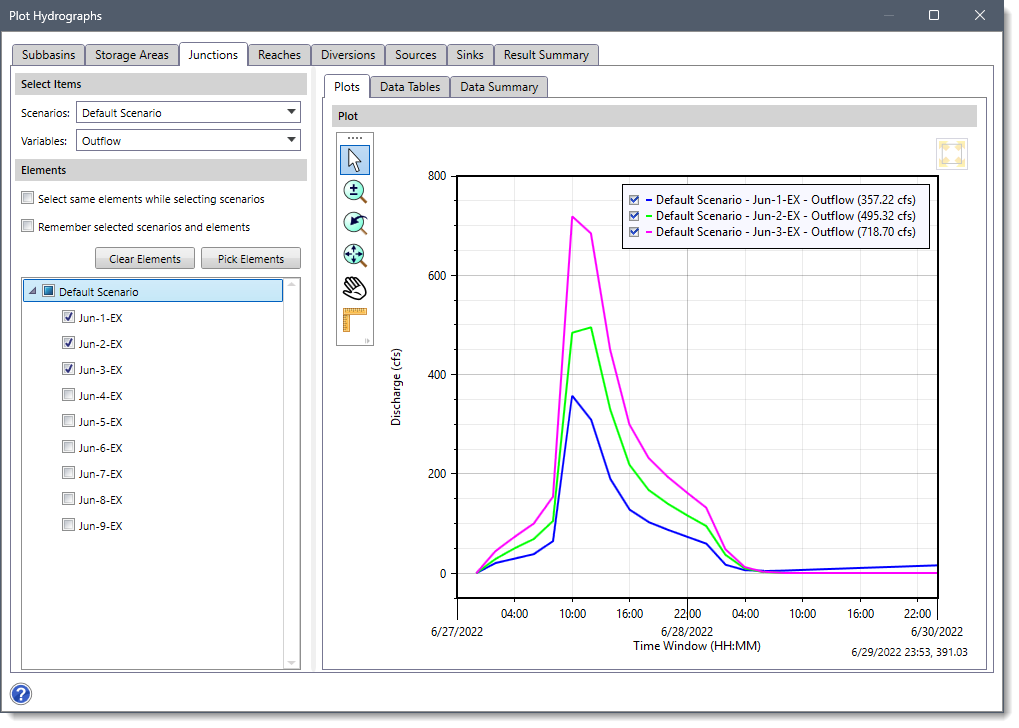
Displaying Hydrograph Plot for Reaches
The Reaches panel displays the output results for the reaches present in the project. Similar to the display of hydrograph plots for subbasins, the user can select the preferred scenario from the Scenarios dropdown combo box and output variables such as combined inflow and outflow from the Variables dropdown combo box of the Select Items section. The software will then display the output results for the element(s) selected in the Elements section under the Plots, Data Tables, and Data Summary panels.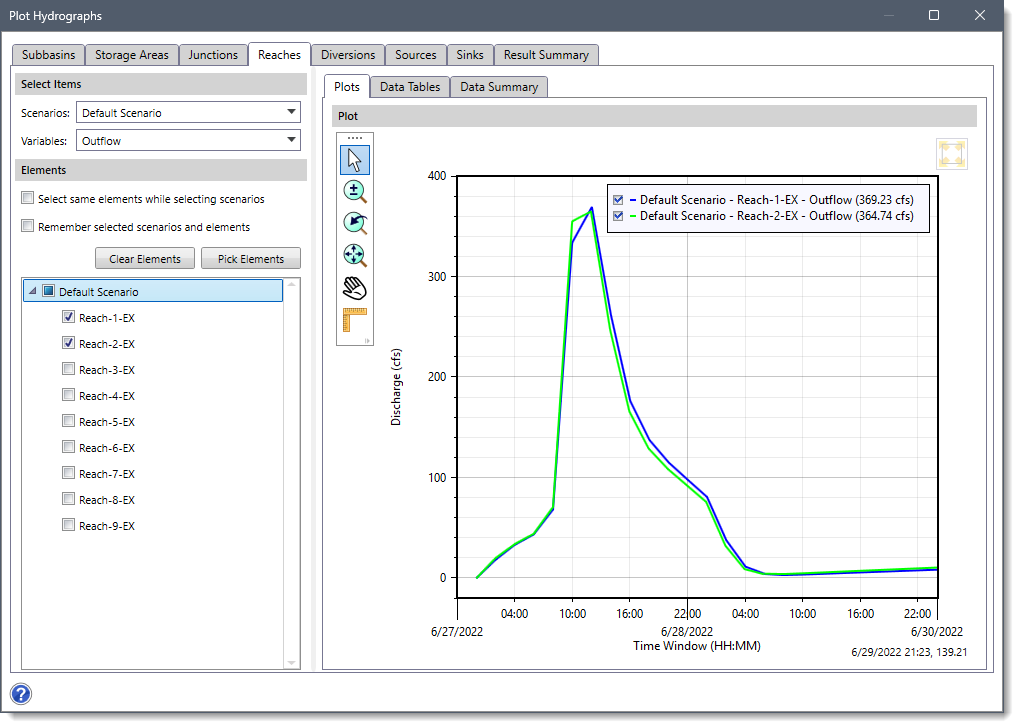
Displaying Hydrograph Plot for Diversions
The Diversions panel displays the output results for the diversions present in the project. Similar to the display of hydrograph plots for subbasins, the user can select the preferred scenario from the Scenarios dropdown combo box and output variables such as diverted flow, inflow, and outflow from the Variables dropdown combo box of the Select Items section. The software will then display the output results for the element(s) selected in the Elements section under the Plots, Data Tables, and Data Summary panels.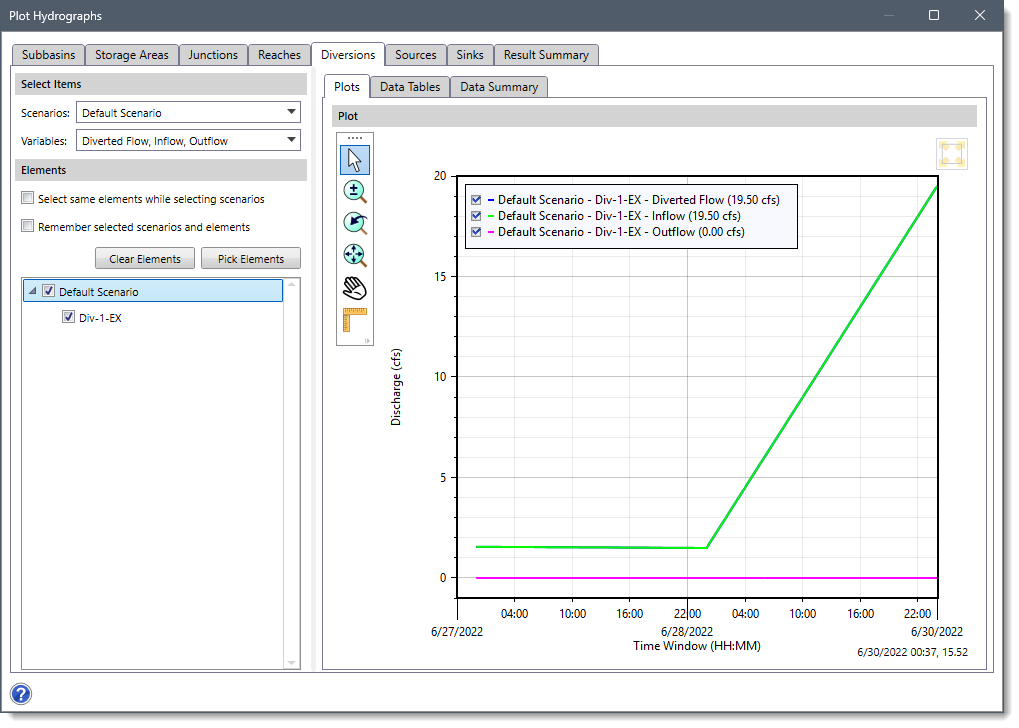
Displaying Hydrograph Plot for Sources
The Sources panel displays the output results for the sources present in the project. Similar to the display of hydrograph plots for subbasins, the user can select the preferred scenario in the Scenarios dropdown combo box and output variables such as outflow from the Variables dropdown combo box of the Select Items section. The software will then display the output results for the element(s) selected in the Elements section under the Plots, Data Tables, and Data Summary panels.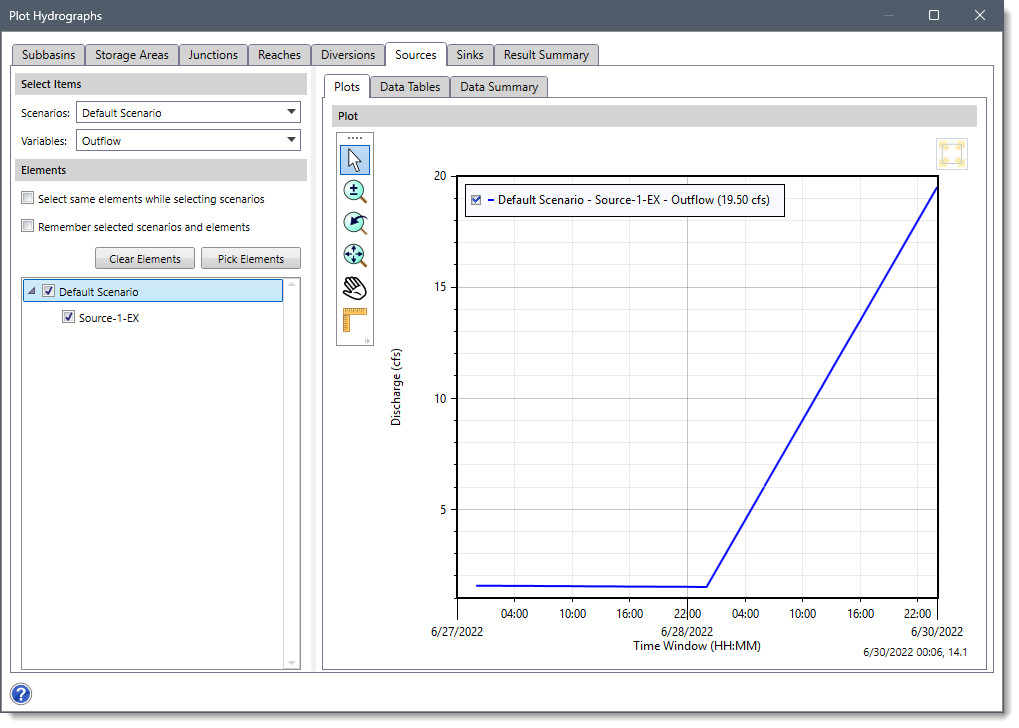
Displaying Hydrograph Plot for Sinks
The Sinks panel displays the output results for the sinks present in the project. Similar to the display of hydrograph plots for subbasins, the user can select the preferred scenario from the Scenarios dropdown combo box and output variables such as flow from the Variables dropdown combo box of the Select Items section. The software will then display the output results for the element(s) selected in the Elements section under the Plots, Data Tables, and Data Summary panels.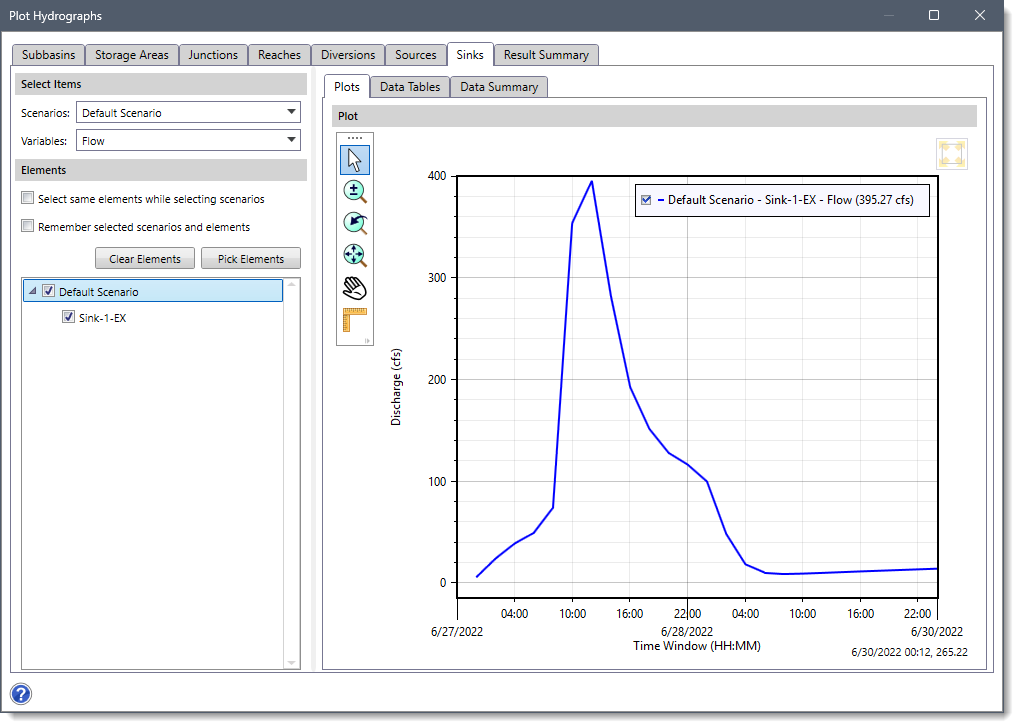
Displaying Multiple Hydrograph Plots
The Plot Hydrographs command also allows the user to display multiple hydrograph plots to easily compare analysis results for different elements and output variables. Hydrograph plots of the same variable but for different elements of the same element type are superimposed on the same axis. Hydrograph plots of different variables or element types are plotted on different axes as shown below.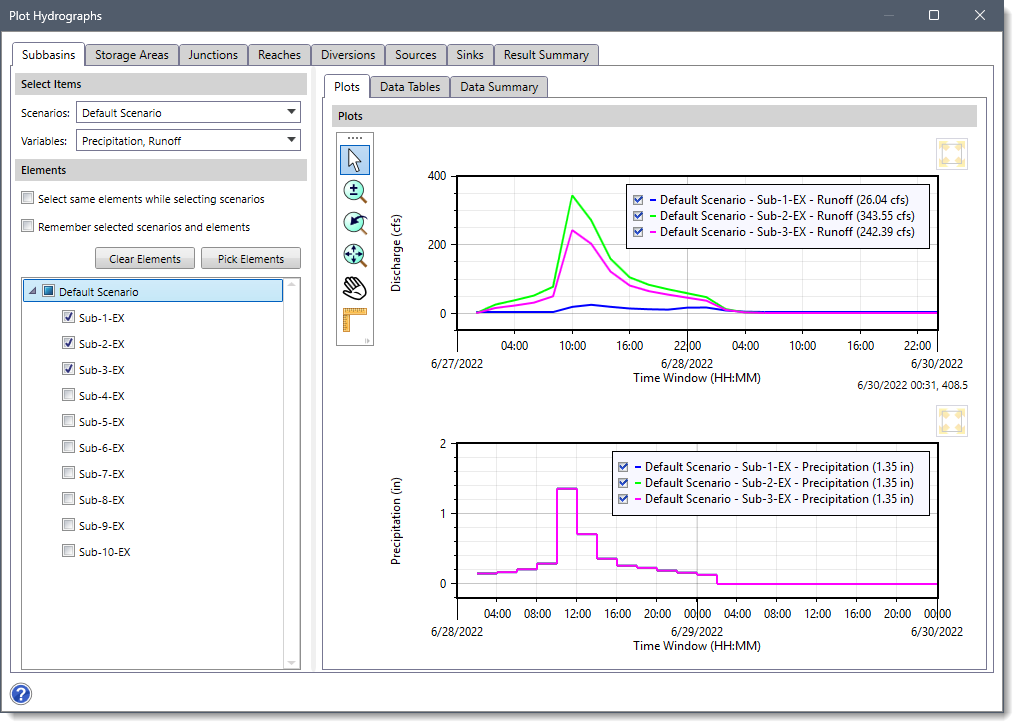
To view multiple hydrograph plots, the user can check the checkboxes corresponding to the preferred elements from the Elements section. Alternatively, the user can click the [Pick Elements] button and select multiple elements from the Map View.
Note that the user can select multiple elements on the Map View before selecting the Plot Hydrographs command from the Results ribbon menu.
After selecting the elements, the corresponding output results will be displayed under the Plots, Data Tables, and Data Summary panels.
Data Tables
The Data Tables panel lists the time series data values for the currently selected element in a tabular format. The user can “drag and drop” the columns to the left or right to reorder the column listings so that they are in a specific order. Based upon the selected element and variable, the contents of this panel may change.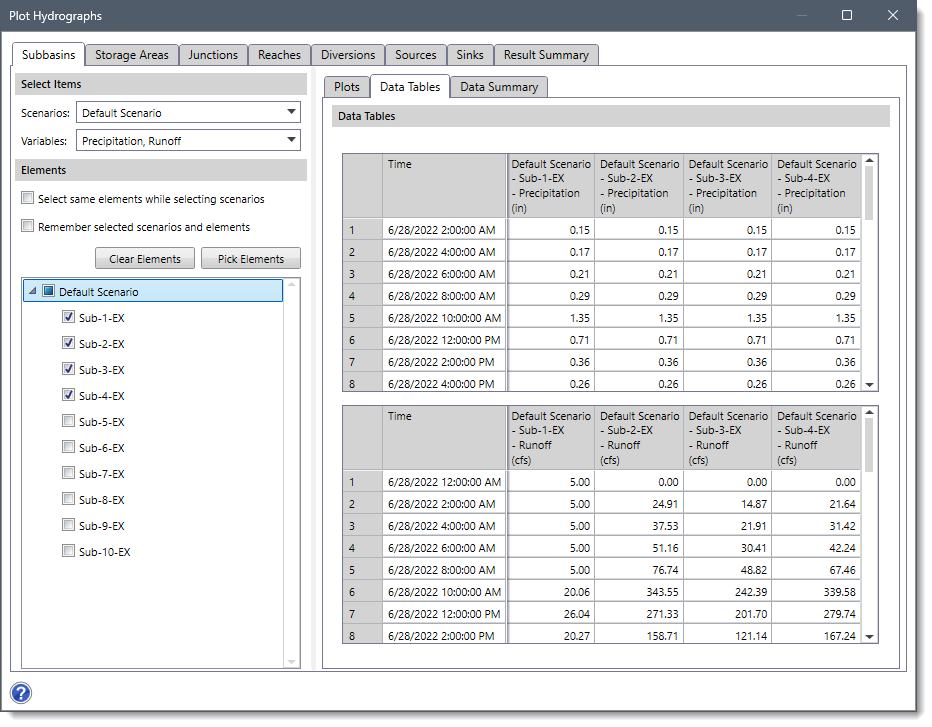
Right-clicking within the table displays context menu commands that allow users to cut, copy, and paste the data of the selected cells, as well as delete rows from the table. In addition, the user can copy the table data to the Windows clipboard or export it to Microsoft Excel or as a PDF format using these context menu commands.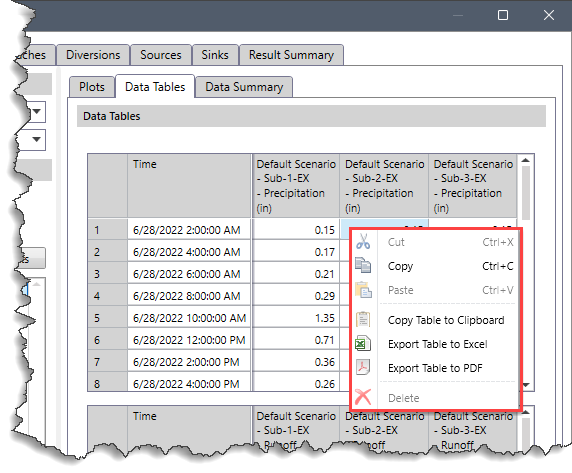
Similarly, right-clicking within the Plot displays context menu commands such as zoom, pan, copy, save as image, etc. for the graphical plot.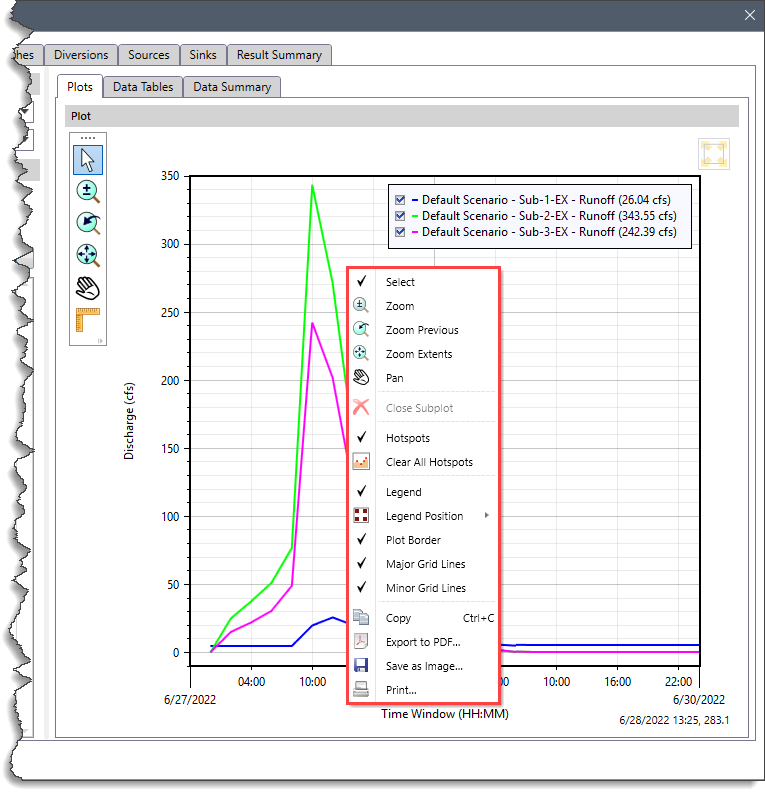
Data Summary
The Data Summary panel displays results of the parameters associated with the currently selected element(s). The user can “drag and drop” the columns to the left or right to reorder the column listings so that they are in a specific order. Based on the selected element, the contents of this panel may change.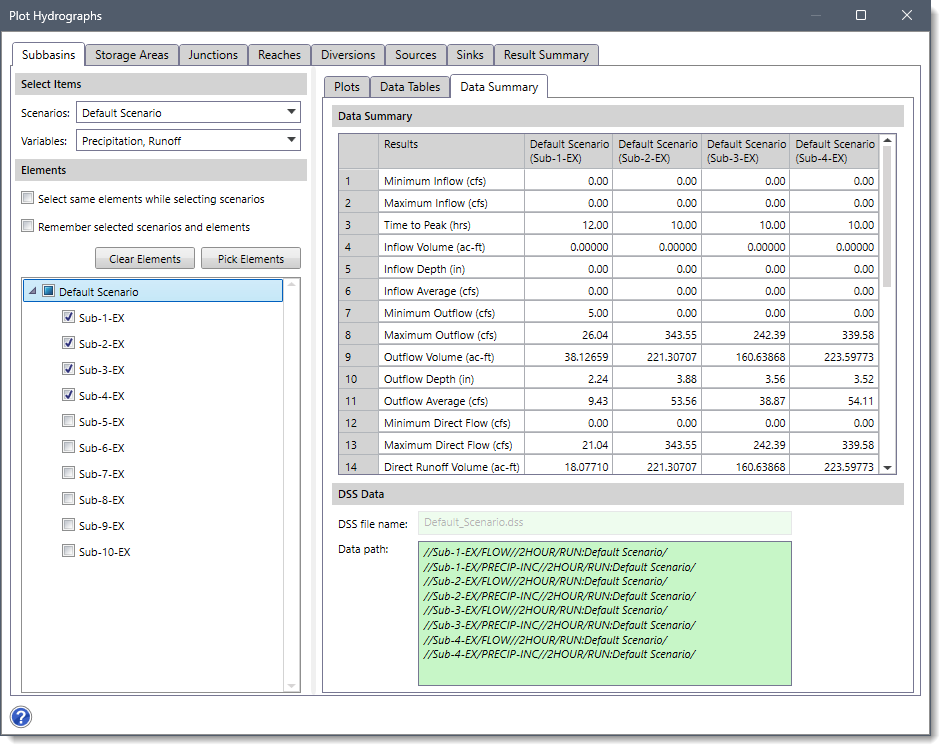
The DSS Data section includes an external DSS (Digital Storage System) file for referencing the computational results. The DSS file name field displays the external DSS file to be used for reading the data. The Data path field displays the data path within the DSS file from which the data are to be read.
Similar to the Data Tables panel, the software also allows the user to export data shown within the Data Summary panel to Microsoft Excel or PDF documents and send data to the Windows clipboard.
Results Summary
This panel displays the summary of the current analysis results for each element (Subbasins, Storage Areas, Junctions, Reaches, Diversions, Sources, and Sinks) in tabular format.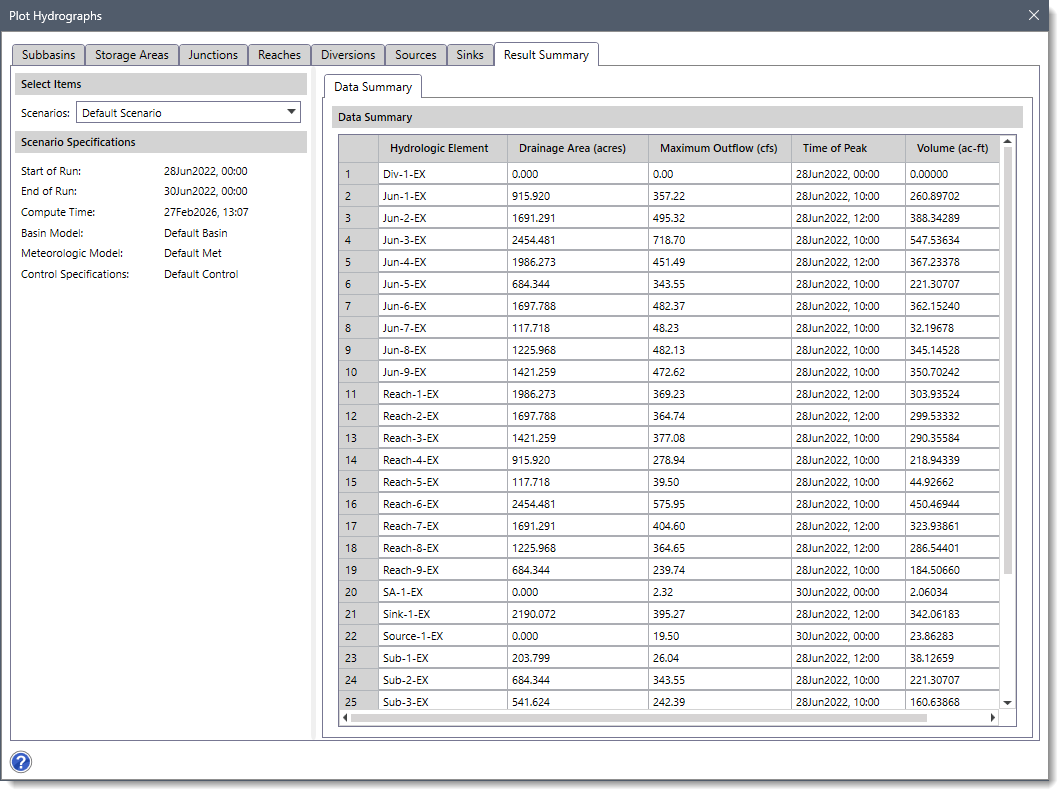
Note that the Results Summary panel can also be displayed by selecting the Result Summary command from the Results ribbon menu. To learn more about the Results Summary panel, refer to this article in our knowledge base.