An important aspect of performing an engineering study is documenting the study findings in an engineering report. The Generate Report command allows users to create engineering reports detailing the hydrology study. Most aspects of the report are automatically generated by the software so that users do not have to worry about adding different figures, graphs, tables, and more into a report document.
Once the report is created, it can then be saved as a template to be used in other engineering projects. In addition, users can simply adopt a previous engineering report for use as a template by modifying the report to fit the current engineering study.
To use the Generate Report command, follow the steps below:
- From the Results ribbon menu, select the Generate Report command.
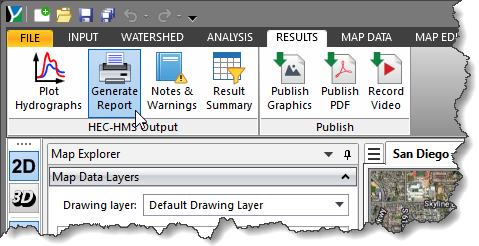
- The Generate Report dialog box will be displayed.
The below sections describe how to generate a report for a project and interact with the above dialog box.
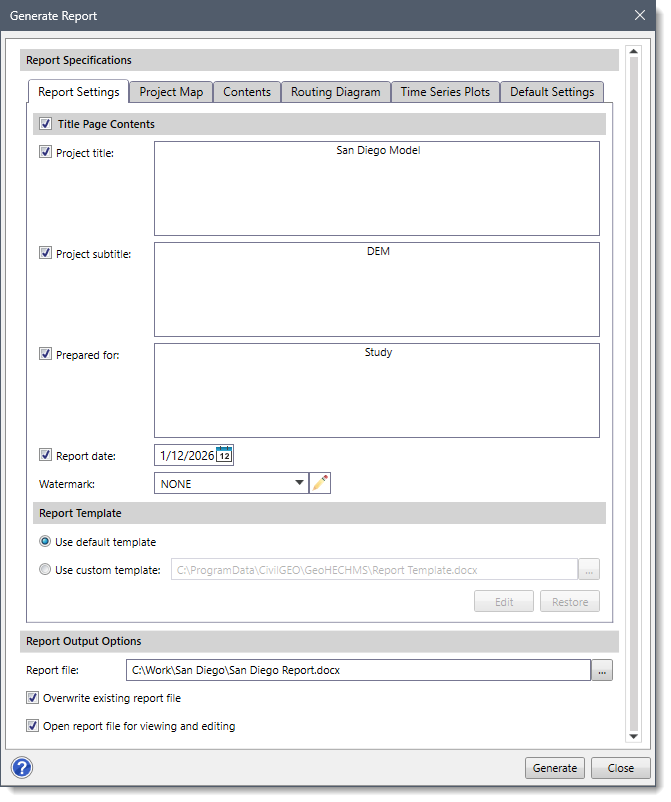
Report Specifications
The Report Specifications section contains the following panels:
- Report Settings
- Project Map
- Contents
- Routing Diagram
- Time Series Plots
- Default Settings
Report Settings
The Report Settings panel is used to specify general format settings for the report pages.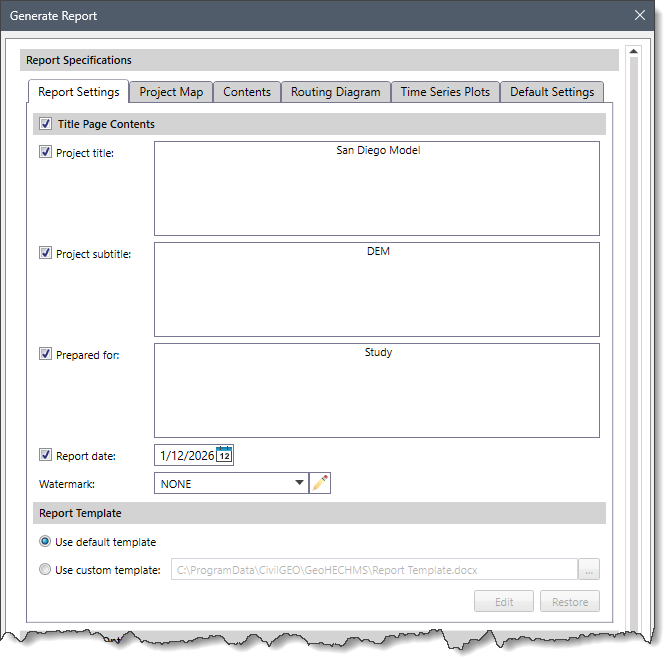
The following sections are available in the Report Settings panel:
Title Page Contents
This section allows the user to define content for the project. Note that if the checkbox at the Title Page Contents section header is checked, then the following entries are enabled:
- Project title
This checkbox entry field allows the user to enter the text that will be shown as the title of the project.
- Project subtitle
This checkbox entry field allows the user to enter the text that will be shown as the subtitle of the project.
- Prepared for
This checkbox entry field allows the user to enter the text that defines the purpose of the project.
- Report date
This checkbox entry field allows the user to include a date on the report’s title page. By default, this entry displays the current date. The user can click the [Date] button to open a calendar date selector and select a specific date. Note that the format of the listed date will be based on the computer’s location settings. For example, dates in the USA are formatted differently than in Europe. In addition, the user can manually type in the date—”July 2021″, for example— where it is just a month and year, with no date listed. If this entry is unchecked, no date will be listed on the title page.
- Watermark
This editable dropdown combo box lists watermarks that can be included in the page background. This entry is saved at the project level. The user can click the [Add New Watermark] button to add new watermarks. In addition, the user can rename the existing watermarks by clicking the pencil icon adjacent to this dropdown combo box.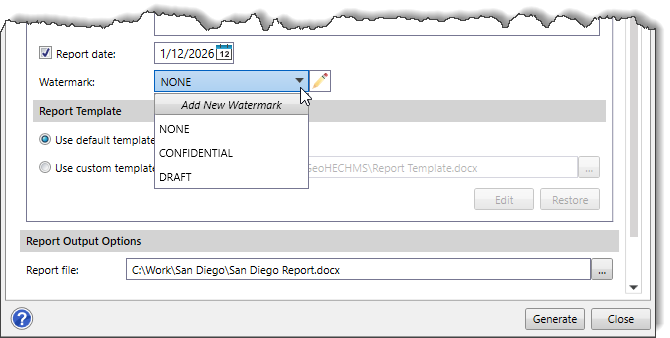
Report Template
This section allows the user to choose either the default or custom template for generating the report.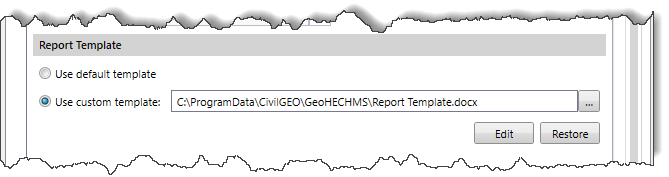
The following options are available in this section:
- Use default template
This radio button option allows the user to select the default template. Selecting this radio button option enables the Include Report Sections section in the Contents panel, along with the Paper Settings, Additional Title Page Content, and the Page Header and Footer sections in the Default Settings panel.
- Use custom template
This radio button option allows the user to select a custom template. Selecting this radio button option enables the corresponding […], [Edit], and [Restore] buttons.
- Clicking the […] button allows the user to select a template file to use.
- Clicking the [Edit] button opens the custom template file to edit the cover page template.
- Clicking the [Restore] button allows the user to restore the custom template to its default version.
Project Map
The Project Map panel is used to define the project map to be displayed in the generated report. If the checkbox at the Project Map section header is unchecked, then the project map will not be included in the report. Note that this panel is disabled if the user has not defined a base map layer for the project. Refer to this article in our knowledge base to learn how to add a base map layer to your project.
The following subpanels are available in the Project Map panel:
Project Area
The Project Area subpanel displays an independent base map view of the main Map View. Initially, the subpanel shows the current Map View extents, but the user can zoom and pan this view using the mouse cursor. It is used to determine the extents of the project area map to be shown in the report.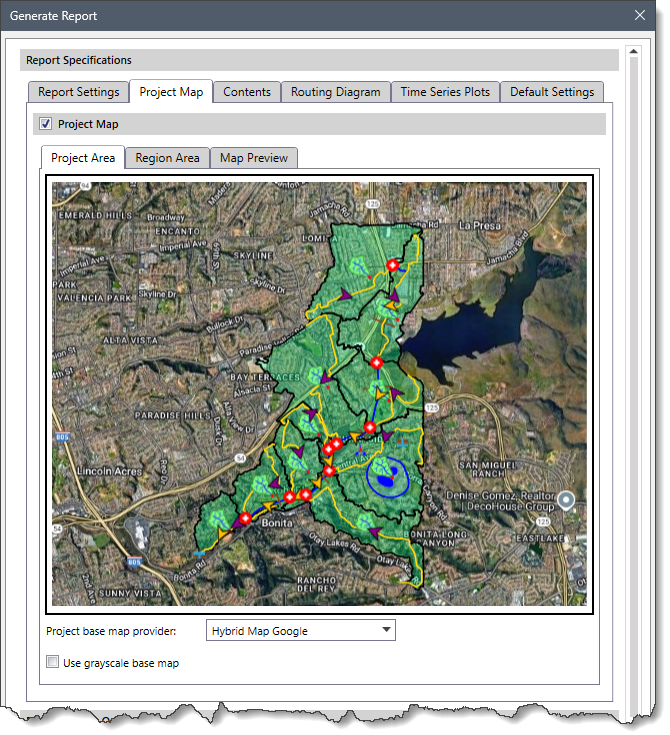
The user can select the project base map from several high-quality base maps available in the Project base map provider dropdown combo box. The Use grayscale base map checkbox option allows the user to toggle the color scheme of the base map from color to grayscale. By default, this checkbox option is unchecked.
Region Area
The Region Area subpanel displays an independent base map view of the main Map View. Initially, it shows the current Map View extents four times, but the user can zoom and pan this view using the mouse cursor. It is used to determine the extents of the region area map to be shown in the report. The Map View window defines the final project area map.
The user can select the region base map from several high-quality base maps available in the Region base map provider dropdown combo box. The Include project area border, color checkbox option is used to include a border around the region area. The user can select the color for the bordering lines from the dropdown palette. By default, this checkbox option is checked.
Map Preview
The Map Preview subpanel displays the project map constructed using the project area map and the region area map. This subpanel shows the project map that will be included in the generated report.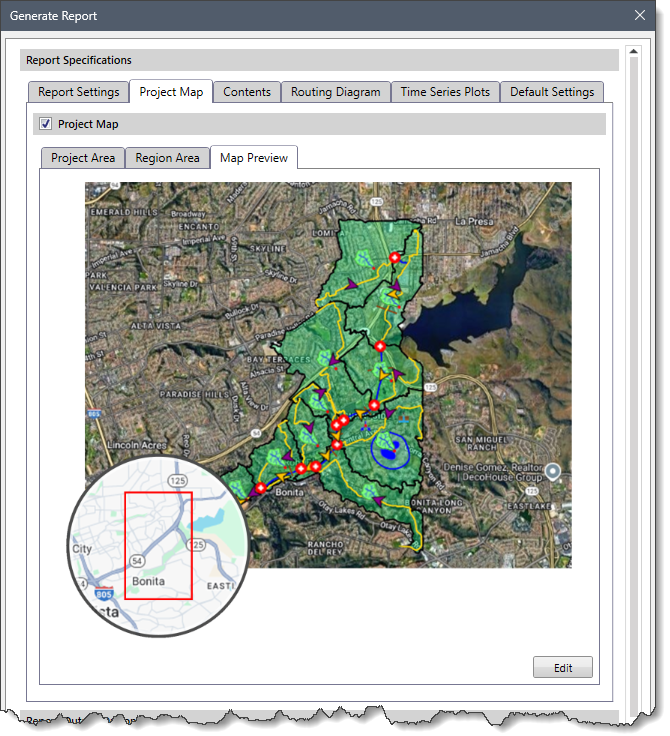
The user cannot adjust the project area map and the region area map from this subpanel. The user will need to return to the other two subpanels to make those adjustments. However, the user can draw basic elements on top of the project map, such as lines, shaded polygons, arrows, and text using the [Edit] button. Clicking the [Edit] button displays the Edit Project Map dialog box. This dialog box contains a diagram editor that allows the user to edit the Map Preview. To learn how to use the Edit Project Map diagram editor, refer to this article in our knowledge base.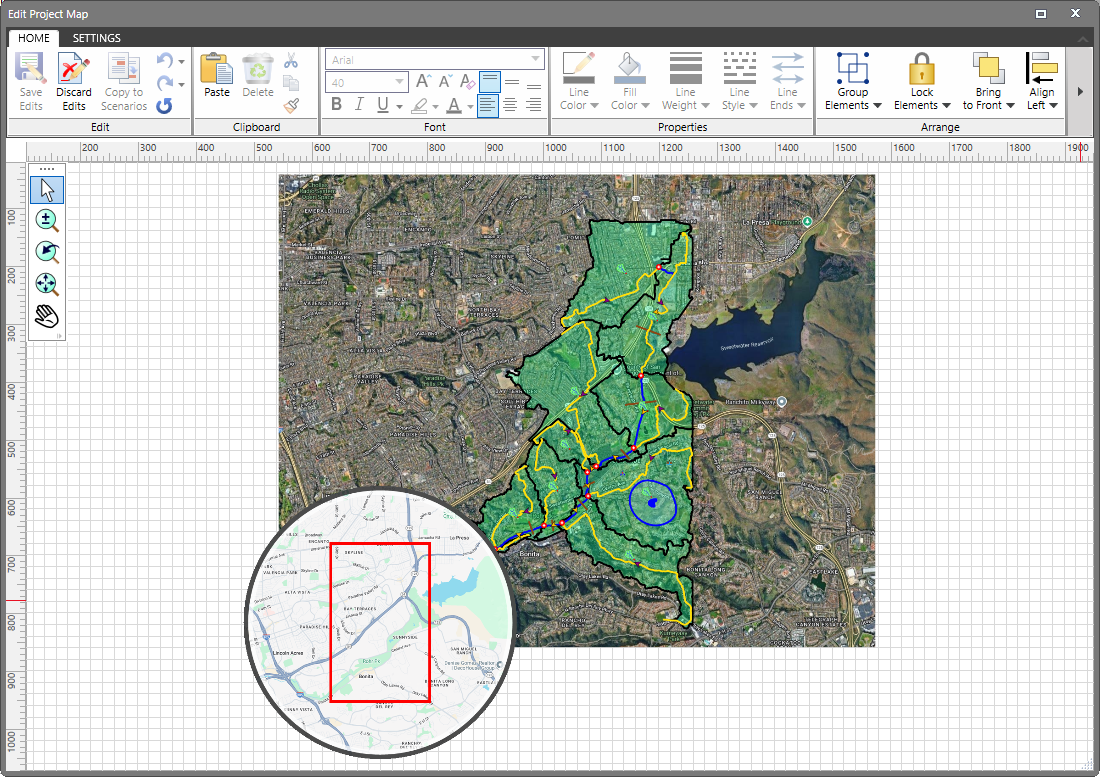
Contents
The Contents panel is used to define the entire contents of the generated report.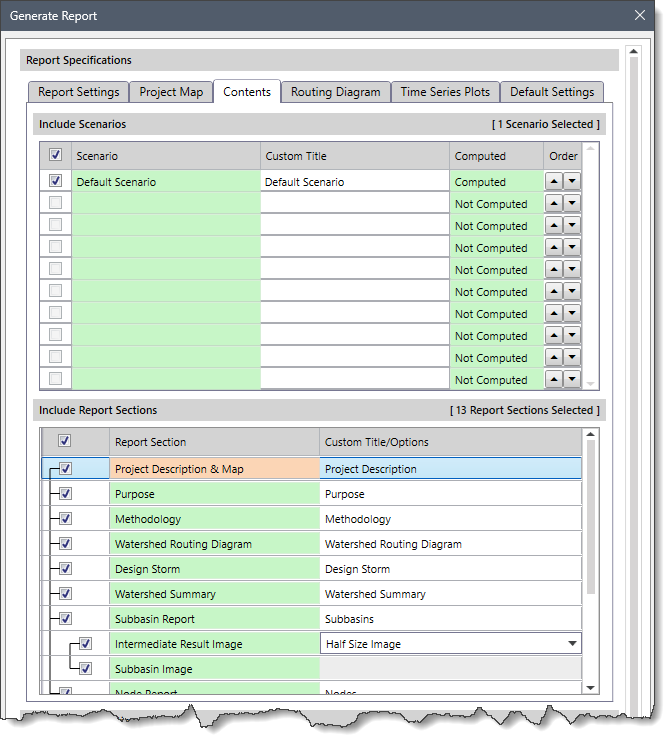
The following sections are available in the Contents panel:
Include Scenarios
This section provides a table that allows the user to define which scenarios should be included in the report. The following columns are available in the table:
- Scenario
This column lists the available scenarios that are contained in the project. The user can toggle on and off the checkboxes to include or exclude scenarios from the generated report. Note that the current scenario is shown as selected if the analysis results are available. The other scenarios are shown as not selected.
Not all scenarios need to be defined for an output report. However, at least one scenario needs to be defined to generate a report for the project.
- Custom Title
This column allows the user to change the scenario name to be listed in the engineering report. It allows the user to place a more meaningful name for the scenario being reported.
- Computed
This column shows whether the analysis results are available to be included in the report. If the analysis results are available, this read-only entry states ‘Computed.’ If the analysis results are not available, the entry states, ‘Not Computed’ and the row is disabled.
- Order
By default, the scenarios are listed in alphabetical order. However, this column can be used to change the order in which the scenarios are reported in the file.
Include Report Sections
This section provides a table that allows the user to define which sections of the report should be included in the generated report. The following columns are available in the table:
- Report Section
This column lists all the available report sections. The user can toggle on and off the checkboxes to include or exclude report sections from the generated report.
- Custom Title/Options
This column allows the user to change the report section name to be listed in the engineering report. It allows the user to place a more meaningful name in the report section. For example, the user may want to translate the report section title into a different language (i.e., German).
Routing Diagram
The Routing Diagram panel is used to edit the HEC-HMS routing elements in the routing diagram. The user can grab the elements and move them around on the Routing Diagram panel to make the routing diagram more understandable. Note that the elements will stay linked together during these modifications.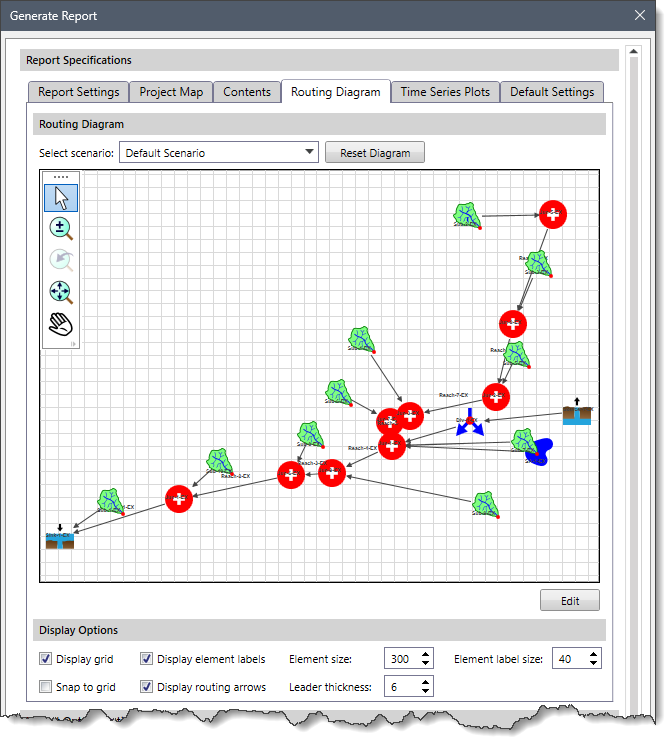
The following sections are available in the Routing Diagram panel:
Routing Diagram
The following options are available in this section:
- Select scenario
The user can select the scenario for editing using the Select Scenario dropdown combo box. This combo box lists all the scenarios that were selected in the Contents panel. As the user switches between scenarios in the dropdown combo box, the diagram preview window is updated to represent the selected scenario.
- Reset Diagram
On clicking the [Reset Diagram] button, the current diagram resets to show the routing elements as represented on the Map View.
- Zoom and Pan Tools
In the upper-left corner of the diagram preview window, several zoom and pan tools provide the user more control in viewing the elements and routing symbols. To learn how to use these tools, refer to this article in our knowledge base.
- Edit
On clicking the [Edit] button, the software will display the Edit Schematic Diagram dialog box. This dialog box contains a diagram editor that allows the user to edit the routing diagram and copy the edits from one scenario to another. To learn how to use this diagram editor, refer to this article in our knowledge base.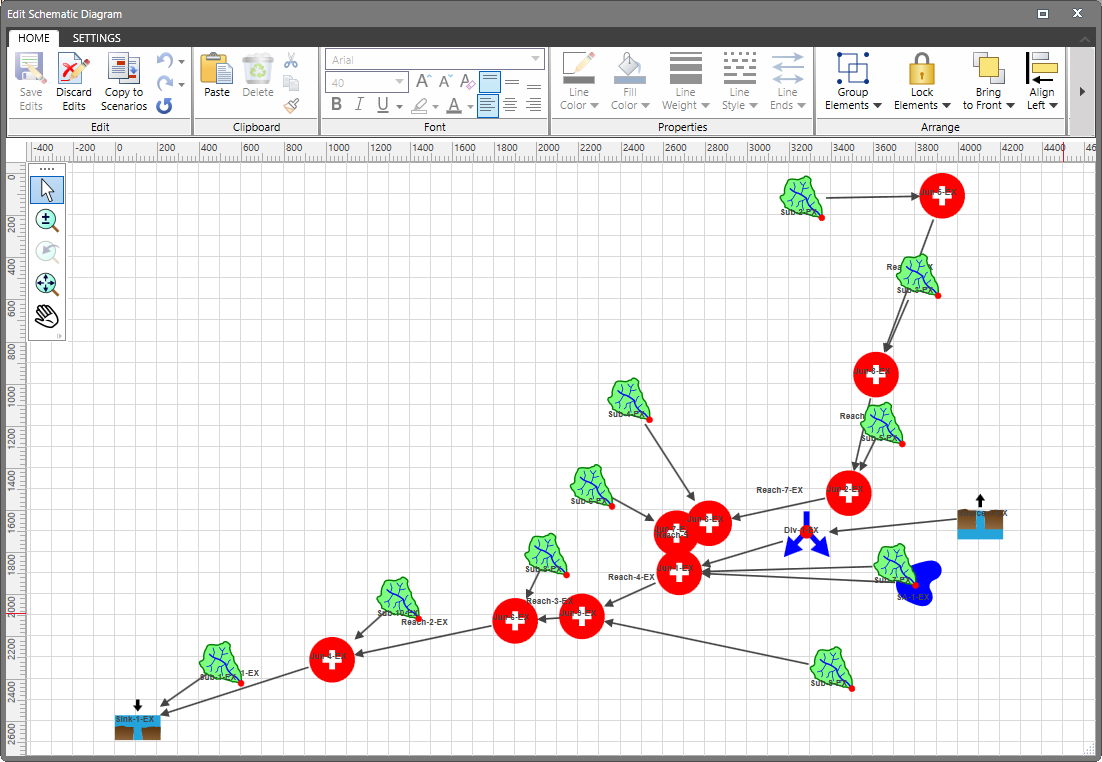
Display Options
This section provides various display options to the user as described below:
- Display grid
The Display grid checkbox displays a background grid on the canvas. This checkbox is checked by default.
- Snap to grid
The Snap to grid checkbox causes the elements to snap to the background grid. This checkbox is unchecked by default. If the Display grid checkbox is unchecked, the Snap to grid checkbox option is disabled.
- Display element labels
The Display element labels checkbox controls the display of the element labels next to the elements on the canvas. This checkbox is checked by default.
- Display routing arrows
The Display routing arrows checkbox controls the display of the arrowheads on the ends of the routing arrows on the canvas. This checkbox is checked by default.
- Element size
The Element size spin control allows the user to adjust the size of the elements on the canvas.
- Element label size
The Element label size spin control allows the user to adjust the size of the element labels.
- Leader thickness
The Leader thickness spin control allows the user to adjust the thickness of the routing arrows connecting the HEC-HMS elements on the canvas.
Time Series Plots
The Time Series Plots panel is used to define custom time series plots to be included in the generated report. This is helpful when the user wants to compare different hydrographs from various scenarios and elements.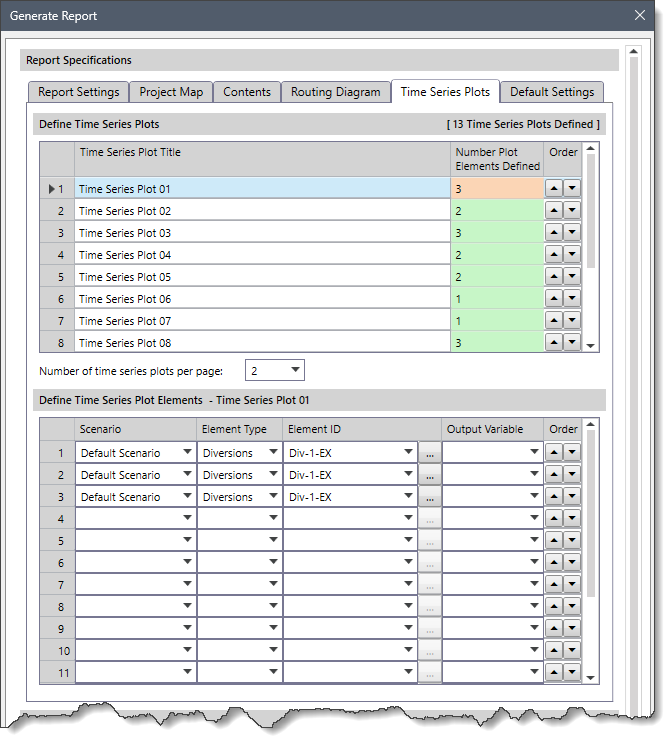
The following sections are available in the Time Series Plots panel:
Define Time Series Plots
This section provides a table that allows the user to define multiple time series plots to be included in the generated report. The order of the time series plot in the table defines the sequence in which multiple plots will be placed on a single page. From the Number of time series plots per page dropdown combo box, the user can specify the number of time series plots to place on each report page. The time series plots are then scaled to fit on the page accordingly.
The following columns are available in the table:
- Time Series Plot Title
This editable column allows the user to define what title should be placed at the top of the time series plot. If the user defines a plot element and does not define a plot title, a default title of Time Series Plot ## is used, where ## represents a unique number.
- Number Plot Elements Defined
This read-only column represents the number of HEC-HMS elements defined for the time series plot.
- Order
By default, the time series plots are listed in the order that the user defines them. However, this column can be used to change the order in which the time series plots are placed in the report.
Define Time Series Plot Elements
This section provides a table that allows the user to define the HEC-HMS elements that are included in the time series plot being defined. The previously defined time series plot title is included in the section header. Note that a maximum of 16 rows of elements can be defined in the table, corresponding to the 16 unique colors available for the plot.
The following columns are available in the table:
- Scenario
This column contains a dropdown combo box that lists the scenarios selected in the Include Scenarios section of the Contents panel. The scenarios are listed in the order that they are defined in the Include Scenarios section.
- Element Type
This column contains a dropdown combo box that lists all the elements that can be defined in an HEC-HMS model. The following entries are available in the dropdown combo box:
- Diversions
- Junctions
- Reaches
- Sinks
- Sources
- Storage Areas
- Subbasins
- Element ID
This column contains a dropdown combo box that is disabled until the user has selected a scenario and an element type. Once the dropdown combo box is enabled, it lists all the element IDs corresponding to the scenario and element type selected. The user can select the element directly from the dropdown combo box entry or by clicking the corresponding […] button to select the element from the Map View.
- Output Variable
This column contains a dropdown combo box that lists all the output variables for the selected HEC-HMS element. The content of the dropdown combo box changes based upon what element type is selected, as described below:
Diversion Output Variables Junction Output Variables Sink
Output VariablesSource Output Variables Storage Area Output Variables Subbasin Output Variables Diverted Flow [cfs] [cms] Flow [cfs] [cms] Flow [cfs] [cms] Flow [cfs] [cms] Elevation [ft] [m] Runoff [cfs] [cms] Inflow [cfs] [cms] Reach Output Variables Inflow [cfs] [cms] (default) Outflow [cfs] [cms] (default) Inflow [cfs] [cms] Stage [ft] [m] Outflow [cfs] [cms] (default) Storage [acre-ft] [m³]
- Order
By default, the time series plot elements are listed in the order that the user defines them. However, this column can be used to change the order in which the time series plot elements are placed in the report.
Default Settings
The General Settings panel is used to specify general format settings for the report pages.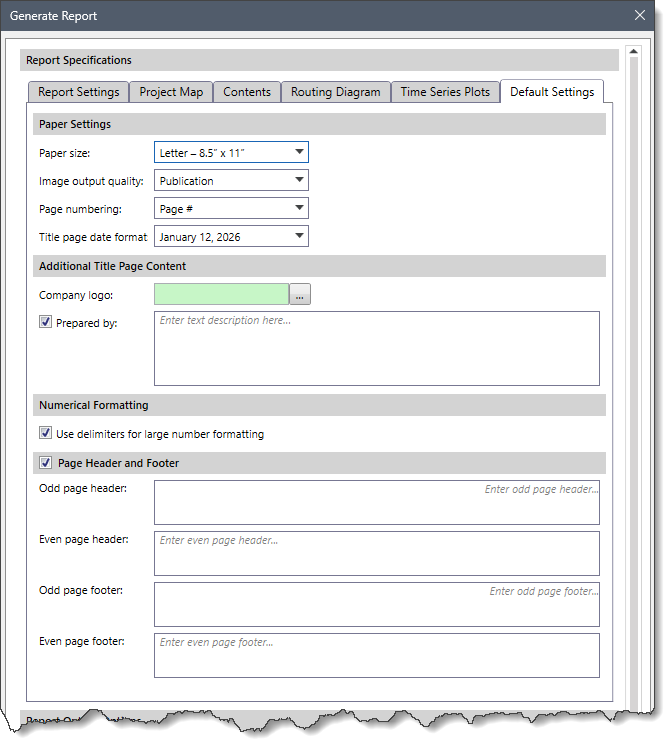
The following sections are available in the Default Settings panel:
Paper Settings
This section is used to define the page size, page numbering format, and date formats of the report. The following options are available in this section:
- Paper size
This dropdown combo box allows the user to select the paper size from the available standard paper sizes. The selected size is stored at the application level and recalled for future applications. Note that the content of the dropdown combo box changes based on project units.
- Image output quality
This dropdown combo box allows the user to select the image output quality format. The following formats are available:
- Draft
- Publication
- Page numbering
This dropdown combo box lists different page numbering formats. The following formats are available:
- Page # (default)
- Page # of ##
Note that page numbering is not available for the Cover Page or the Table of Contents section.
- Title page date format
This dropdown entry allows the user to select the date format for the title page from the listed formats. The following formats are available:
- DD-MM-YYYY
- DD Month, YYYY
- DD Mon, YYYY
- Month DD, YYYY
Additional Title Page Content
This section defines the company logo and the Prepared by content to be placed at the top of the page. Note that this section is stored at the application level so that the next report already includes the company logo and Prepared by information. Clicking the […] button will display the Select Company Logo dialog box that allows the user to select the company logo file.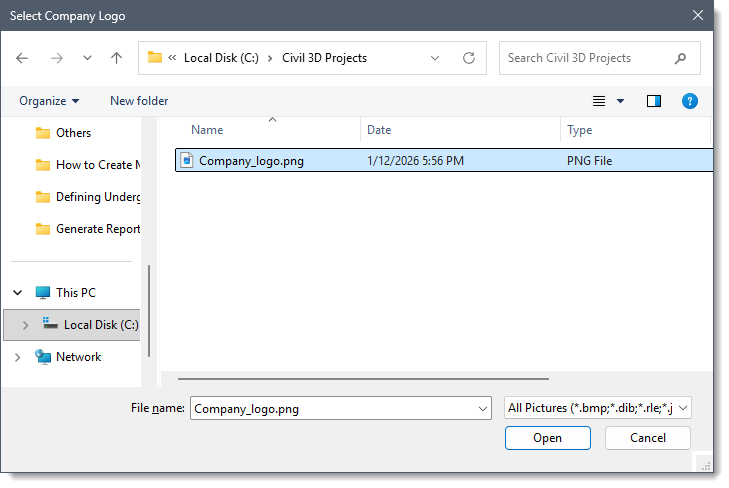
Numerical Formatting
This section contains a Use delimiters for large number formatting checkbox option. By default, this checkbox option is checked. It causes the software to format large numbers using a delimiter.
Page Header and Footer
The section allows the user to include header and footer sections in the report pages. By default, this section is enabled. The user can define the header and footer text for odd and even pages in the respective entry fields of this section. Note that only two lines of text are allowed. If the checkbox at the Page Header and Footer section header is unchecked, then this section will be disabled, and the header and footer will not be included in the report pages.
Report Output Options
In the Report Output Options section, the user can define where to save the generated report, whether to overwrite an existing file, and open the report automatically for viewing and editing.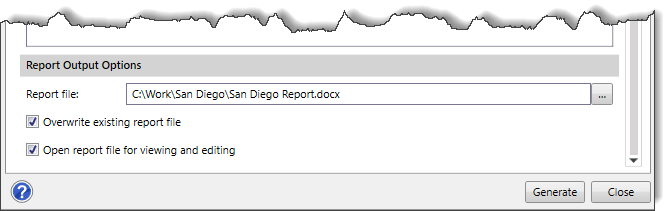
The following options are available in this section:
- Report file
This entry allows the user to specify the file path and name where the generated report will be saved. The user can either use the default location or click the […] browse button to choose a different file path and name.
- Overwrite existing report file
This checkbox option causes the software to overwrite the existing content of the report file with the updated content. By default, this checkbox option is checked. If unchecked, the existing content of the report file will not be replaced, and the updated content will be saved separately.
- Open report file for viewing and editing
This checkbox option allows the user to view the just created report file and make changes to it. By default, this checkbox option is checked. If unchecked, the report file will not open automatically.
Generating Report
Once the report specifications are defined, click the [Generate] button to generate the report at the specified location. The report will be generated either as a PDF or a Word document.