In GeoSTORM software, the user can view the pipe profile path, connected over a path of drainage system links (i.e., pipes and reaches) and nodes (i.e., manholes, junctions, and terminal outfalls) using the Profile Plot command. Refer to this article in our knowledge base to learn how to use the Profile Plot command.
Once the pipe profile is plotted, the user can print the profile plot or export the profile plot to a PDF, graphic, or CAD file.
Follow the steps below to export a profile plot using the Profile Plot command:
- From the Results ribbon menu, select the Profile Plot command.

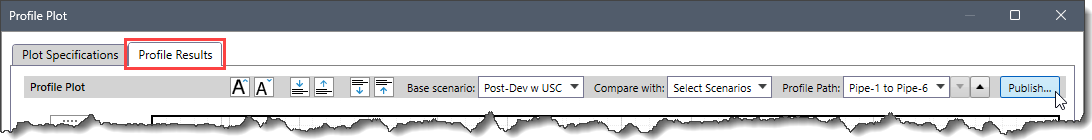
- The Profile Plot dialog box will be displayed.

- From the Profile Results panel, click the [Publish] button.
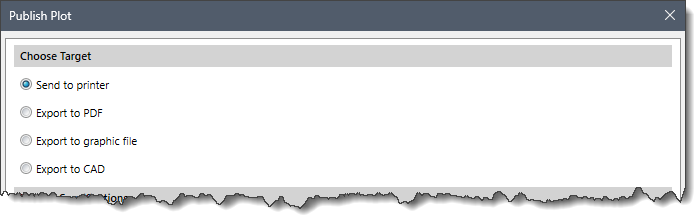
- The Publish Plot dialog box will be displayed.

The following sections describe the Publish Plot dialog box and how to print or export a profile plot.
Profile Plot Publishing Options
The Choose Target section allows the user to select the format in which the profile plot needs to be printed or exported. The following format options are available in this section:
- Send to printer
- Send to PDF
- Send to graphic file
- Send to CAD
Publish Specifications
This section allows the user to define the specifications for the profile plot to be printed or exported. The following panels are available in this section:
- Profile Paths
- Plot Labels
- General Options
- Layer Options
- Printer & PDF Details

Note that these panels will be enabled or disabled based on the target format selected by the user.
Profile Paths
This panel allows the user to select the pipe profile paths available in the current scenario. The available pipe profile paths will be listed in the Profile Path table under the Select Profile Paths subsection. Note that this panel is only enabled when the user selects Export to CAD as the exporting option.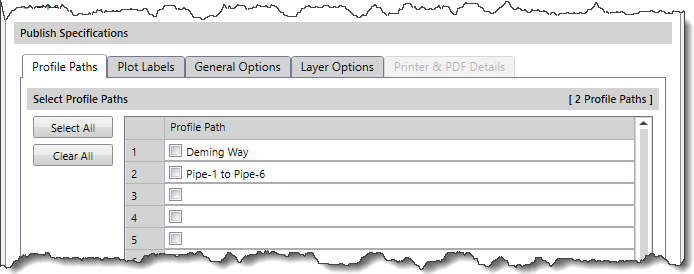
The user can click the [Select All] button to select all the profile paths listed in the Profile Path table. Alternatively, the user can manually select the profile paths by checking or unchecking the listed entries in the Profile Path table. Clicking the [Clear All] button deselects all the selected profile paths listed in the Profile Path table.
Plot Labels
This panel allows the user to define the profile plot labels to be exported. The user can edit, change, and define labels that will appear on the profile plot. Note that this panel is only enabled when the user selects Export to CAD as the exporting option.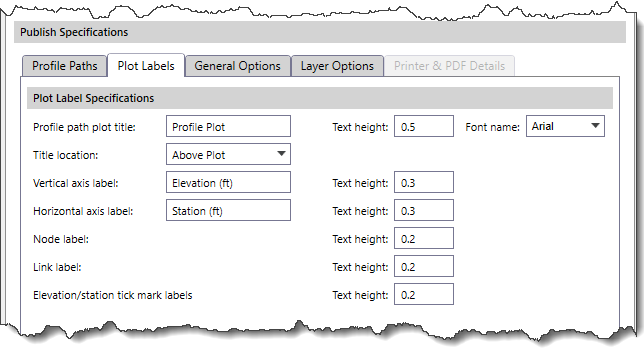
The Profile path plot title entry is used to define the profile path plot title. The Title location dropdown combo box entry is used to define the location for placing the profile path plot title on the plot sheet. The Title location dropdown combo box entry has two options—Above Plot and Below Plot.
Other options provided in this panel to define the other profile plot labels include Vertical axis label, Horizontal axis label, Node label, Link label, and Elevation/station tick mark labels.
General Options
This panel allows the user to define the tick mark spacing, plot scaling, and plot layout specifications to be used when exporting the profile plot. Note that this panel is only enabled when the user selects Export to CAD as the exporting option.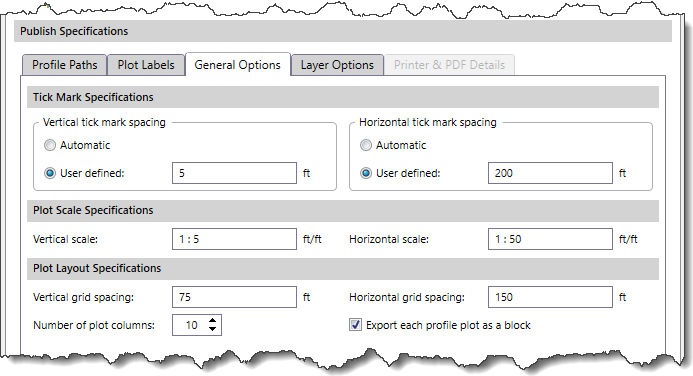
The following options are provided in this panel:
- Tick Mark Specifications
This subsection is used to define the distance between tick marks for vertical and horizontal axes. The following options are provided for both vertical and horizontal tick mark spacing:
- Automatic
- User-defined
- Plot Scale Specifications
This subsection is used to define the scale to be used for the vertical and horizontal axes.
- Plot Layout Specifications
This subsection is used to define the grid spacing for vertical and horizontal axes, along with the number of plot columns to be used. The Export each profile plot as a block checkbox option causes the entire profile plot to be a single block, allowing the user to easily move it within CAD.
Layer Options
This panel allows the user to define the drawing layers (or levels for MicroStation) to be created for the exported CAD drawing. Note that this panel is only enabled when the user selects Export to CAD as the exporting option.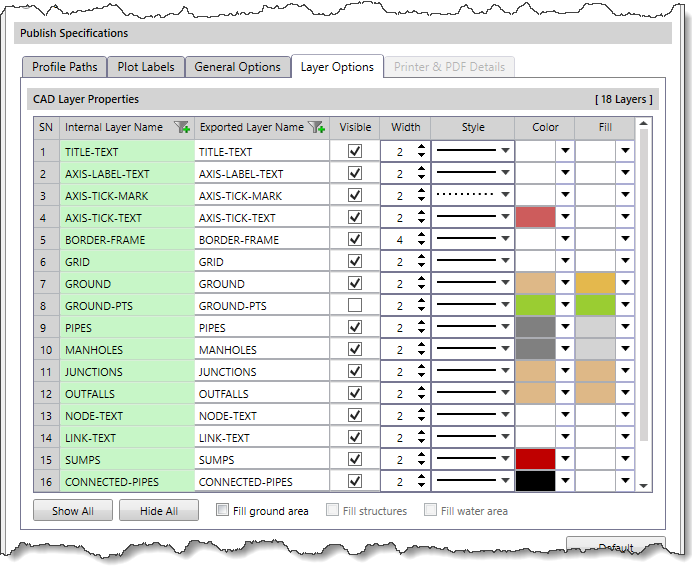
This panel contains a CAD Layer Properties table that allows the user to define and modify the stylization of CAD layers. The user can use this table to edit or change the width, style, and color of the CAD layers.
The Internal Layer Name read-only column displays the internal layer name used for reference by the software. The Exported Layer Name editable column displays the layer (or level) name to be used when constructing the profile plots.
The visibility of the layers can be controlled by the [Show All] and [Hide All] buttons. Alternatively, the user can manually select the layers to be visible by checking or unchecking the checkboxes under the Visible column.
The Fill ground area, Fill structures, and Fill water area checkboxes control the filling of the ground terrain, structures (dams, bridges, etc.), and water area on the profile plot, respectively.
Printer & PDF Details
This panel allows the user to configure the print and PDF details to print the profile plot or export the profile plot to a PDF document. Note that this panel is only enabled when the user selects Send to printer or Export to PDF as the exporting format.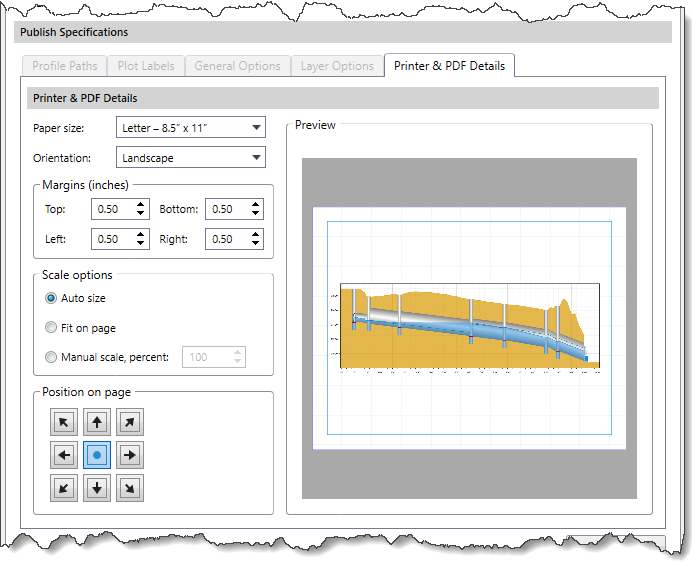
The following options are provided in this panel:
- Paper size
This dropdown combo box allows the user to select the page dimensions to be used for the print or PDF document. The following options are provided:
- A4 – 21.0 x 29.7 cm
- Letter – 8.5” x 11”
- Orientation
This dropdown combo box allows the user to select the page orientation to be used for the print or PDF document. The following options are provided:
- Landscape: This option is used to organize the content of the document horizontally, with the left and right margins being larger than the top and bottom margins.
- Portrait: This option is used to organize the content of the document vertically, with the top and bottom margins being larger than the left and right margins.
- Margins
This subsection allows the user to set the page margins to be used for the print or PDF document. The user can set the top, bottom, left, and right margins using the adjacent spin control entry field.
- Scale options
This subsection allows the user to scale the print or PDF document to fit the paper size. The following options are provided:
- Auto size: This option automatically scales the document to fit the selected paper size.
- Fit on page: This option scales up the content on the document to make it more readable or scales it down to fit more content on a page.
- Manual scale, percent: This option scales the document by the amount entered or set in the adjacent spin control entry field.
- Position on page
This subsection allows the user to set the position of the profile plot on the printed or exported PDF document. The user can click the specific direction arrow button to set the position of the profile plot. The defined position of the profile plot will be displayed in the Preview subsection.
Saving and Loading Settings
The user can click the [Default] button to restore the publish plot specifications to default settings.![[Default] button](https://knowledge.civilgeo.com/wp-content/uploads/2025/08/Exporting-Profile-Plot-Image-12.png)
The user can save the defined settings to be used for exporting the profile plot for all future projects by clicking the [Save Settings] button.![[Save Settings] button](https://knowledge.civilgeo.com/wp-content/uploads/2025/08/Exporting-Profile-Plot-Image-13.png)
Clicking the [Save Settings] button will display the Save Settings dialog box. The user can enter the file name and click the [Save] button to save the defined settings. The saved file will have .pppltcfg as the file extension.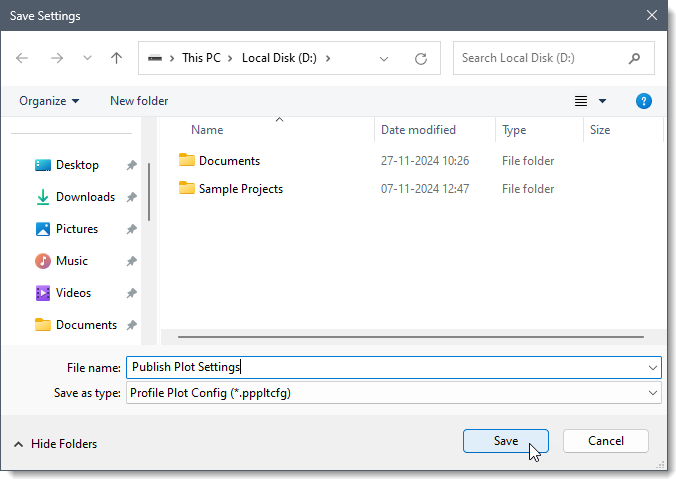
The user can click the [Load Settings] button to load the previously defined settings.![[Load Settings] button](https://knowledge.civilgeo.com/wp-content/uploads/2025/08/Exporting-Profile-Plot-Image-15.png)
Clicking the [Load Settings] button will display the Open Setting File dialog box. The user can select the file with the .pppltcfg extension and click the [Open] button to load the defined settings.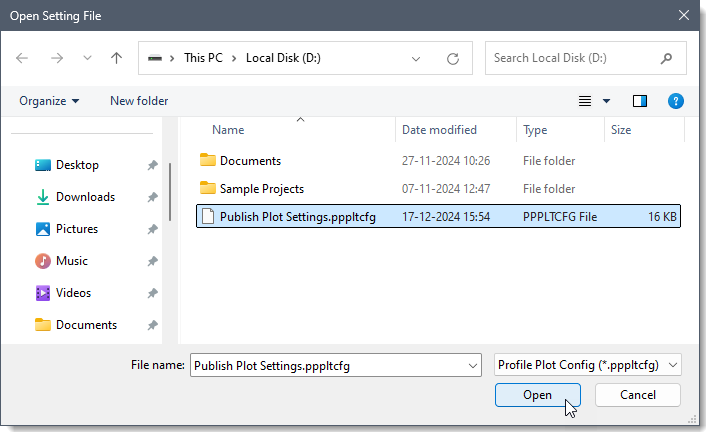
Once the required publish plot settings are defined, click the [OK] button to print the profile plot or export the profile plot to a PDF, graphic, or CAD file.