In GeoSTORM software, the Routing Reach Table Edit command allows the user to view and edit all the parameters of the routing reaches in one editable data grid. The user can also view the corresponding output results from this data grid.
Follow the steps below to use the Routing Reach Table Edit command:
- From the Input ribbon menu, click the Routing Reaches dropdown menu and select the Routing Reach Table Edit command.

- The Routing Reach Table Edit dialog box will be displayed.
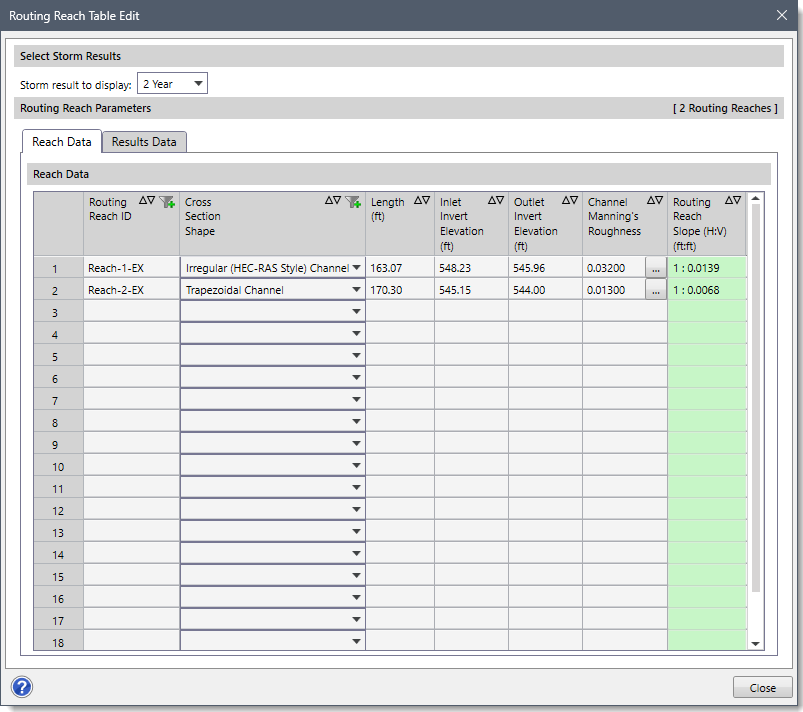
The following sections describe how to use the Routing Reach Table Edit command and interact with the above dialog box.
Selecting Storm Results
In the Select Storm Results section, the Storm result to display dropdown combo box allows the user to select the storm frequency whose result is to be displayed.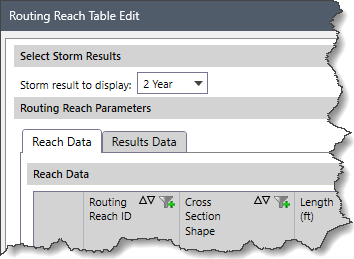
Note that the Select Storm Results section is only available when either the Modified Rational, Rational Method, or DeKalb Rational Method is selected as the hydrology analysis engine in the Scenario Manager dialog box. Otherwise, this section is unavailable.
Routing Reach Parameters
The following panels are available in the Routing Reach Parameters section:
- Reach Data
- Results Data
Reach Data
This panel contains editable table columns that list routing reach parameters present in the current scenario.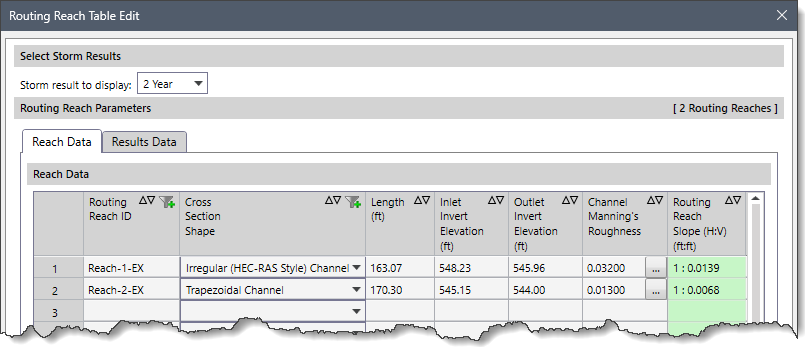
The following routing reach parameters are provided in the table column entries:
- Routing Reach ID
This editable column lists all routing reach IDs contained in the current scenario.
- Cross Section Shape
This column—with a dropdown combo box—allows the user to define the cross section shape. The following cross section shapes are available:
- Irregular (HEC-RAS Style) Channel
- Rectangular Channel
- Trapezoidal Channel
- Triangular Channel
- Length
This editable column lists the length of the routing reaches.
- Inlet Invert Elevation
This editable column lists the routing reach invert elevations on the upstream (inlet) ends.
- Outlet Invert Elevation
This editable column lists the routing reach invert elevations on the downstream (outlet) ends.
- Channel Manning’s Roughness
This editable data grid column lists the Manning’s roughness of the channel. Clicking the […] button at the Manning’s Roughness column header displays the Manning’s Roughness dialog box, which allows the user to select the Manning’s roughness coefficient to be assigned to the channel.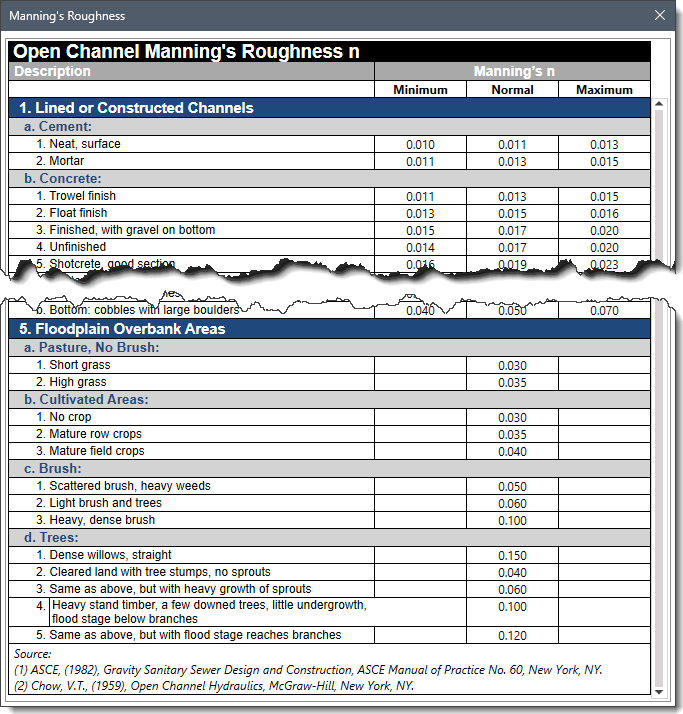
- Routing Reach Slope
This read-only column lists the routing reach slope.
Results Data
This panel lists corresponding output results for routing reaches present in the current scenario.
- Routing Reach ID
This editable column lists all routing reach IDs contained in the current scenario.
- Peak Flow Rate
This read-only column lists the peak flow rate at the corresponding routing reach during the storm event.
- Maximum Velocity
This read-only column lists the maximum flow velocity at the corresponding routing reach during the storm event.
- Max/Design Flow Ratio
This read-only column lists the ratio of peak flow to design flow capacity values. A value of 1.0 means that the pipe is at the design flow capacity (100% of capacity). A value greater than 1.0 means that the pipe is flowing at greater than the design flow capacity.
Sorting Routing Reach Parameters Table
The data in the Routing Reach Parameters table can be sorted by multiple columns. The user can sort the data by holding down the [Shift] key while clicking the Up or Down arrows in the column headers. This allows for multi-column sorting without losing the previous sort. The sorting order is determined by the sequence in which the column headers are selected.
Follow the steps below to sort the data using multiple columns:
- Select the header of the first column and click the Up or Down arrow to sort the data in ascending or descending order.
- Hold down the [Shift] key, then select the header of the second column and click the Up or Down arrow to sort the second column.
- Repeat step 2 to sort the data of any additional column.
For example, first, select the Length column and click the Down arrow to sort the data in descending order. Then, while holding the [Shift] key, select the Inlet Invert Elevation column and click the Up arrow to apply a secondary sort.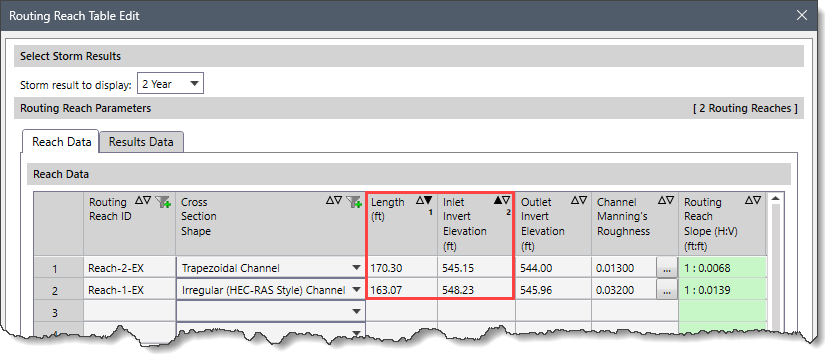
Copying and Exporting Routing Reach Parameters
The data in the Routing Reach Parameters table can be copied to the clipboard or exported as a Microsoft Excel or PDF document by using the right-click context menu commands such as Copy, Copy Table to Clipboard, Export Table to Excel, or Export Table to PDF.
After editing the required routing reach parameters, click the [Close] button to close the Routing Reach Table Edit dialog box.