
Welcome to CivilGEO Knowledge Base
Welcome to CivilGEO Knowledge Base
GIS software uses two basic types of data:
Spatial data consists of the coordinates and identifying information for various spatial elements. Three types of features can be represented on the Map View:
The various physical aspects of the GIS map—watershed boundaries, rivers, sewer pipes, manholes, and so forth—are organized into layers according to their common features.
For example, the collection of points that represent stormwater manholes can be organized into a Manhole layer, the collection of polylines that represent stormwater sewer pipes can be organized into a Pipes layer, and the collection of polygons that represent watershed basins can be organized into a Watersheds layer.
A layer can be either static or thematic. Static layers use the same graphical attributes (color, line width, and so forth) for all features in a layer. Thematic layers can use different graphical attributes to classify the features in the layer. For example, a thematic polygon layer representing watersheds could use different colors to show the composite curve number of each watershed. A thematic polyline layer representing stormwater pipes could use different line widths and/or colors to differentiate between pipe diameters.
The second type of data used in GIS is attribute data. With GIS software, data views can be associated with the Map View through links to the spatial data. For instance, the spatial data might represent a water distribution pipe network and contain information for each pipe, such as when it was installed, last inspected, pipe material (i.e., cast iron, PVC, etc.), pressure rating, roughness coefficient, and so forth.
The Data Explorer panel is used to view the attribute data of elements displayed in the Map View model. Select the element (river reach, cross section, stormwater pipe, manhole, AutoCAD element, etc.) from Map View, and the software will automatically display the corresponding attribute data in the Data Explorer panel.
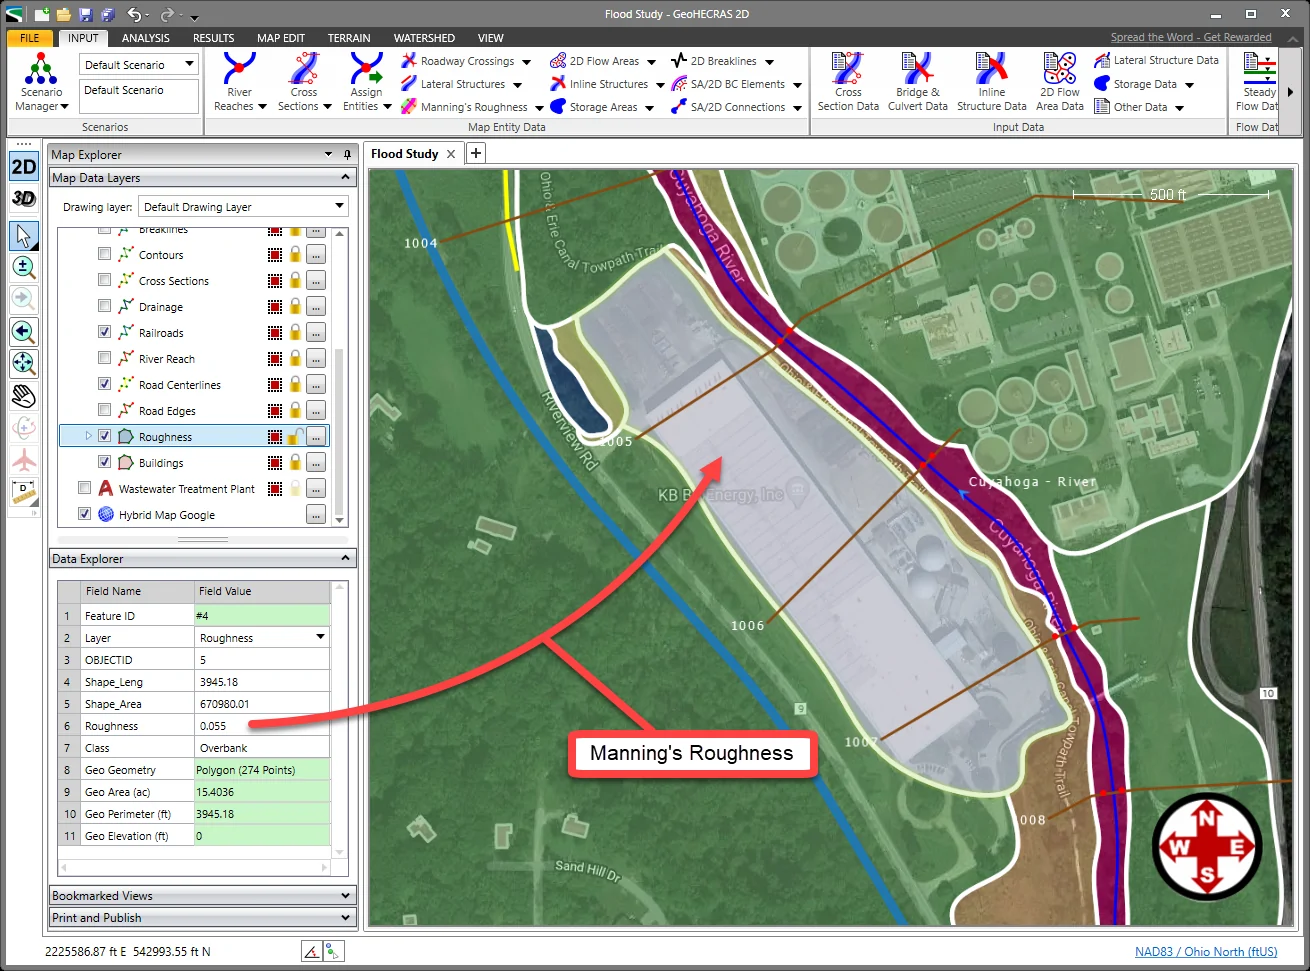
The user can adjust the Data Explorer panel’s height by dragging the top of the panel splitter bar up (or down) to see more information about the selected element.
The Data Explorer contains two columns: the attribute fields (Field Name) of the selected geometric element and the corresponding attribute values (Field Value). The user can edit the attribute data of the selected element—Manning’s roughness value, for example—if the selected element’s layer is unlocked. Note that CAD layers are not editable.
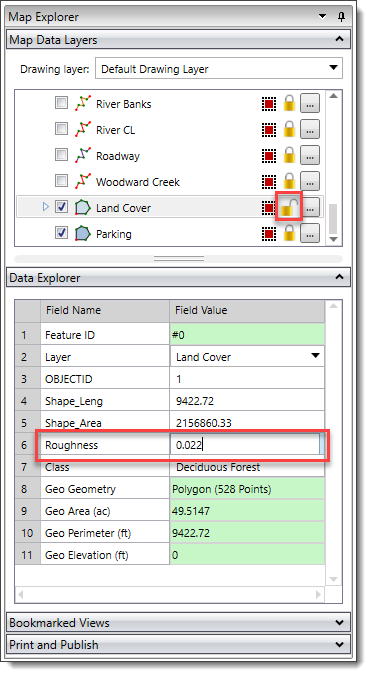
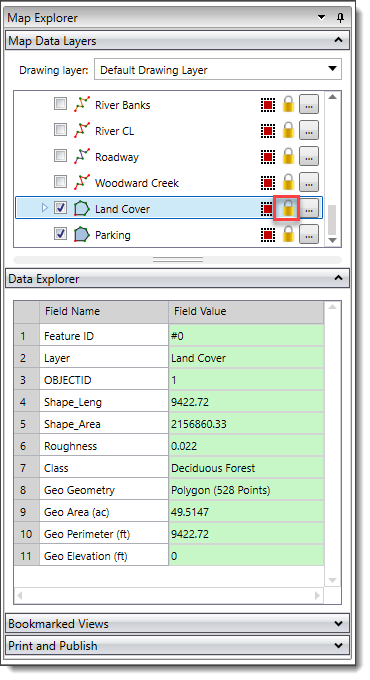
If the selected geometric element’s layer is locked, then the attribute values will be read-only and will appear green.
The following methods can be used to edit the GIS attribute data:
The Attribute Table feature allows you to search, view and edit attribute data independently. The table is useful for working on the elements contained in a specific layer. Refer to this article in our knowledge base to learn more about the Attribute Table feature.
When the project is saved, the software will update any edits to the GIS data.


CivilGEO G2 Reviews
4.8/5.0 Rating, Over 230 Reviews

GeoHECRAS is recognized as the top Civil Engineering Design Software with an average of 4.8 out of 5.0 rating from over 230 real user reviews on G2.


We use cookies to give you the best online experience. By agreeing you accept the use of cookies in accordance with our cookie policy.
When you visit any web site, it may store or retrieve information on your browser, mostly in the form of cookies. Control your personal Cookie Services here.


