1. Home
  2. Knowledge Base
  3. GeoHECRAS
  4. Unsteady Flow Floodplain Encroachments Command

Unsteady Flow Floodplain Encroachments Command

The Unsteady Flow Floodplain Encroachments command computes floodplain encroachment stations for the unsteady flow condition and helps the user to have a better understanding of the true flow effects when attempting to determine the floodway in a complex flow situation. This command allows the user to quickly iterate the encroachment station locations while reviewing the computed results. The incremental water surface rise, floodway top width, and flow velocities at each river cross section are shown, thus allowing the user to deliver the best land development solution.

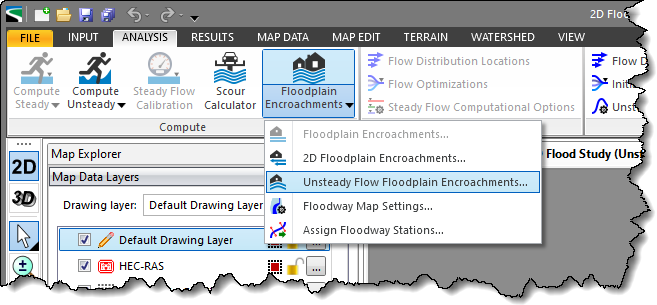
Follow the steps below to use the Unsteady Flow Floodplain Encroachments command:

  1. From the Analysis ribbon menu, select the Floodplain Encroachments dropdown menu and then choose the Unsteady Flow Floodplain Encroachments command.
    Select the Floodplain Encroachments dropdown menu
  2. The Unsteady Flow Floodplain Encroachments dialog box will be displayed.
    Unsteady Flow Floodplain Encroachments dialog box

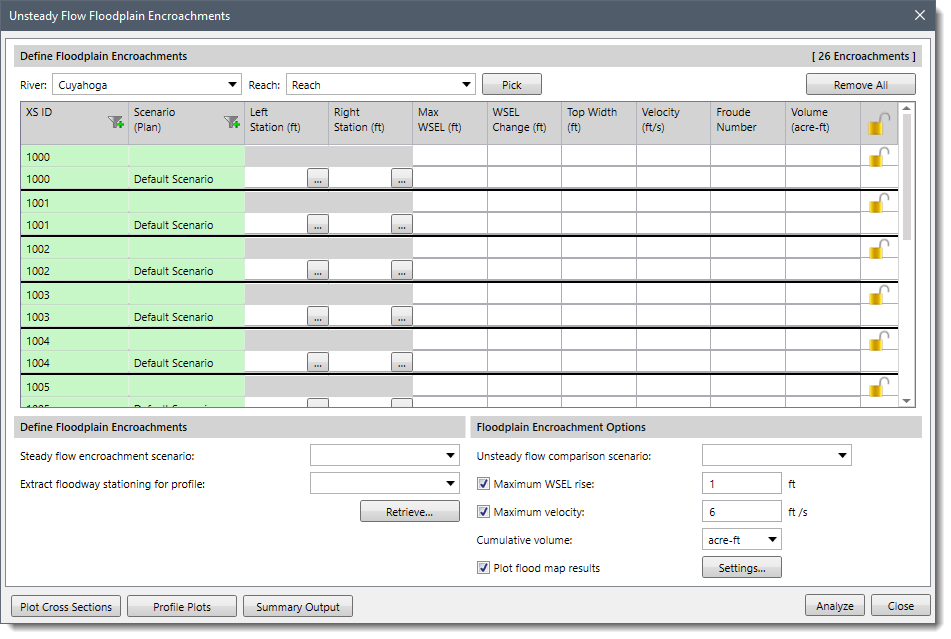
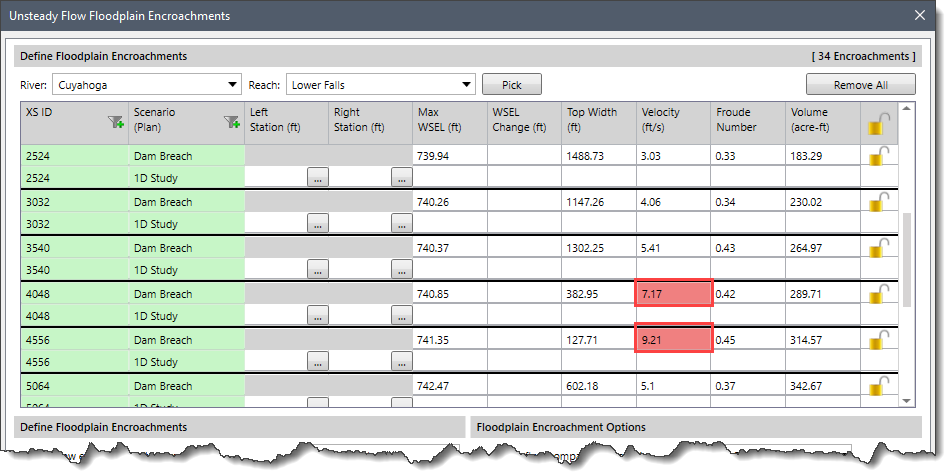
The following sections describe the Unsteady Flow Floodplain Encroachments command and how to interact with the above dialog box.

Defining Floodplain Encroachments

The Define Floodplain Encroachments section lists each of the cross sections in the selected river reaches. The first row for each cross section is the base profile and the encroachment method is not defined for this row. Between each cross-section group within the table, there is a thicker line displayed to denote the cross-section groups.

Note that if the US unit system is selected in the Options backstage page, the US units will be displayed in the Define Floodplain Encroachments section. The user can also change the unit system to metric (SI) unit, if necessary. Refer to this article in our knowledge base to learn more about setting the model units to metric (SI) or US units.

The table in this section contains the following entries:

  • River: This dropdown combo box allows the user to select the river name.
  • Reach: This dropdown combo box allows the user to select the corresponding reach name for each river. Alternatively, the user can click the [Pick] button to select the Reach from the Map View. The [Remove All] button removes the defined unsteady flow floodplain encroachments data for all the cross sections.
  • XS ID: This column lists the cross-section IDs of the selected rivers and corresponding river reaches. Cross sections that are bridges or inline structures will have either Bridge or Inline added after the cross-section ID label. The encroachment values are not defined for these types of cross sections.
  • Scenario (Plan): This column list all the previously defined flow scenarios. By default, the current scenario is shown on opening the dialog box.
  • Left Station (ft): This column is used to define the left encroachment station. Clicking the […] pick button allows the user to select the left floodplain encroachment station location from the Map View.
  • Right Station (ft): This column is used to define the right encroachment station. Clicking the […] pick button allows the user to select the right floodplain encroachment station location from the Map View.
  • Max WSEL (ft): This data column is used to define the maximum water surface elevation.
  • WSEL Change (ft): This data column is used to define the rate of change in water surface elevation.
  • Top Width (ft): This read-only column displays the analysis results for the current cross section and profile. When the user performs a floodplain encroachment analysis by clicking the [Analyze] button, the output results field will be updated in the table.
  • Velocity (ft/s): This read-only column displays the analysis results for the current cross section and profile. When the user performs a floodplain encroachment analysis by clicking the [Analyze] button, the output results field will be updated in the table.
  • Froude Number: This column conveys to the user whether calculation results are getting close to critical depth or super critical flow. If the Froude Number approaches or exceeds the value 1, it means the software is encroaching on the floodplain too hard and the flow is becoming super critical.
  • Volume (acre-ft): This column defines the storage volume of the computed floodplain encroachment analysis.
  • Lock: This column displays an unlocked or locked icon. By default, the unlocked icon is displayed. Clicking on the icon changes its state. When it is unlocked, the encroachment input fields contained within the row group are editable. When it is locked, the encroachment input fields contained within the row group are not editable.

Define Floodplain Encroachments

This section contains the following entries:
Define Floodplain Encroachments section

  • Steady flow encroachment scenario: This dropdown combo box allows the user to select the encroachment scenario of the steady flow. Note that the dropdown combo box entry list only those scenarios that have steady flow data.
  • Extract floodway stationing for profile: This dropdown combo box lists all the floodway profiles defined for the model. The profile numbers in the dropdown combo box are defined in yearly format.
    Extract floodway stationing for profile
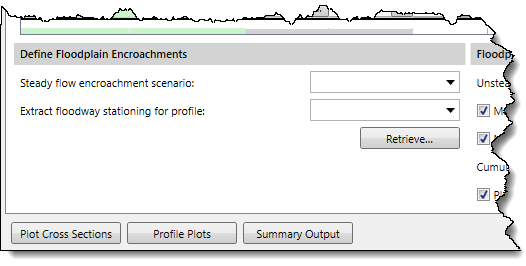
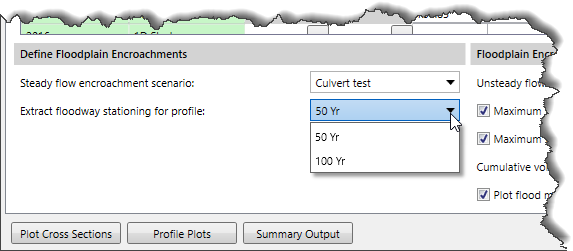
Clicking the [Retrieve] button allows the user to retrieve the floodway stations from the existing steady flow scenario.

Floodplain Encroachment Options

This section allows the user to define other encroachment method options to be used.
Floodplain Encroachment Options section

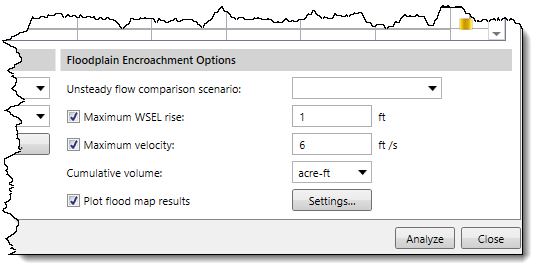
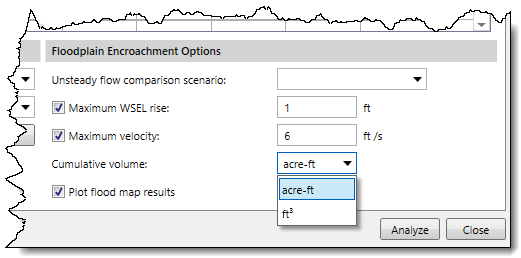
The section contains the following entries:

  • Unsteady flow comparison scenario: This dropdown combo box allows the user to select the encroachment scenario of the unsteady flow. Note that the dropdown combo box list only those scenarios that have unsteady flow data and should not display the current scenario.
  • Maximum WSEL rise: This checkbox entry shows that when the displayed WSEL Change (ft) values are highlighted in a red colored background, the computed value(s) is greater than the defined maximum water surface elevation. By default, this checkbox entry is checked, with a value of 1.00 ft.
  • Maximum velocity: This checkbox entry shows that when the displayed Velocity (ft/s) value(s) is highlighted in a red colored background, the computed value(s) are greater than the defined maximum velocity. This checkbox entry is checked by default, with a value of 6.00 ft/sec.
    Maximum velocity
  • Cumulative volume: This dropdown option is used to select the unit for the volume column. The following two units are provided in the dropdown combo box.
    1. acre-ft
    2. ft3
      Cumulative volume
  • Plot flood map results: This checkbox option is used to plot the flood map results. If this option is checked, then the results are plotted on the Map View. Otherwise, no results are plotted on the Map View. By default, this checkbox option is checked.
    Plot flood map results
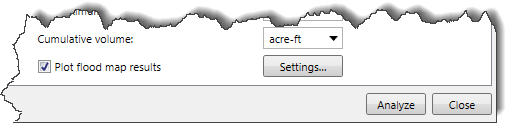
Clicking the [Settings] button will display the Floodway Map Settings dialog box:
    Floodway Map Settings dialog box
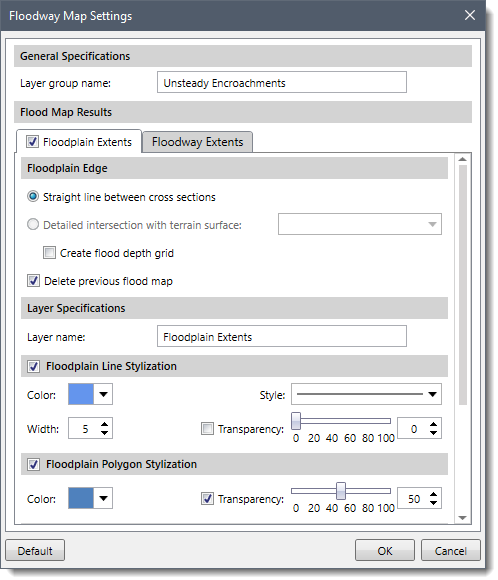
This dialog box allows the user to control how the software will plot the computed floodplain and floodway on the Map View after computing the unsteady flow floodplain encroachment data. Refer to this article in our knowledge base to learn more about floodway map settings.
Once all the values have been defined, click the [Analyze] button. After performing the floodplain encroachment analysis, the software will then display the unsteady flow floodplain encroachment results in the table.

Plot Cross Sections

After analyzing the unsteady flow floodplain encroachments data, the user can use the [Plot Cross Sections] button to view the Plot Cross Sections results. Clicking on the [Plot Cross Sections] button will display the HEC-RAS cross section plots. Refer to this article in our knowledge base to learn more about cross section plots.

Profile Plots

After analyzing the unsteady flow floodplain encroachments data, the user can use the [Profile Plots] button to view the Profile Plots results. Clicking on the [Profile Plots] button will display the water surface profile along the selected river reach. Refer to this article in our knowledge base to learn more about profile plots.

Summary Outputs

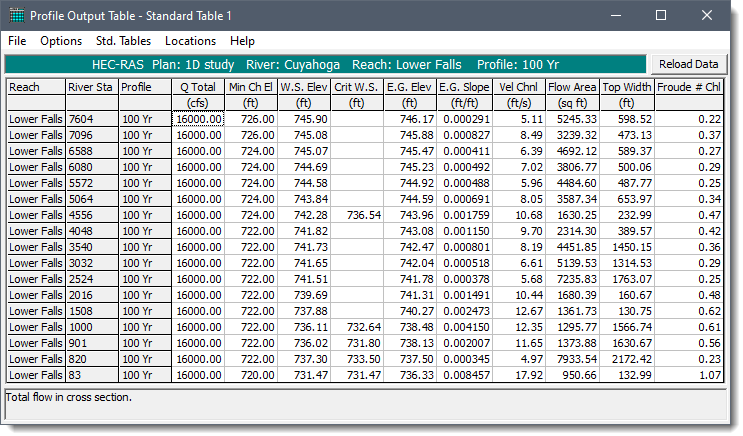
After analyzing the floodplain encroachments data, the user can use the [Summary Output] button to view the Summary Output results. Clicking on the [Summary Output] button will display the HEC-RAS profile summary table.
View the Summary Output results

About the Author cxscvlgeo

  • Was this helpful?
  • YesNo

Was this article helpful?

Related Articles