
Welcome to CivilGEO Knowledge Base
Welcome to CivilGEO Knowledge Base
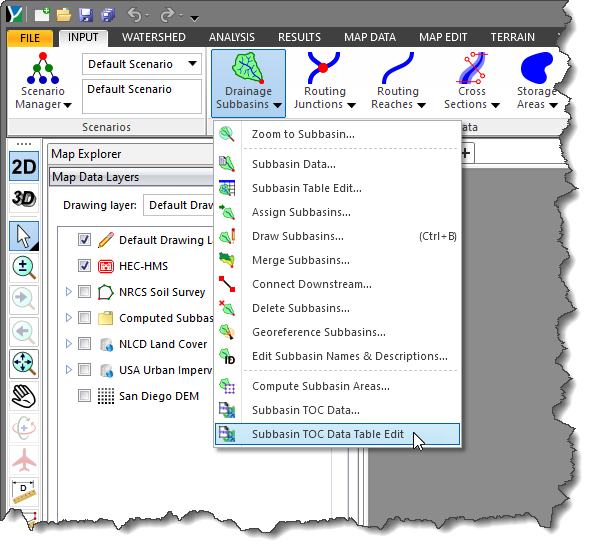
In GeoHECHMS software, after computing the subbasin TOC data using the Subbasin TOC Data command, the Subbasin TOC Data Table Edit command allows the user to view the entire subbasin TOC data in one editable data grid table.
Follow the below steps to use the Subbasin TOC Data Table Edit command:
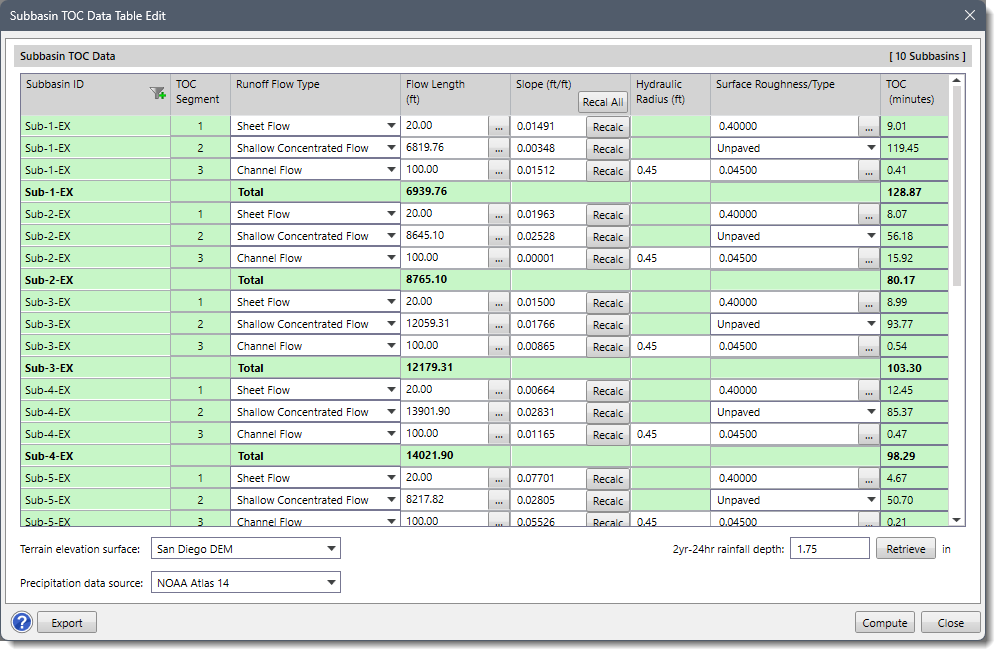
The following sections describe the Subbasin TOC Data Table Edit dialog box.
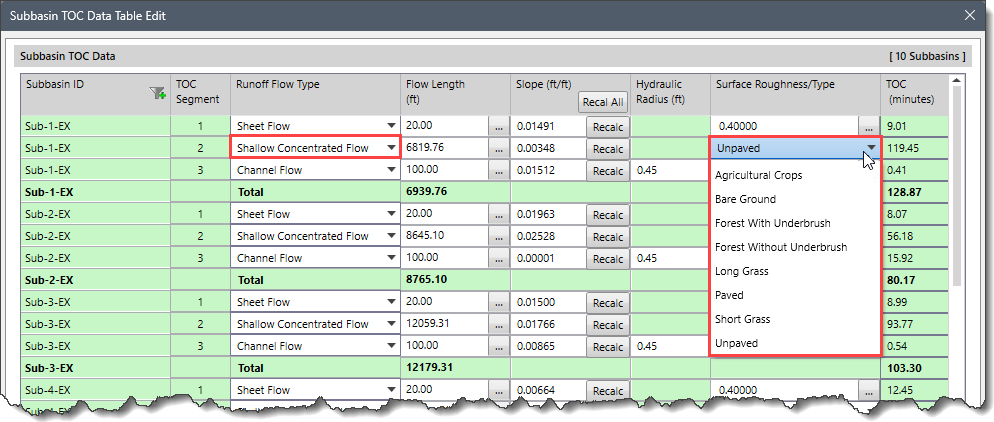
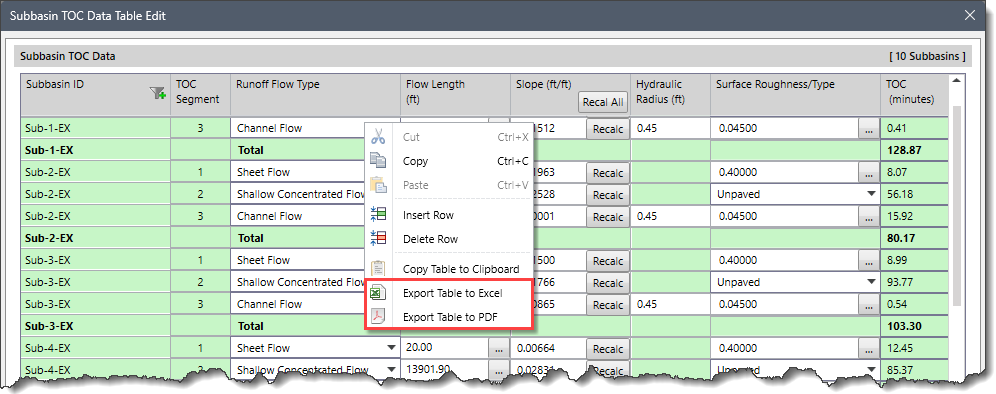
The following data entries are provided in the Subbasin TOC Data editable data grid table.
This data grid column lists the subbasins sorted in alphanumerical order. The user can use the filter option from the column header to limit the subbasins displayed in the data grid.
This data grid column sequentially numbers the TOC segment from most upstream to most downstream segments.
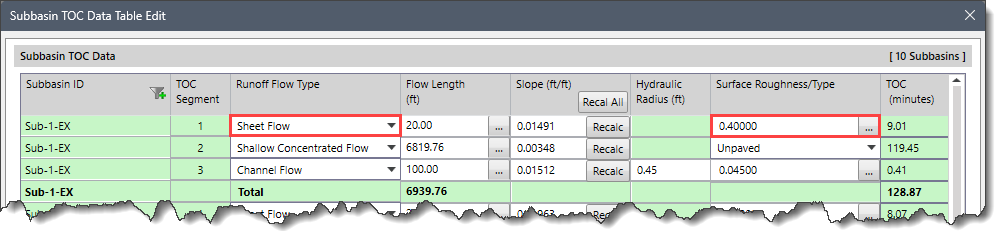
This data grid column dropdown combo box entry lists the available runoff flow types, as listed below.
This data grid column entry represents the length of the TOC segment. Clicking the […] button under this column causes the dialog box to temporarily disappear, allowing the user to measure the flow path segment length from the Map View.
This data grid column entry represents the slope of the TOC segment. If the user has specified a Terrain elevation surface, then the user can measure the Flow Length from the Map View and the software will automatically compute the TOC segment slope.
If no Flow Length is defined, then this entry will be blank. If a Flow Length is specified and no Terrain Elevation Surface is defined, then the default value of slope will be 0.0300.
The user can click the [Recalc] button to recompute the segment slope for the defined flow length and elevation terrain surface. Similarly, the [Recal All] button allows the user to recompute the slope value for all the flow path segments available in the scenario at once.
This data grid column entry will be enabled if Channel Flow is selected as the Runoff Flow Type. The default value of the Hydraulic Radius is 0.45 ft.
This data grid column entry changes its behavior depending upon the Runoff Flow Type selected. When Sheet Flow is selected as the Runoff Flow Type, then an entry field with a lookup […] button will be displayed in the corresponding Surface Roughness/Type column field. If Sheet Flow is selected as the Runoff Flow Type, the default value for the corresponding Surface Roughness/Type column will be 0.4000.
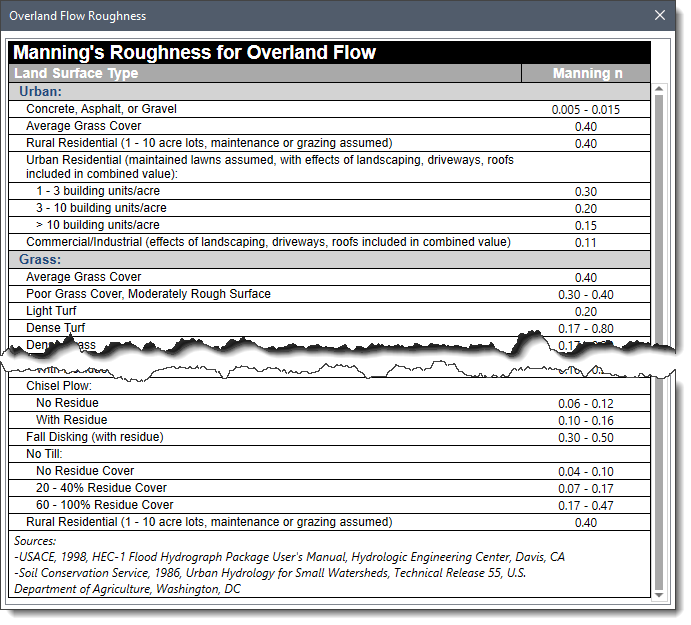
Clicking the […] lookup button under the Surface Roughness/Type column displays the Overland Flow Roughness lookup dialog box.
When Shallow Concentrated Flow is selected as the Runoff Flow Type, then a dropdown combo box will be displayed in the corresponding Surface Roughness/Type column field with the following entries.
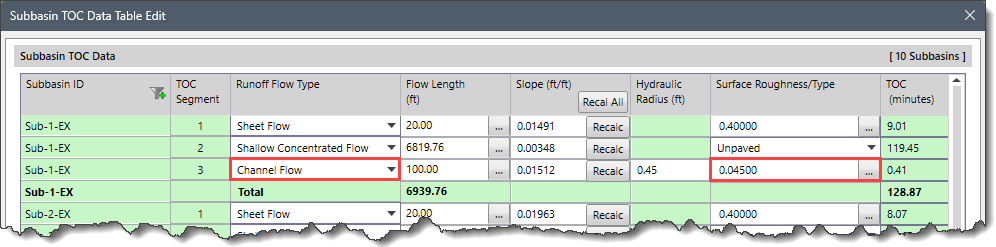
When Channel Flow is selected as the Runoff Flow Type, then an entry field with a lookup […] button will be displayed in the corresponding Surface Roughness/Type column field. If Channel Flow is selected as the Runoff Flow Type, the default value for the corresponding Surface Roughness/Type column will be 0.0450.
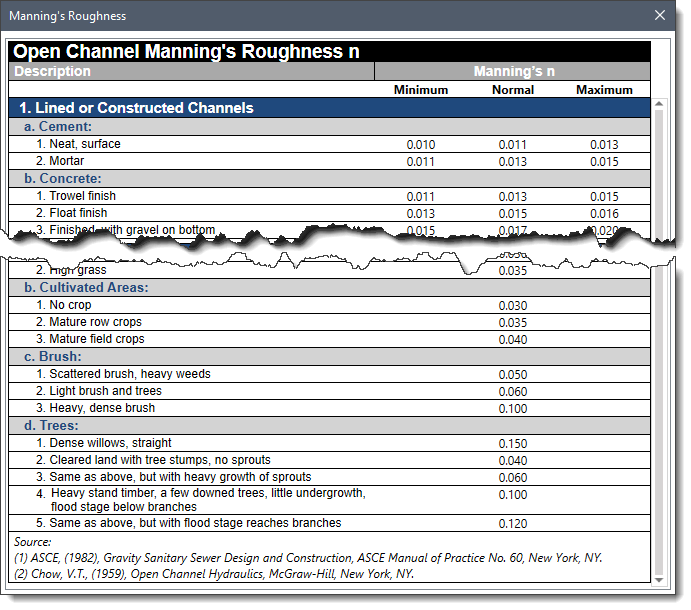
Clicking the […] lookup button under the Surface Roughness/ Type column displays the Manning’s Roughness lookup dialog box.
This data column entry displays the computed Time of Concentration (TOC) value.
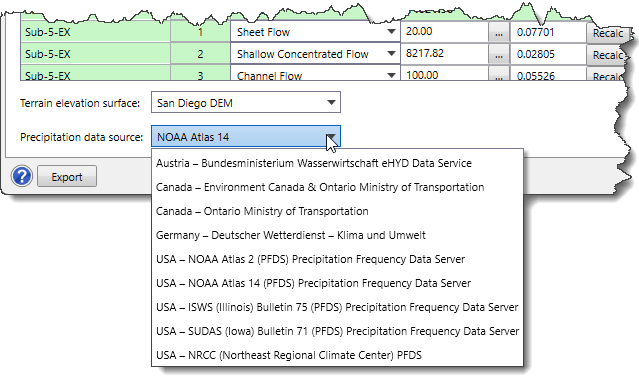
This dropdown entry is used to select the terrain surface available in the project. The dropdown entry by default is set to the current scenario’s terrain surface.
This dropdown entry is used to select the precipitation data source for regions such as Austria, Germany, Ontario (Canada), and the USA.
The available precipitation data source options are:
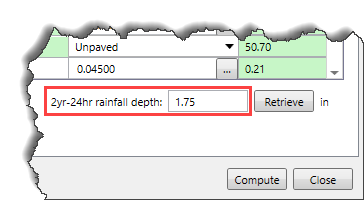
This entry stores the 2-year 24-hour rainfall depth for the sheet flow computations. Clicking the [Retrieve] button retrieves the rainfall data for the selected location.
Note that the data table fields which are not editable are grayed (or colored green) to denote read-only.
After defining or editing the required table value(s), click the [Compute] button to calculate the results of the Subbasin TOC Data table.
After computing the subbasin TOC data, click the [Export] button to export the subbasin TOC tabular data into a spreadsheet. Alternatively, right-click on any of the column headers or editable table cells and select Export Table to Excel or Export Table to PDF command from the context menu to export the data into the desired format.


CivilGEO G2 Reviews
4.8/5.0 Rating, Over 230 Reviews

GeoHECRAS is recognized as the top Civil Engineering Design Software with an average of 4.8 out of 5.0 rating from over 230 real user reviews on G2.


We use cookies to give you the best online experience. By agreeing you accept the use of cookies in accordance with our cookie policy.
When you visit any web site, it may store or retrieve information on your browser, mostly in the form of cookies. Control your personal Cookie Services here.


