
Welcome to CivilGEO Knowledge Base
Welcome to CivilGEO Knowledge Base
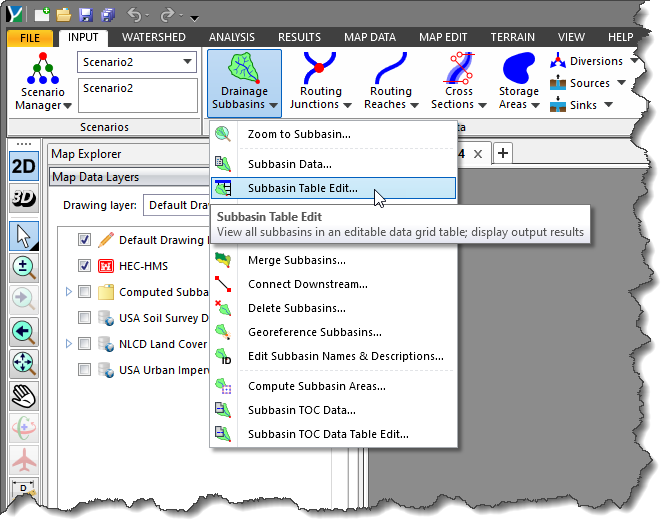
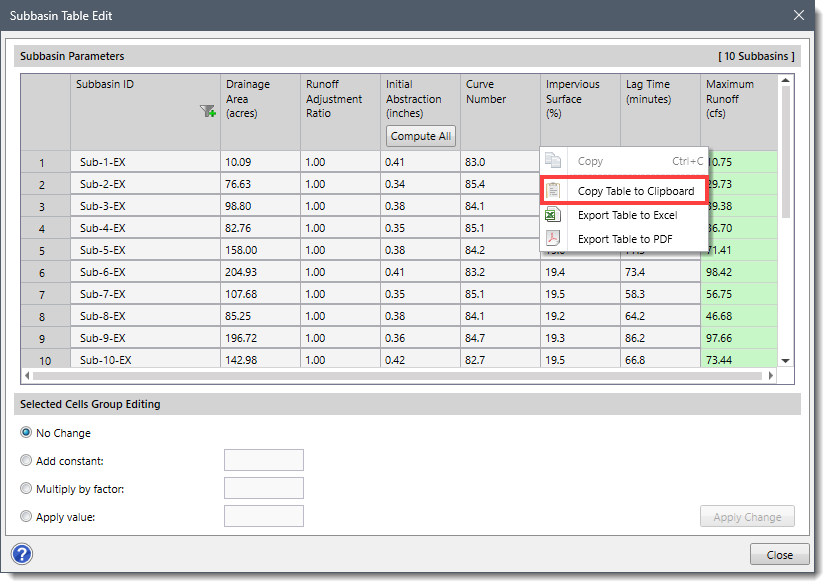
The Subbasin Table Edit command allows the user to edit the subbasin parameters in one dialog box for common hydrology infiltration and runoff methods. When the user selects this command, a modeless dialog box will be displayed. This dialog box contains an editable data grid listing all the subbasins in the current scenario. When the user selects a row in the data grid, the corresponding subbasin will be zoomed to the Map View (if not visible) and highlighted. In addition, the user can select a subbasin from the Map View, and the corresponding row in the data grid will be shown selected.
Follow the steps below to use the Subbasin Table Edit command:
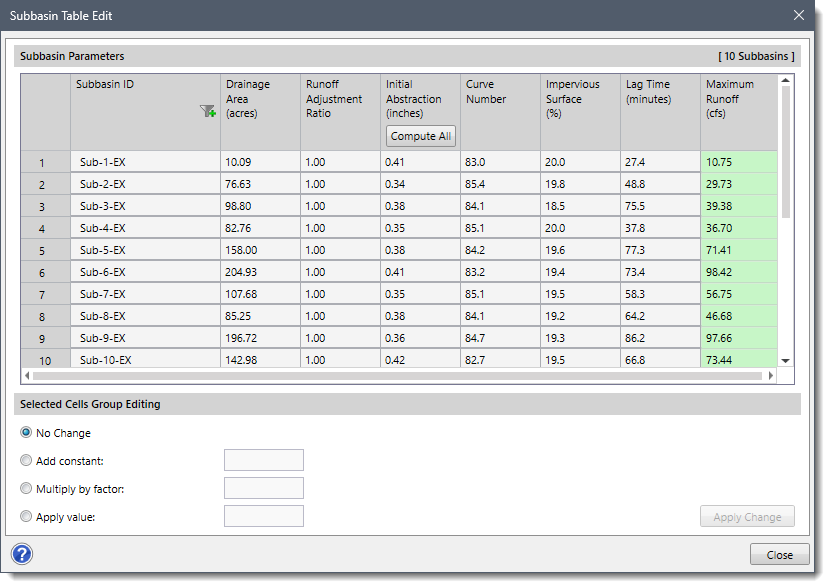
The following sections describe how to use the Subbasin Table Edit command and interact with the above dialog box.
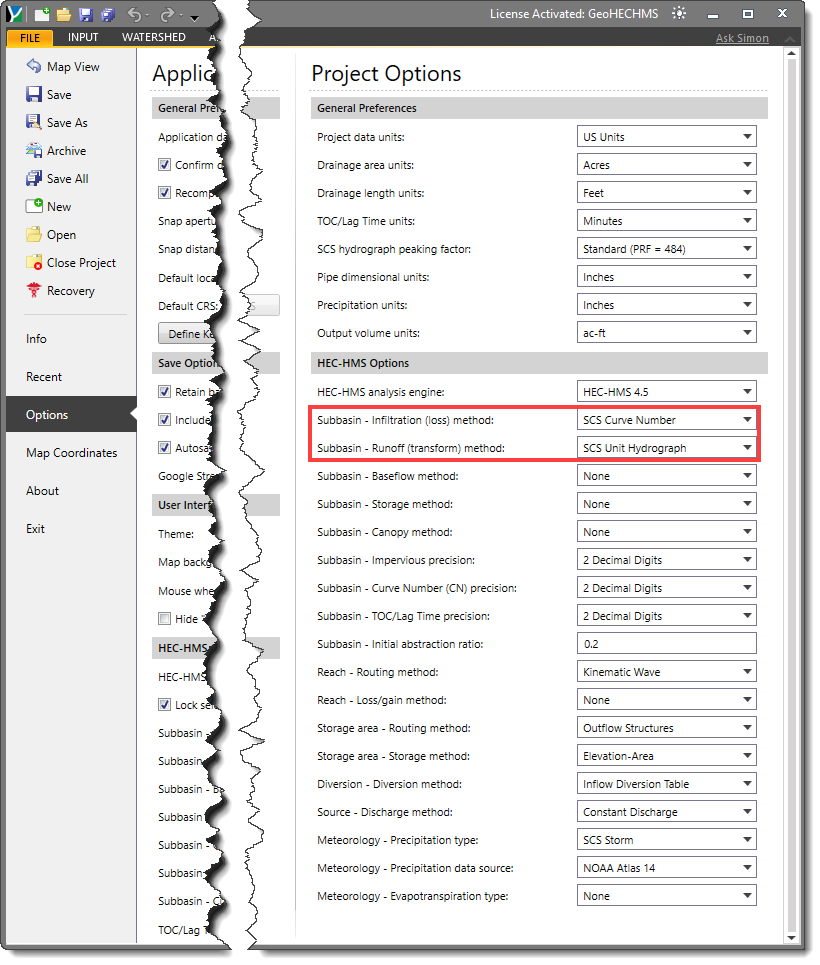
The Subbasin Parameters section will display the editable data grid columns listing the subbasin parameters contained in the current scenario. Based upon the selected hydrology infiltration and runoff methods in the Project Options backstage page, as shown below, the data grid columns listing will be changed.
In general terms, the following column sections will be listed in the data grid:
Note that only the hydrology infiltration and runoff methods selected in the Project Options backstage page will be listed in the data grid if they correspond to the common hydrology infiltration and runoff methods listed below.
The user can select the following infiltration methods from the Project Options backstage page and the associated parameters will be listed in the data grid of the Subbasin Table Edit command:
| Method Name | Data Grid Column Name |
|---|---|
| SCS Curve Number | |
| Green & Ampt | |
| Initial & Constant |
The user can select the following runoff methods from the Project Options backstage page and the associated parameters will be listed in the data grid of the Subbasin Table Edit command:
| Method Name | Data Grid Column Name |
|---|---|
| SCS Unit Hydrograph | |
| Clark Unit Hydrograph | |
| Snyder Unit Hydrograph |
The user can export the data grid column values to Microsoft Excel or PDF documents. To export data into Excel or PDF, right-click in the data grid column and select Export Table to Excel or Export Table to PDF command from the displayed context menu.
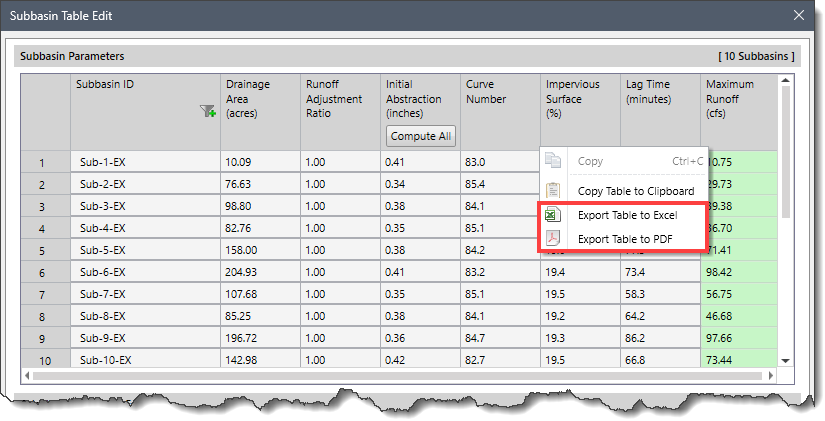
The user can send the data grid column values to the Windows clipboard. Moving a data grid column value to the clipboard allows those values to be pasted into another software application. To transfer the data to the Windows clipboard, right-click in the data grid column and select the Copy Table to Clipboard command from the displayed context menu. The data will automatically be sent to the Windows clipboard.
After editing the desired subbasin parameters for common hydrology infiltration and runoff methods, the user can click the [Close] button to close the dialog box.
The Selected Cells Group Editing section allows the user to edit multiple cells in the Subbasin Parameters editable data grid at once.
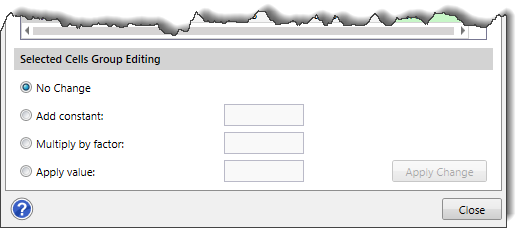
The user can select the desired cells from the editable data grid and then edit the subbasin parameters using one of the following options:
After selecting the preferred option, click on the [Apply Change] button to update the new values in the cells.


CivilGEO G2 Reviews
4.8/5.0 Rating, Over 230 Reviews

GeoHECRAS is recognized as the top Civil Engineering Design Software with an average of 4.8 out of 5.0 rating from over 230 real user reviews on G2.


We use cookies to give you the best online experience. By agreeing you accept the use of cookies in accordance with our cookie policy.
When you visit any web site, it may store or retrieve information on your browser, mostly in the form of cookies. Control your personal Cookie Services here.


