
Welcome to CivilGEO Knowledge Base
Welcome to CivilGEO Knowledge Base
Subbasins are represented by drainage area polygons that produce the runoff that drain into other elements in the model. Runoff (Transform) methods are used to transform the excess precipitation (after the losses have been subtracted) into surface runoff (direct runoff). Several runoff methods are available to use including unit hydrograph methods and kinematic wave implementation.
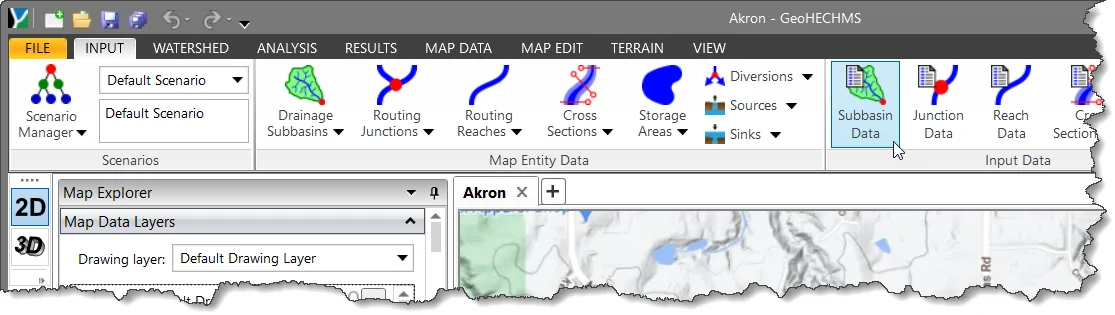
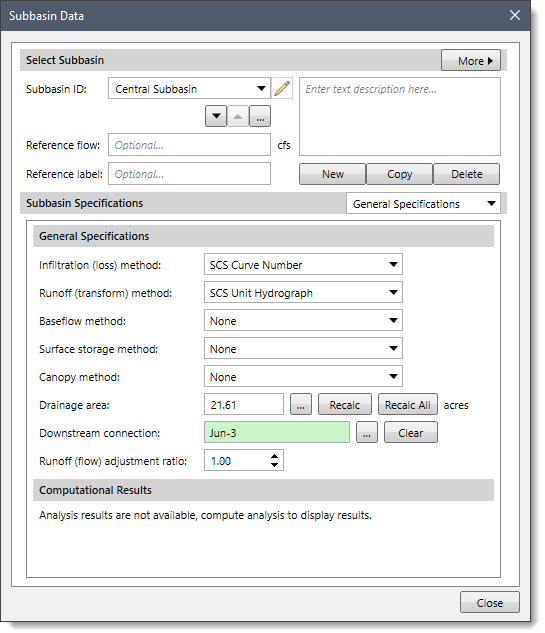
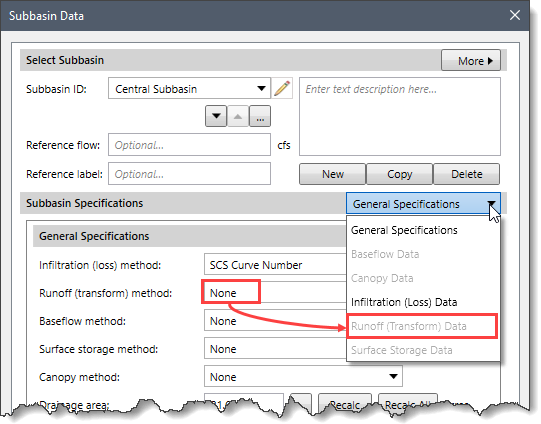
In GeoHECHMS, the runoff method for a subbasin can be selected from the General Specifications section of the Subbasin Data dialog box.
Follow the steps given below to select a runoff method:
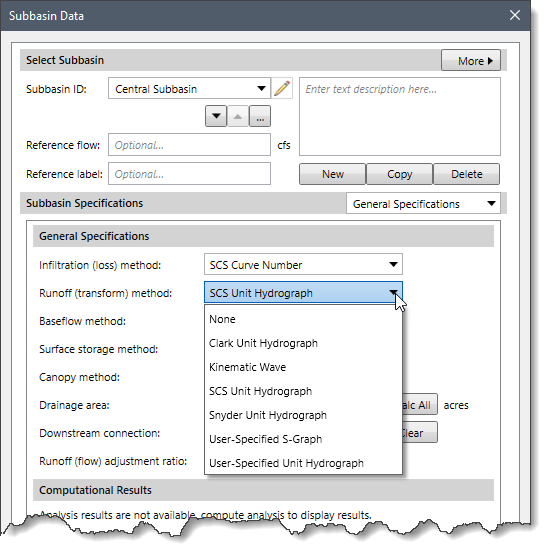
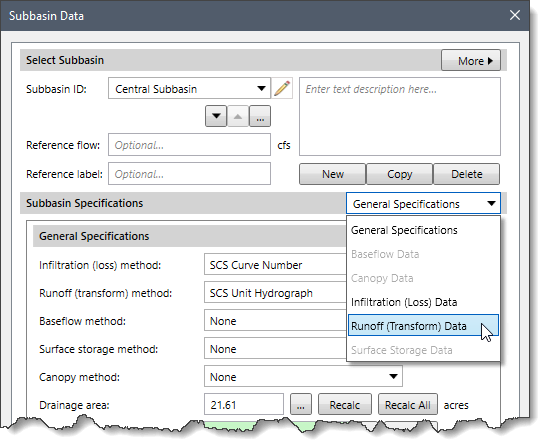
The following sections describe the different runoff methods and how to enter the parameters for each method in the Runoff (Transform) Data panel.
When None is selected for the Runoff (Transform) Method, then the Runoff (Transform) Data dropdown combo box entry is disabled (i.e., grayed out).
The Clark Unit Hydrograph is a synthetic unit hydrograph method. This means that the user is not required to develop a unit hydrograph through analysis of past observed hydrographs. Instead, a time versus area curve (time-area curve) is used to develop the translation hydrograph resulting from a burst of precipitation. The resulting translation hydrograph is routed through a linear reservoir to account for storage attenuation effects across the subbasin.
When Clark Unit Hydrograph is selected for the Runoff (Transform) Method, the following data panel will be displayed.
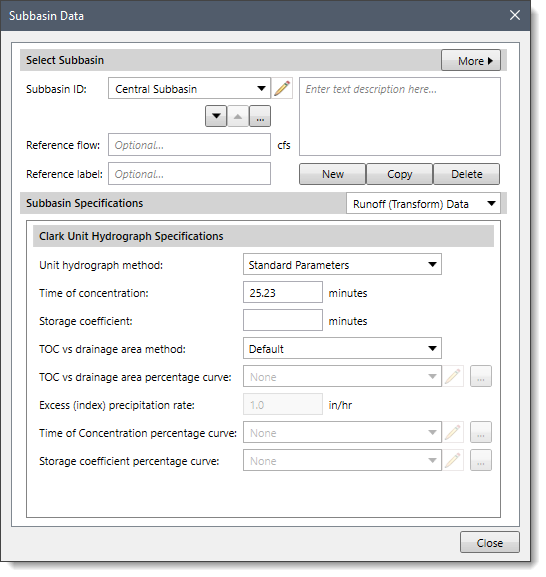
The following input parameters are provided in the data panel:
The Unit hydrograph method dropdown combo box entry allows the user to select the method for the Clark unit hydrograph. There are two options available: Standard Parameters and Variable Parameters. Based on the option selected, the different entry fields become either enabled or disabled in the data panel.
On selecting this option, the following entries are available to the user:
The Time of concentration entry field allows the user to define the maximum travel time in the subbasin.
The Storage coefficient entry field allows the user to enter the storage coefficient, which is used in the linear reservoir that accounts for storage effects.
The TOC vs drainage area method entry field allows the user to define the time area method. There are two options available:
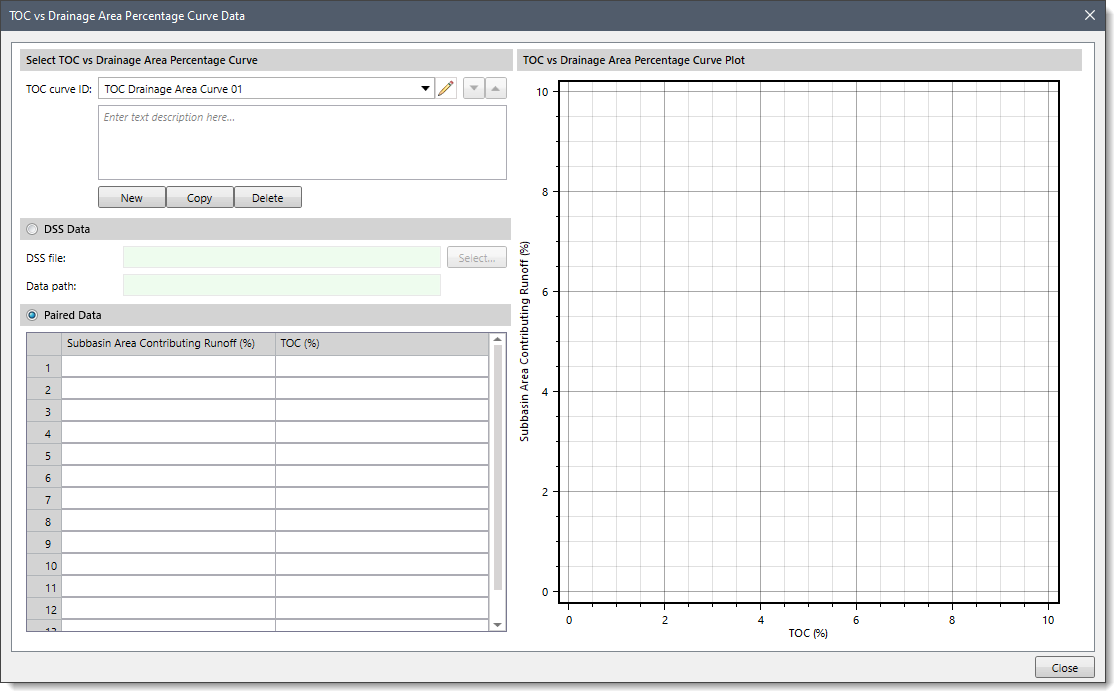
The TOC vs drainage area percentage curve dropdown combo box allows the user to select an already defined percentage curve. Note that this dropdown combo box is only enabled when the Percentage Curve option is selected for the TOC vs Drainage Area Method entry. Otherwise, this dropdown combo box is disabled (e.g., grayed out). Clicking on the […] button will display a Percentage Curve Data dialog box, which allows the user to define a new user-defined percentage curve.
On selecting this option, the following additional entries (shown in the red rectangle box) get enabled in the data panel.
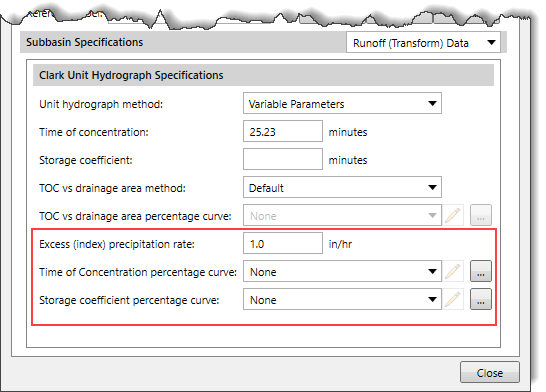 The user must enter the data for the Time of concentration, Storage coefficient, TOC vs drainage area method and the following additional entries:
The Excess (index) precipitation rate entry field allows the user to enter the excess (index) precipitation rate. This value represents the excess precipitation rate, which is used to relate the Time of Concentration and Storage Coefficient against the Concentration Curve and Storage Curve for the variable unit hydrograph method.
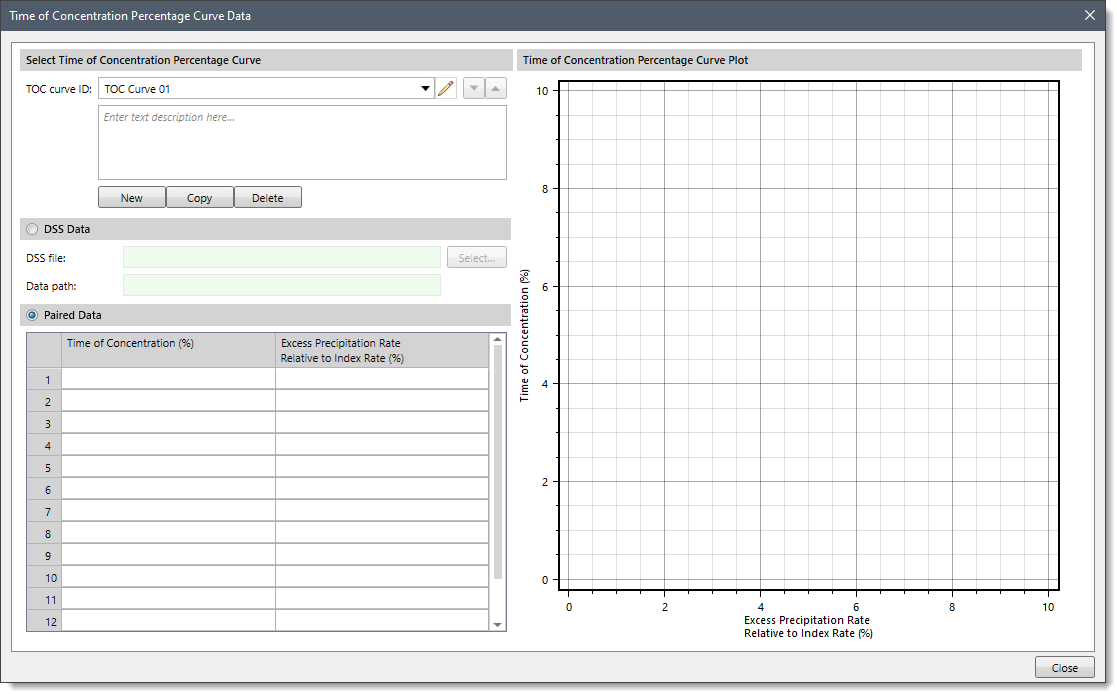
The Time of concentration percentage curve dropdown combo box allows the user to select an already defined percentage curve. Clicking on the […] button will display a Time of Concentration Percentage Curve Data dialog box, which allows the user to define a new user-defined percentage curve.
The Storage coefficient percentage curve dropdown combo box allows the user to select an already defined percentage curve. Clicking on the […] button will display the Storage Coefficient Percentage Curve Data dialog box, which allows the user to define a new user-defined percentage curve.

The Kinematic Wave method is designed principally for representing urban areas, although it can be used for undeveloped regions as well. It is a conceptual model that includes one or two representative surface areas. Typically, one surface area is used for impervious surfaces and one for pervious surfaces. Separate canopy, surface, and loss rate information is required for each surface area and is entered separately. The kinematic wave equations are used to calculate runoff for each surface area and then a weighted composite runoff is calculated using the representative percentage for each surface area.
The composite runoff is directed to a subcollector, which is used to represent primary collection in the stormwater management system. The most common collection system is represented by gutters along streets. In areas without gutters, unlined ditches next to the street may perform a similar stormwater collection function. The composite runoff is applied to the subcollector as a uniform lateral boundary condition, with scaling based on the representative area of a typical subcollector. Water is routed through a representative subcollector using the kinematic wave equations. There is no seepage from the subcollector so it may be difficult to use for representation of vegetated swales and other types of best management practices.
The outflow from the representative subcollector is directed to a collector, which is used to represent the next step up in the stormwater management system. Conceptually, the collector receives inflow from multiple gutters or ditches. The outflow from the subcollector is scaled up using the representative area of a typical collector and applied to the collector as a uniform lateral boundary condition. Water is routed through a representative collector using the kinematic wave equations. Again, there is no seepage from the collector.
The outflow from the representative collector is directed to a channel. The channel may be used to represent the final step in the stormwater management system, or alternatively, may be used to represent the river passing through the subbasin. Conceptually, the channel receives inflow from multiple collectors. The outflow from the representative collector is scaled up using the area of a typical collector and the area of the subbasin. The scaled flow is applied to the channel as a uniform lateral boundary condition. Water is routed through the channel to become the outflow from the subbasin.
When Kinematic Wave is selected for the Runoff (Transform) Method, the following data panel will be displayed.
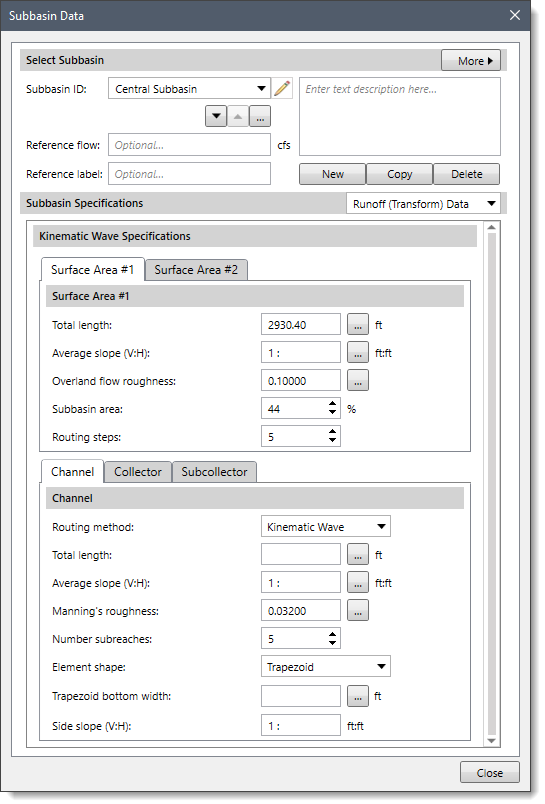
The following input parameters are provided for the Surface Area #1 panel.
The Total length entry field allows the user to enter the length of the surface area. For impervious areas, this should be the average flow length from the point where precipitation falls, to where the runoff first enters a collection gutter or channel. For pervious areas, this should likewise be the average flow length. When using the two surface areas, it is helpful to adopt a convention for which the surface area number (one or two) represents the pervious area. Clicking on the […] Measure button allows the user to select the length from the subbasin surface area to the collection network within the subbasin from the Map View.
The Average slope (V:H) entry field allows the user to enter the average basin slope along the flow line from the point where precipitation falls to where the runoff first enters a gutter or channel. Clicking on the […] Measure button allows the user to select the basin slope from the subbasin outlet along the main watercourse, to a point opposite the subbasin centroid on the Map View.
The Overland flow roughness entry field allows the user to define Manning’s roughness coefficient for the overland flow surface areas. Clicking on the […] lookup button will display an Overland Flow Roughness lookup table dialog box.
The Subbasin area entry field allows the user to enter the percentage of the subbasin area occupied by each surface area. If the user wants to use one surface area, then enter 100 for the first surface area and 0 for the second. Note that as the user changes this value, the Subbasin area spin control in the Surface Area #2 panel changes accordingly. The two spin controls always add up to 100%. So, setting this value to 20% will set the spin control in the Surface Area #2 panel to 80%.
The Routing steps entry field allows the user to enter the number of routing steps. The software uses the routing steps as a prompt to determine the correct distance step to use during runoff calculations. By default, the software uses a value of 5. However, the user can enter a different value ranging from 5 to 99.
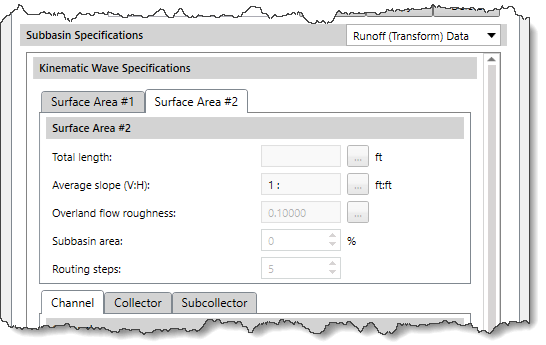
Note that this panel is the same as the Surface Area #1 panel. If the user has defined the Subbasin area in the Surface Area #1 panel as 100%, then the fields provided in the Surface Area #2 panel are disabled (i.e., grayed out).
The composite runoff is directed to a subcollector. The following input parameters are provided for the Subcollector panel.
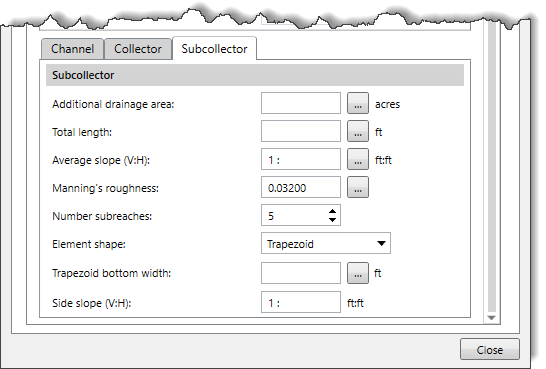
The Additional drainage area entry field allows the user to enter the area of the subcollector. This entry is used to determine how to apply the composite outflow from the subcollector to the collector channel. Clicking on the […] Measure button allows the user to draw an outline of the collector area, which prompts the software to measure the drainage area from the Map View.
The Total length entry field allows the user to enter the flow length. The length should be the average distance from the starting point of the subcollector to the point at which it will enter a collector.
The Average slope (V:H) entry field allows the user to enter the average slope along the average flow length.
The Manning’s roughness entry field allows the user to enter the roughness coefficient, which should be the average value for the entire subcollector.
The Number subreaches entry field allows the user to enter the number of subreaches, a value which the software uses to determine the correct distance step to use during routing calculations.
The Element shape dropdown combo box allows the user to specify the cross section shape. The dropdown combo box lists circular pipe, deep rectangle, rectangle, trapezoid, and triangle shapes.
Based upon the shape selected, additional information will be needed to describe the dimensions of the cross section shape. This information may include a diameter (circular pipe), channel width (deep rectangle, rectangle), bottom width (trapezoid), or side slope (trapezoid, triangle).
The outflow from the subcollector enters a collector as lateral inflow. The collector channel is intended to represent small ditches or open channels that are part of an engineered stormwater management system. The parameters for the collector are exactly the same as for the subcollector.
The Length, Slope, Manning’s roughness, Number subreaches, and Element shape all have the same definitions. The drainage area served by a typical collector must be entered. This value is used to apply lateral inflow from the collector to the main channel.
The outflow from the representative collector is directed to a channel. The following input parameters are provided in the Channel panel.
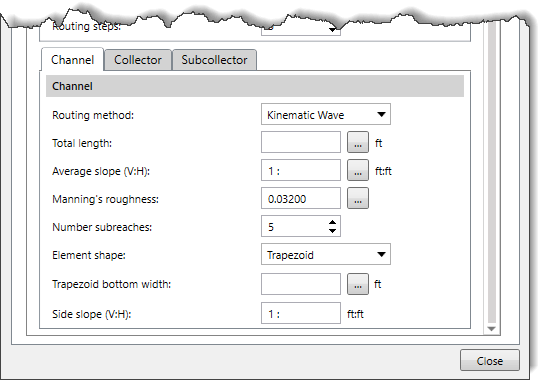
The Routing method dropdown combo box allows the user to select the routing method. There are two options available: Kinematic Wave and Muskingum Cunge. The runoff on the two surface areas is always routed using the kinematic wave method. However, the user may choose to use Muskingum-Cunge routing in the subcollector, collector, and main channel. All three channels use the same method.
The Total length entry field allows the user to specify the flow length within the subbasin to the outlet. Clicking on the […] Measure button allows the user to select length within the subbasin from the Map View.
The Average slope (V:H) entry field allows the user to enter the average slope for the whole channel. Clicking on the […] Measure button allows the user to select the basin slope from the subbasin outlet along the main watercourse, to a point opposite the subbasin centroid on the Map View.
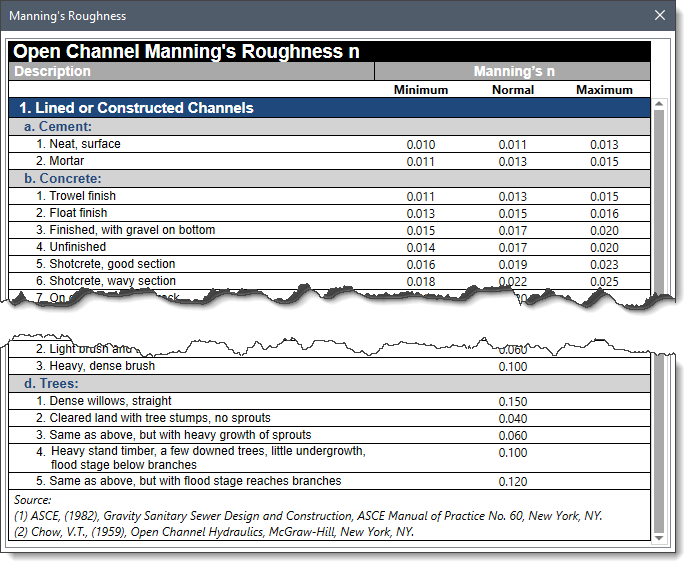
The Manning’s roughness entry field allows the user to enter the Manning’s roughness value for the whole channel. Clicking on the […] lookup button will display a Manning’s Roughness lookup table dialog box.
The Number subreaches entry field allows the user to enter the number of subreaches, which is used to determine the distance step to use during routing calculations. By default, the software uses a value of 5. However, the user can enter a different value ranging from 2 to 99. Note that when the Muskingum Cunge routing method is selected, then this entry is disabled (i.e., grayed out).
The Element shape dropdown combo box allows the user to specify the cross section shape. If the Kinematic Wave routing method is selected, the dropdown combo box lists Circular Pipe, Deep Rectangle, Rectangle, Trapezoid, and Triangle options. When the Muskingum-Cunge routing method is selected, the dropdown combo box lists 8-Point Cross Section, Circular Pipe, Rectangle, Trapezoid, and Triangle.
Based upon the shape selected, additional information will be needed to describe the dimensions of the cross section shape. This information may include a diameter (circular pipe), channel width (deep rectangle, rectangle), bottom width (trapezoid), side slope (trapezoid, triangle), or left and right overbank Manning’s n (8-point cross section shape).
The Trapezoid bottom width entry field allows the user to enter the channel bottom width.
The Side slope (V:H) entry allows the user to enter the channel side slope. The side slope is dimensionless and entered as the units of horizontal distance per one unit of vertical distance.
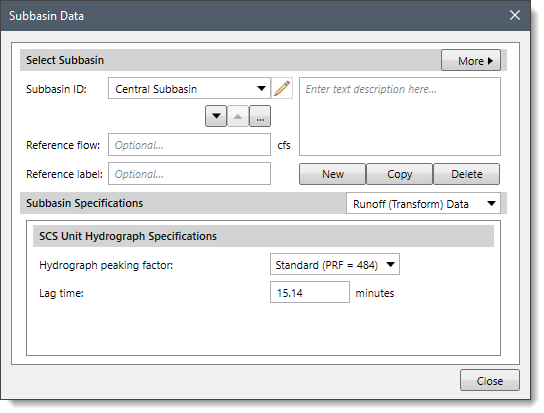
The Soil Conservation Service (SCS) unit hydrograph method defines a curvilinear unit hydrograph by first setting the percentage of the unit runoff that occurs before the peak flow (NRCS, 2007). A triangular unit hydrograph can then be fit to the curvilinear unit hydrograph so that the total time base of the unit hydrograph can be calculated. The standard unit hydrograph is defined with 37.5% of unit runoff occurring before the peak flow. This definition corresponds to a peak rate factor of 484, which incorporates the percentage of unit runoff before the peak, calculated total time base, and unit conversions when applying the equations within the US Customary unit system.
When SCS Unit Hydrograph is selected for the Runoff (Transform) Method, the following data panel will be displayed.
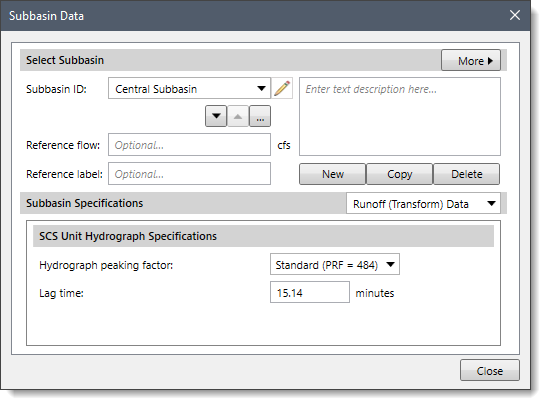
The following input parameters are provided in the data panel:
The Hydrograph peaking factor dropdown combo box allows the user to select the peaking factor, which essentially controls the volume of water on the rising and recession limbs. By default, the Standard (PRF=484) option is selected.
The Lag time entry field allows the user to enter the lag time, which is defined as the length of time between the centroid of precipitation mass and the peak flow of the resulting hydrograph.
The Snyder Unit Hydrograph method is a synthetic unit hydrograph method. The original methodology only supported computing the peak flow as the result of a unit of precipitation. Later, equations were developed to estimate the time base of the hydrograph and the width at 50% of the peak flow. Because the Snyder method does not compute all ordinates of the hydrograph, a Clark hydrograph is constructed in such a way that the Snyder properties are maintained.
When Snyder Unit Hydrograph is selected for the Runoff (Transform) Method, the following data panel will be displayed.
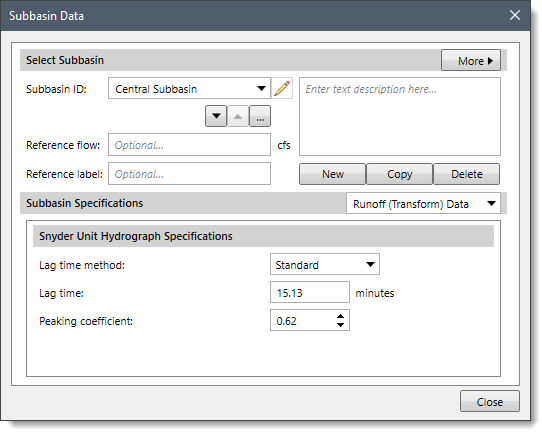
The following input parameters are provided in the data panel:
The Lag time method dropdown combo box allows the user to select the lag time method. There are three options available: Standard, Ft Worth District, and Tulsa District. Based on the option selected, the content of this panel changes to define additional data.
On selecting this option, the following entries are available to the user:
The Lag time entry field allows the user to enter the lag time.
The Peaking coefficient entry field allows the user to enter the peaking coefficient, which is used to measure the steepness of the hydrograph that results from a unit of precipitation.
On selecting this option, the following input parameters will be displayed.
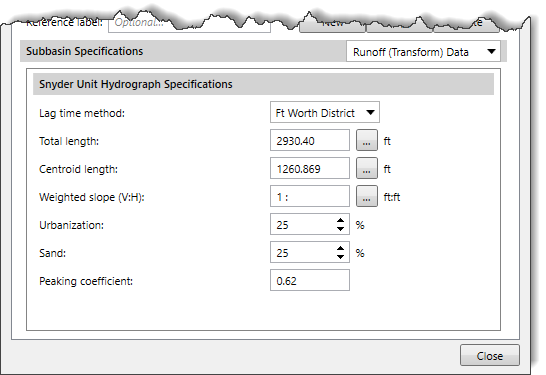
The Total length entry field allows the user to enter the length from the point of the outlet of the subbasin, along the main watercourse to the most hydraulically remote point on the subbasin boundary. Clicking on the […] Measure button allows the user to select the length from the Map View.
The Centroid length entry field allows the user to enter the length from the outlet of the subbasin, along the main watercourse, to a point opposite the subbasin centroid. Clicking on the […] Measure button allows the user to select the length from the Map View.
The Weighted slope (V:H) entry field allows the user to enter the weighted slope. The weighted slope is the slope of the main watercourse between points located at 10 percent and 85 percent of the length of the main watercourse, measured from the subbasin outlet. Clicking on the […] Measure button allows the user to select the basin slope from the subbasin outlet along the main watercourse, to a point opposite the subbasin centroid on the Map View.
The Urbanization spin control allows the user to enter the urbanization percentage. This percentage is estimated as the percentage of the subbasin where the drainage system has been improved to carry runoff more efficiently to the outlet. By default, the software uses a value of 25. However, the user can enter a different value ranging from 0 to 100.
The Sand spin control allows the user to enter the sand percentage. Zero percent indicates essentially all-clay soils with characteristically low infiltration rates. Conversely, 100 percent indicates essentially all-sandy soils with characteristically high infiltration rates. By default, the software uses a value of 25. However, the user can enter a different value ranging from 0 to 100.
The Peaking coefficient entry field is estimated by another method and entered directly. The Ft Worth District method does not include estimation of the peaking coefficient.
On selecting this option, the following input parameters will be displayed.
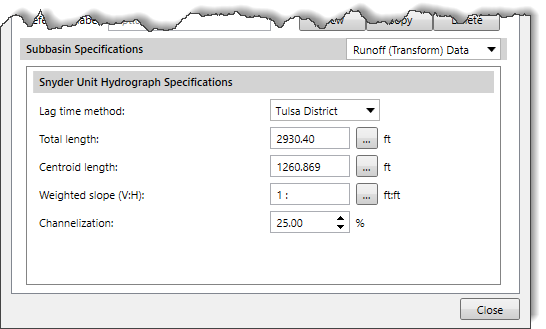 Note that all the input parameters of this method are similar to the Ft Worth District method, except for the following entry:
The Channelization spin control allows the user to enter the percentage of channelization. This percentage is estimated as the percentage of the subbasin where the drainage system has been improved to carry runoff more efficiently to the outlet. By default, the software uses a value of 25. However, the user can enter a different value ranging from 0 to 100.
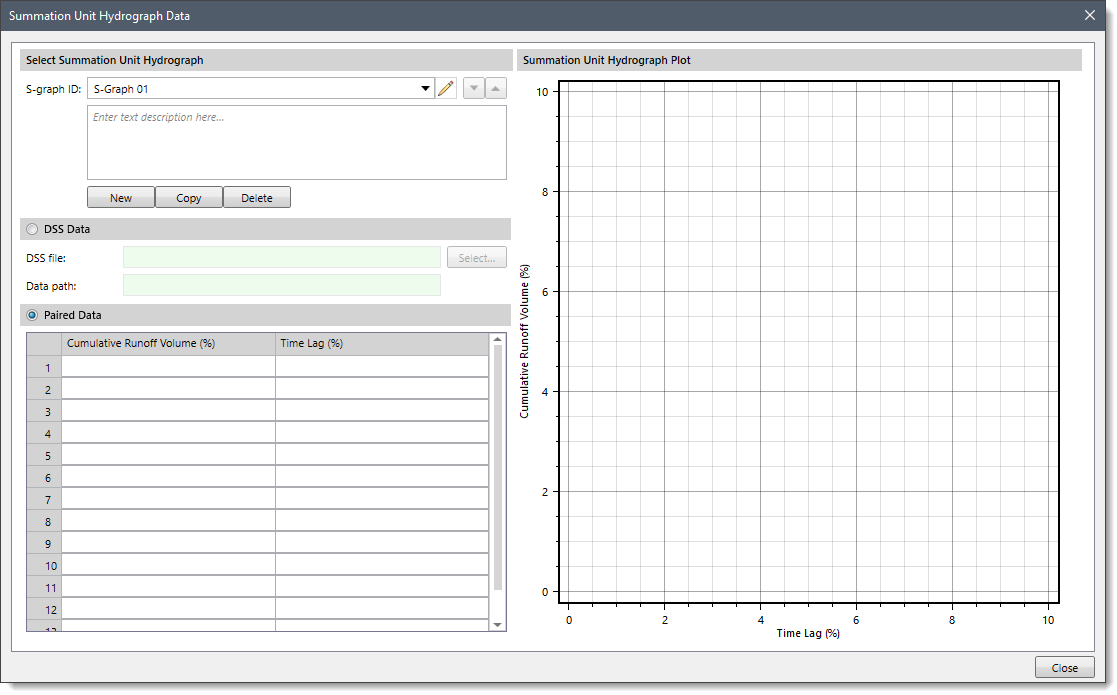
The User-Specified S-Graph method is not synthetic. It uses a special summation unit hydrograph (s-graph) to represent the response of a subbasin to a unit of precipitation. The s-graph is defined with the percentage of the time lag as the independent variable (x-axis), and the percentage of the cumulative runoff volume as the dependent variable (y-axis). Computationally, the s-graph is scaled by a specified time lag and then successive differences are taken along the curve to compute a unit hydrograph directly from the scaled s-graph.
When User-Specified S-Graph is selected for the Runoff (Transform) Method, the following data panel will be displayed.
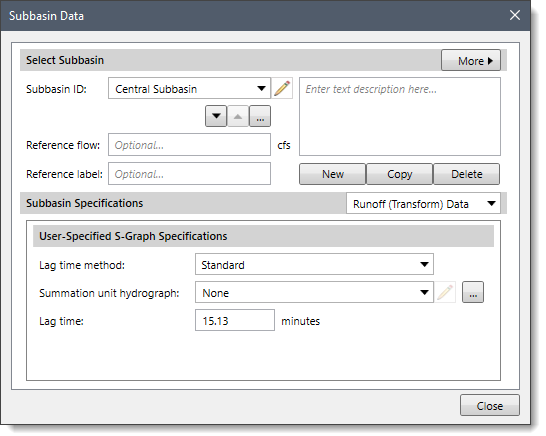
The following input parameters are provided in the data panel:
The Lag time method dropdown combo box allows the user to select the lag time method. There are two options available: Standard and Regression. Based on the option selected, the content of this panel changes to define additional data.
On selecting this option, the following entries are available to the user:
The Summation unit hydrograph dropdown combo box allows the user to select an already defined summation unit hydrograph (s-graph). Clicking on the […] button will display a Summation Unit Hydrograph Data dialog box, which allows the user to define a new user-defined summation unit hydrograph.
The Lag time entry field allows the user to enter the lag time.
On selecting this option, the following input parameters will be displayed.
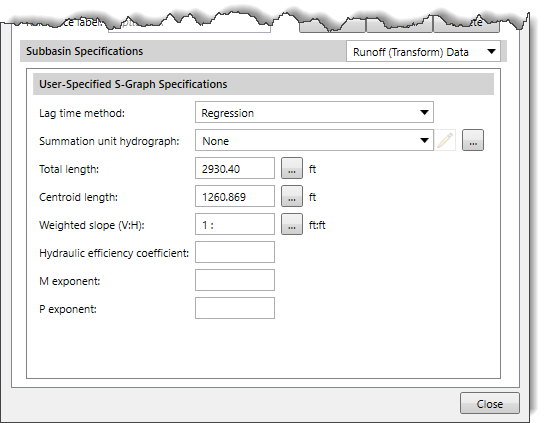
The Total length entry field allows the user to enter the length of the longest flow path in the subbasin. Clicking on the […] Measure button allows the user to select the length from the Map View.
The Centroid length entry field allows the user to enter the length along the stream from the outlet to a point opposite the centroid. Clicking on the […] Measure button allows the user to select the length from the Map View.
The Weighted slope (V:H) entry field allows the user to enter the slope of the stream. Clicking on the […] Measure button allows the user to select the basin slope from the subbasin outlet along the main watercourse, to a point opposite the subbasin centroid on the Map View.
The Hydraulic efficiency coefficient entry field allows the user to enter the hydraulic efficiency of the stream channel.
The M exponent entry field allows the user to enter the M exponent value. This value should be determined through a regional regression study of watershed properties and observed lag time.
The P exponent entry field allows the user to enter the P exponent value. This value should be determined through a regional regression study of watershed properties and observed lag time.
The User-Specified Unit Hydrograph method is not synthetic. Consequently, a separate unit hydrograph must be developed for each subbasin. Ideally, these unit hydrographs are developed from multiple storm observations when precipitation and flow have been measured at similar time intervals. The unit hydrograph developed in this manner has a so-called duration that is equal to the duration of excess precipitation. For example, a 3-hour duration unit hydrograph is generated by a precipitation event with 3 hours of excess precipitation.
When User-Specified Unit Hydrograph is selected for the Runoff (Transform) Method, the following data panel will be displayed.
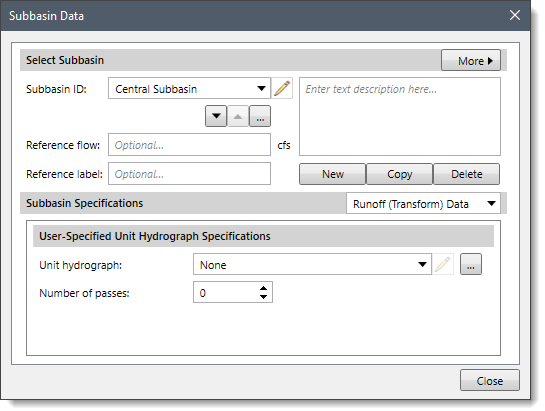
The following input parameters are provided in the data panel:
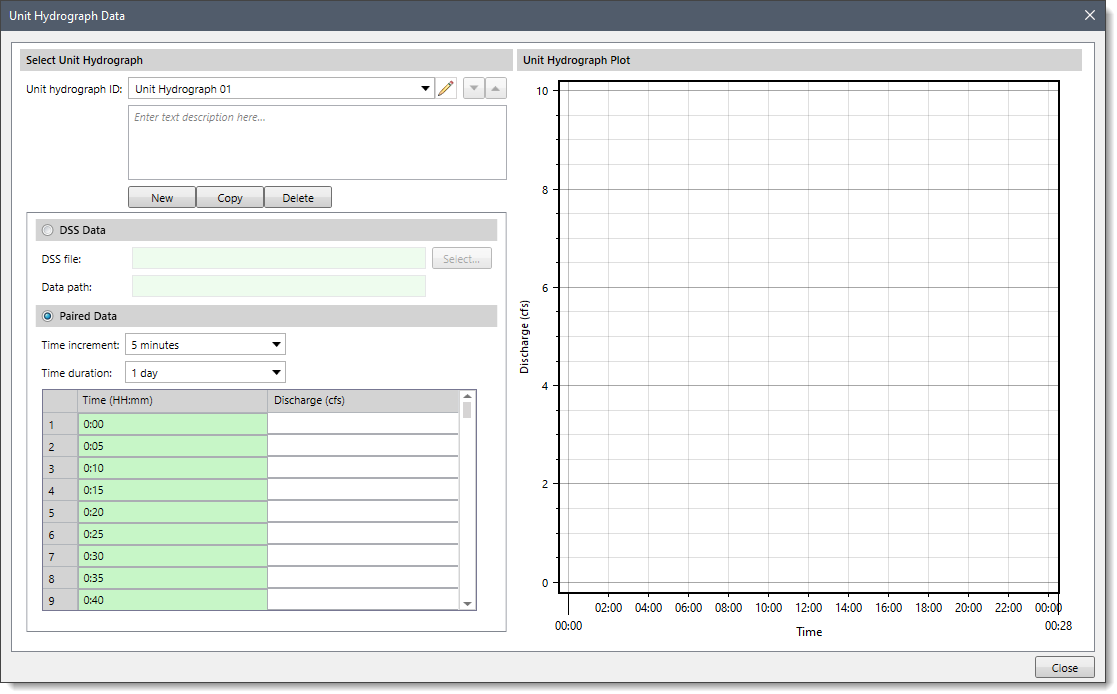
The Unit hydrograph dropdown list allows the user to select the unit hydrograph to use. The unit hydrograph must be defined in the Unit Hydrograph Data dialog box before selecting it. Clicking on the […] button will display the Unit Hydrograph Data dialog box, which allows the user to define new user-defined unit hydrograph flow values.
The Number of passes spin control is used to define the number of passes. The number of passes is used to correct for minor inflection points in the S-curve that is used to convert the unit hydrograph from the input duration to the duration required as per the computational interval.
| Method | Pros | Cons |
|---|---|---|
| Clark Unit Hydrograph Method | ||
| SCS Unit Hydrograph Method | ||
| Snyder Unit Hydrograph Method | ||
| User Specified S-Graph Method | ||
| User-Specified Unit Hydrograph Method | ||
| Kinematic Wave Method |


CivilGEO G2 Reviews
4.8/5.0 Rating, Over 230 Reviews

GeoHECRAS is recognized as the top Civil Engineering Design Software with an average of 4.8 out of 5.0 rating from over 230 real user reviews on G2.


We use cookies to give you the best online experience. By agreeing you accept the use of cookies in accordance with our cookie policy.
When you visit any web site, it may store or retrieve information on your browser, mostly in the form of cookies. Control your personal Cookie Services here.


