
Welcome to CivilGEO Knowledge Base
Welcome to CivilGEO Knowledge Base
Pump stations are used to pump water from one location to another. Some common applications of pump stations are as follows:
In pump station(s), the number of pumps and associated capacity should be selected to provide head capacity characteristics (elevation of a free surface of the water) corresponding to the wastewater quantity fluctuations. This can be accomplished by preparing pump/pipeline system head-capacity curves showing all conditions of head and capacity under which the pumps will be required to operate.
The number of pumps to be installed in the pump station depends largely on the station capacity and range of flow. In small pump stations, two pumps are customarily installed, with each unit having the capacity to meet the maximum influent rate. For larger pump stations, the size and the number of pumps should be selected so that the flow range can be met without frequent starting and stopping of pumps and without requiring excessive wet-well storage.
The pumps are designed to run alternately to keep wear and tear evenly distributed. Additional pumps may be needed to provide intermediate capacities that are better matched to typical daily flows. Another option is to provide flow flexibility with variable-speed pumps. Usually, the single pump peak flow approach is most suitable for stations with relatively high head-losses. Parallel pumping is not as effective for such stations because two pumps operating together yield only slightly higher flows than one pump. Parallel peak pumping is typically used for large pump stations with relatively flat system head curves.
The following are some of the advantages of pump stations:
Pump stations can be connected between the following elements:
In GeoHECRAS, the Pump Station Data command allows users to add pump stations and edit pump data in a project. The Pump Station Data dialog box contains the following data panels that are used to define or modify the pump station(s) data:
To learn more about the Pump Station Data command, refer to this article in our knowledge base.
One common practical usage of pump stations is pumping water stored behind a levee (interior sump) into the main river. An example schematic diagram of an interior ponding area behind a levee is shown below. Note that the pump is connected from the storage area to a river station at the downstream end of the levee.
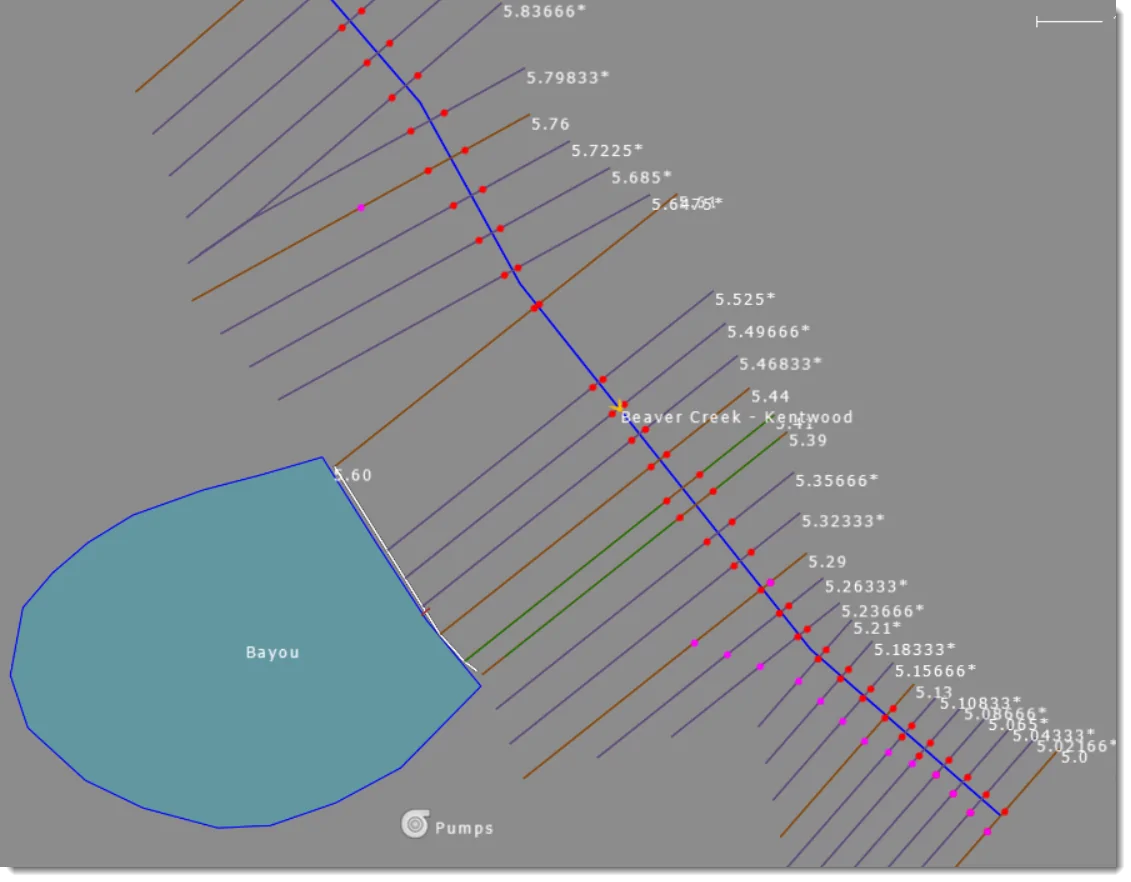
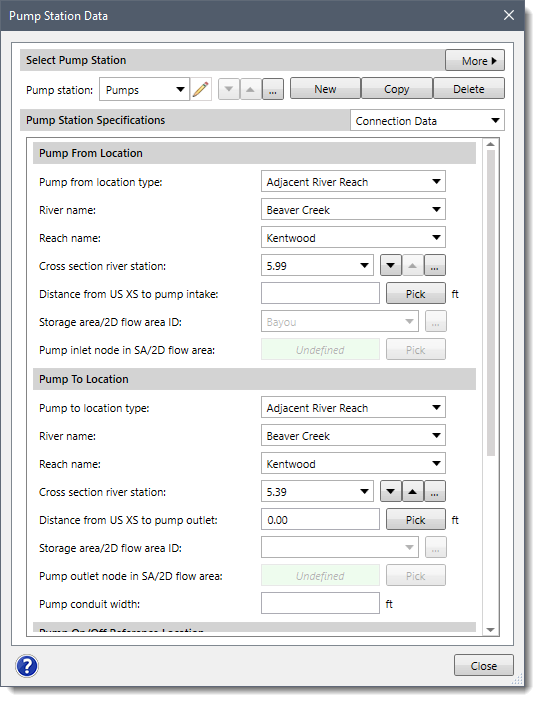
In the above example, a lateral structure was drawn to represent the levee. This structure has a gravity draining culvert with a flap gate. The flap gate only allows water to drain from the storage area to the river. Additionally, a pump station is included to pump flows over the levee during a rainfall event. The pump station was drawn using the Pump Station Data command and the connection from the storage area to the cross section at river station 5.39 was defined in the Connection Data panel.
 A hydrograph is attached to the upstream end of the river reach, which represents the incoming flood wave to this reach. A lateral inflow hydrograph is attached to the storage area, which represents the local runoff collecting behind the levee. The pumps are used to pump water from the storage area, over the levee, to the river. The top of the levee is at an elevation of 220 feet. Therefore, the pump station is constantly pumping to a head of 220 feet.
In the Performance Data panel, one pump group (Group #1) has been defined with three identical pumps (Pump #1, Pump #2, Pump #3) as shown below.

These pumps are of the same size and flow capacity. However, each pump has a different on and off trigger elevation. The pump efficiency curve is used for all three of the pumps.
Two rules: Always Apply and Time & Water Surface Elevation Trigger have been applied to this pump station using the Advanced Control Rules data panel.
The Always Apply rule has an absolute maximum pump flow of 800 cfs and a minimum flow of 1cfs for the entire pump station.

The Time & Water Surface Elevation Trigger rule has a maximum flow of 700 cfs which is applied only between 12 April 0000 and 18 April 0000, but only if the water surface at storage area Bayou is greater than 209. Also, the second part of this rule sets a minimum flow for the same time period, but only if the stage at storage area Bayou is less than 206.5.

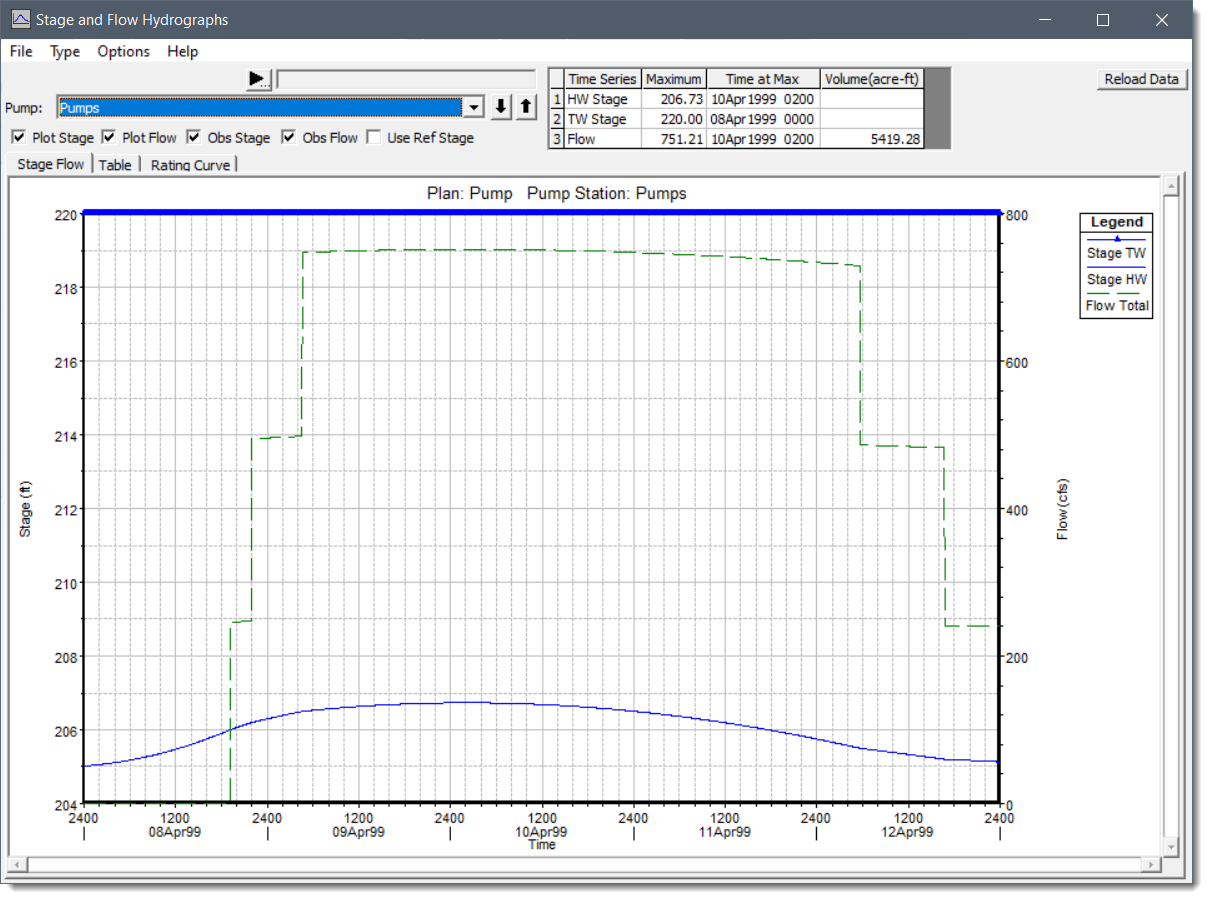
After running the analysis, the pump station output results can be viewed in the Stage and Flow Hydrographs dialog box. Selecting the Pump Stations option under the Type menu will display the pump station’s stage and flow plots as shown below.
Refer to this article in our knowledge base to learn more about Stage and Flow Hydrographs command.
In the pump stations plot, the stage for the tailwater location (Stage TW) is a constant 220 ft. This is due to the fact that the pump is constantly pumping over the levee at elevation 220. The stage at the headwater location (Stage HW) is the water surface elevations in the storage area. The storage area elevation starts at an elevation of 205 ft., goes up to around 206.6, and then back down to around 205.1. The flow through the pumps was zero until an elevation of 206 was reached within the storage area, which triggered the first pump. The second pump turned on when the storage area reached elevation 206.2, and the third at elevation 206.5. On the falling side of the hydrograph, the pumps began to turn off as the stage went down in the storage area. The stage and net inflow to the storage area are shown below.
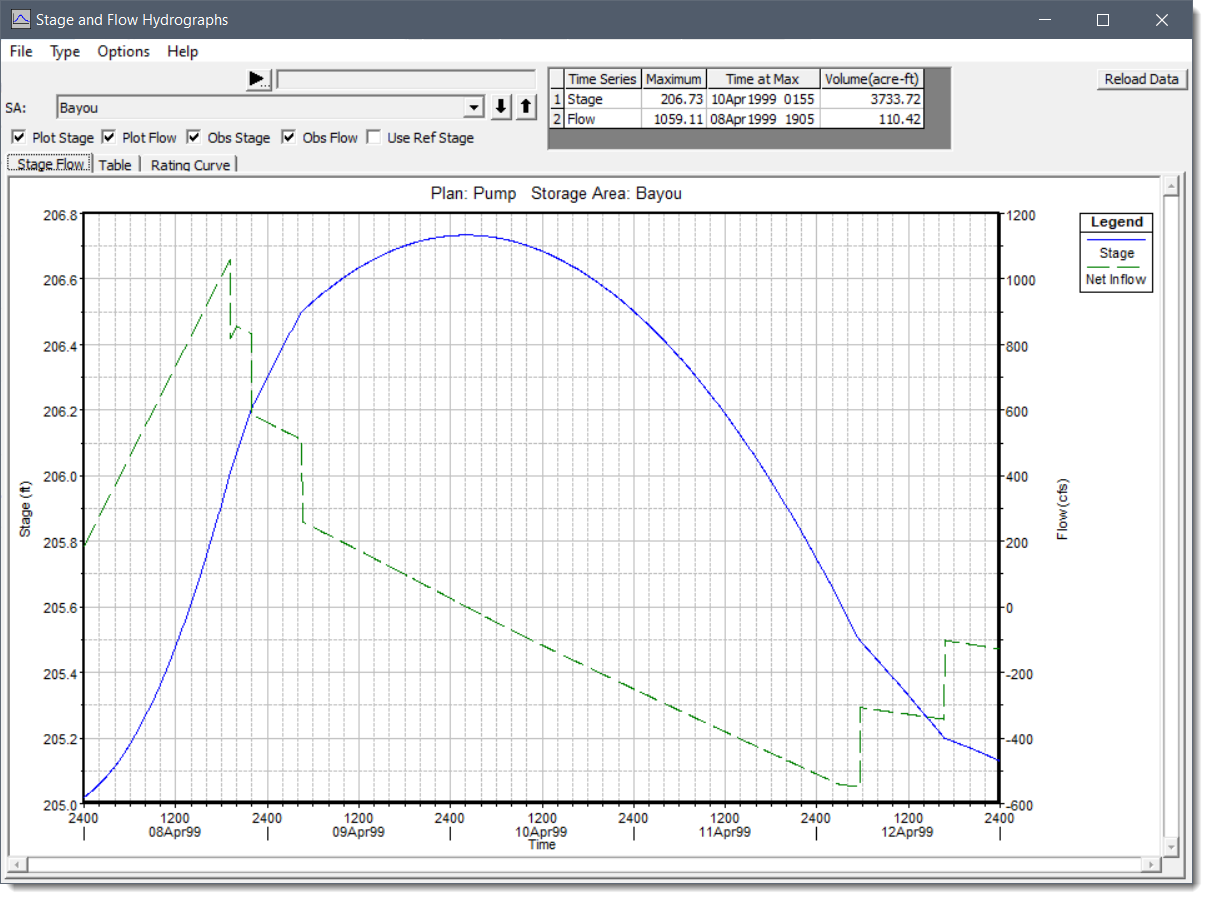
Here, the net inflow represents all the inflows minus the outflows at each time step.
The overall performance of the pump station depends on the performance of its pumps. All pumps have the following four common performance characteristics:
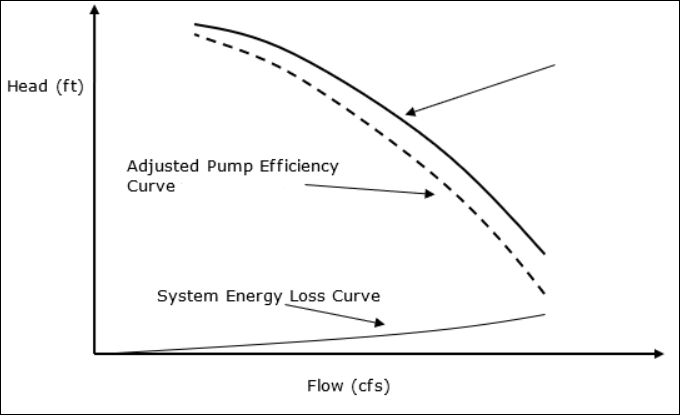 Here, the head represents the total head in the system, which is normally the difference in the water surface elevations between the from and to locations. In general, the pump performance curves are used to define and compare the operating characteristics of a given pump and to identify the best combination of performance characteristics under which the pump station will operate under typical conditions.


CivilGEO G2 Reviews
4.8/5.0 Rating, Over 230 Reviews

GeoHECRAS is recognized as the top Civil Engineering Design Software with an average of 4.8 out of 5.0 rating from over 230 real user reviews on G2.


We use cookies to give you the best online experience. By agreeing you accept the use of cookies in accordance with our cookie policy.
When you visit any web site, it may store or retrieve information on your browser, mostly in the form of cookies. Control your personal Cookie Services here.


