1. Home
  2. Knowledge Base
  3. GeoHECHMS
  4. Publish Graphics Command
  1. Home
  2. Knowledge Base
  3. GeoHECRAS
  4. Publish Graphics Command

Publish Graphics Command

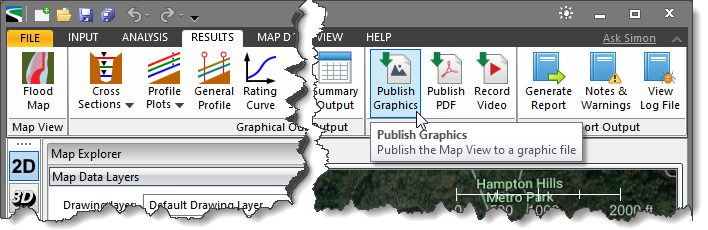
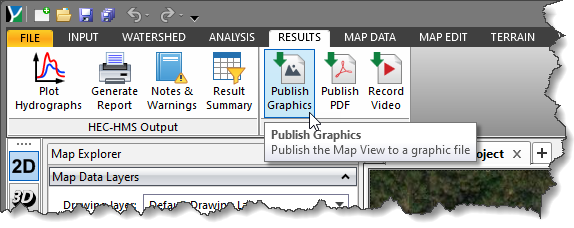
In CivilGEO software, the Publish Graphics command allows the user to publish the Map View data to a graphic file. Saving the Map View data in a graphic file allows the user to use it with other applications effortlessly.

The user can also publish the Map View data into PDF and video files with the following commands:

  • Publish PDF
    This command is used to publish the Map View data into a PDF file. Refer to this article in our knowledge base to learn more about this command.
  • Record Video
    This command is used to publish the Map View data into the video file. Refer to this article in our knowledge base to learn more about this command.

Follow the steps below to use the Publish Graphics command:

  1. From the Results ribbon menu, select the Publish Graphics command.
    • In GeoHECRAS
      GeoHECRAS Publish Graphics command
    • In GeoHECHMS
      GeoHECHMS Publish Graphics command
  2. The Publish Graphics dialog box will be displayed.
    Publish Graphics dialog box

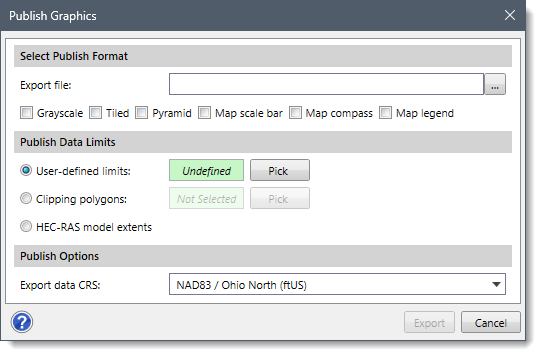
The following sections describe how to use the Publish Graphics command and interact with the above dialog box.

Selecting Publish Format

The Select Publish Format section allows the user to define the location where the user can save the created graphics. Click the […] button beside the Export file entry to specify the directory and the file name to save the graphics. The software will display the Save As dialog box. From the displayed dialog box, browse to the location to save the file, enter the file name (it should have a file extension of .tif or .tiff), and then click the [Save] button.

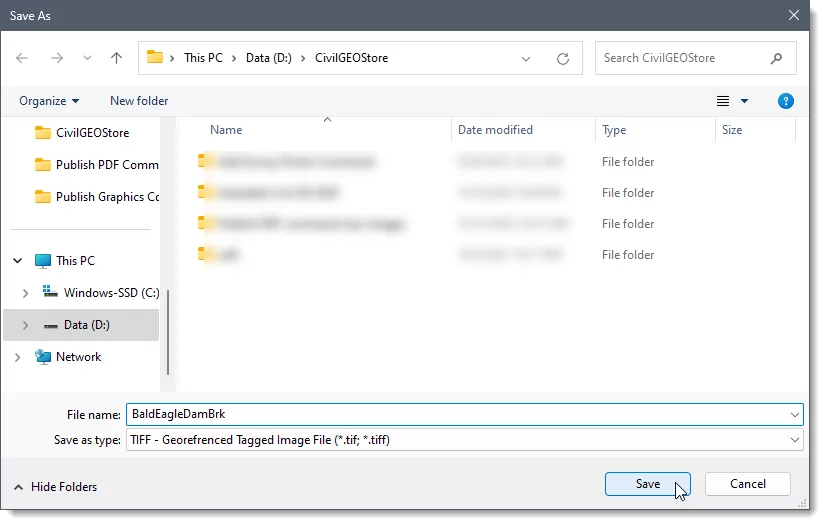
On clicking the [Save] button, the Publish Graphics dialog box will be redisplayed, and the complete directory path and file name will be shown in the Export file entry.
Export file entry

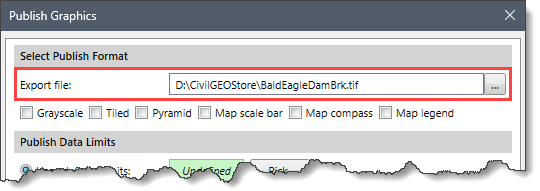
The user can check the checkboxes available in the Select Publish Format section to export the graphics data in different formats. The following options are provided:

  • Grayscale: Selecting this option allows the user to export the graphics data in a grayscale format.
  • Tiled: Selecting this option allows the user to export the graphics data in a tiled format.
  • Pyramid: Selecting this option allows the user to export the graphics data in a pyramid format.
  • Map scale bar: Selecting this option allows the user to export the graphics data with the map scale bar.
  • Map compass: Selecting this option allows the user to export the graphics data with the compass rose.
  • Map legend: Selecting this option allows the user to export the graphics data with the map view legend.

Publish Data Limits

This section is used to define the maximum limits for publishing the graphics.

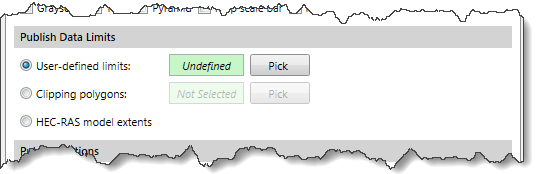
The following options are available:

  • User-defined limits
    This option allows the user to draw a rectangular extent for defining the graphics limits. Click the [Pick] button to select the graphics limits on the Map View. The dialog box will temporarily disappear, and an information message will be displayed on the status bar instructing the user to draw the rectangular extent. Click and drag a rectangular region to define the limits. After releasing the mouse, the Publish Graphics dialog box will be redisplayed, and the status of the User-defined limits read-only field will be changed from Undefined to Defined.
  • Clipping Polygons
    This option allows the user to select one or more existing polygons for defining the graphics limits. Click the [Pick] button to select the polygon shape region(s) on the Map View. The dialog box will temporarily disappear, and a prompt will be displayed on the status bar instructing the user to select the clipping polygons. Select the clipping polygons on the Map View and press the [Enter] key or right-click and select Done from the displayed context menu. The Publish Graphics dialog box will be redisplayed, and the total number of selected polygons will be displayed in the Clipping polygons read-only field.
  • Model extents
    Select this radio button option to use the model extents for defining the graphics limits. If a project model has been defined, this option will create a bounding rectangular region to correspond to the extent of the defined model, plus an additional buffer boundary.

Publish Options

This section allows the user to select the CRS to be used for the published Map View data.

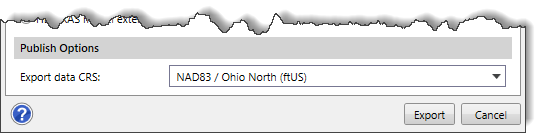
The Export data CRS dropdown combo box allows the user to select the CRS for the published Map View data. The dropdown combo box contains the CRS of all the loaded layers available in the model.

Publishing Data to Graphics

When all the options have been properly defined, click the [Export] button. The software will publish the Map View data into the graphics file at the selected location.

About the Author Chris Maeder

  • Was this helpful?
  • YesNo

Was this article helpful?

Related Articles