
Welcome to CivilGEO Knowledge Base
Welcome to CivilGEO Knowledge Base
The meteorologic model is responsible for preparing the boundary conditions that act on the watershed during a simulation. Consequently, a meteorologic model is prepared for use with one or more basin models. If the basin model contains subbasin elements, then the meteorologic model must specify how precipitation will be generated for each subbasin. Evapotranspiration should be included in the model if it is configured for continuous simulation. This would include both evaporation of free water from the vegetation surface as well as the land surface. Evapotranspiration is the combination of evaporation from the ground surface and transpiration by vegetation. Transpiration involves the process of vegetation extracting water from the soil through the plant root system. Whether by evaporation or transpiration, water is returned from the land surface or subsurface to the atmosphere. Even though evaporation and transpiration are taken together, transpiration is responsible for the movement of much more water than evaporation.
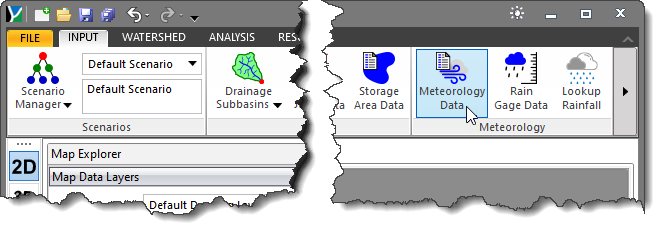
In GeoHECHMS, meteorologic boundary conditions, such as storm events, are defined using the Meteorology Data command. This command supports meteorological data such as precipitation and evapotranspiration. Evapotranspiration is only factored in for long-term continuous simulations.
Follow the steps below to use the Meteorology Data command:
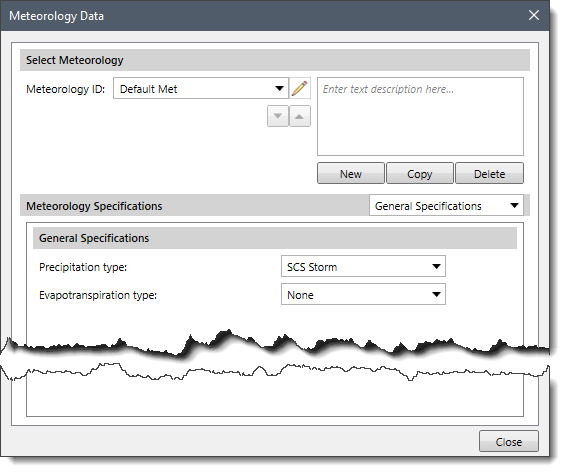
The following sections describe how to use the Meteorology Data command and how to interact with the above dialog box.
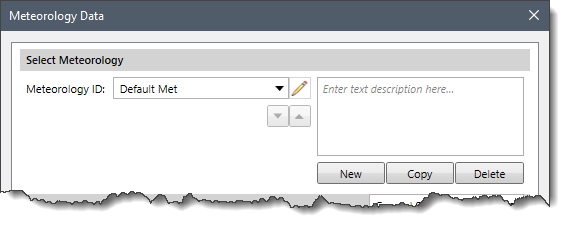
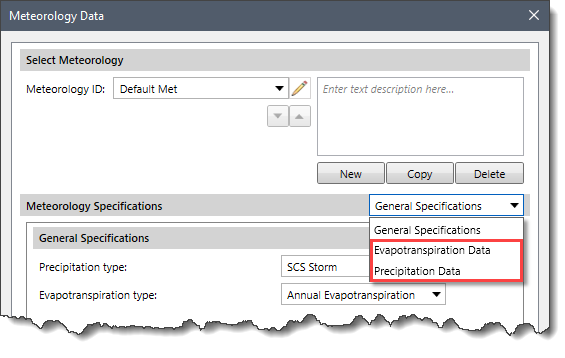
In the Select Meteorology section, the Meteorology ID entry denotes the selected meteorology. The default Meteorology ID is Default Met. The user can create a new meteorology, copy existing meteorology data to a new meteorology, and delete a meteorology. In addition, the user can navigate between meteorologies with use of the Meteorology ID dropdown entry. The user can also enter a description detailing the defined meteorology in the field adjacent to the Meteorology ID dropdown entry.
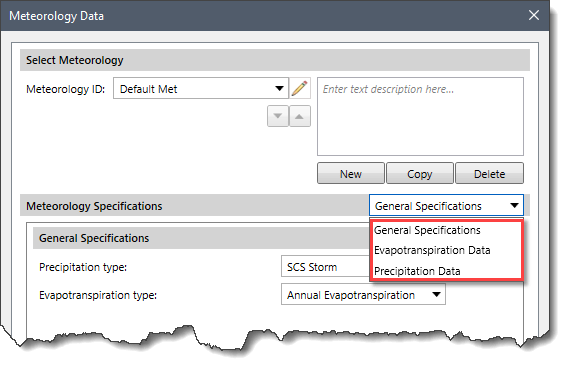
In this section, the available dropdown entries are:
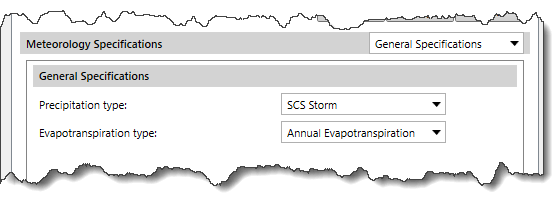
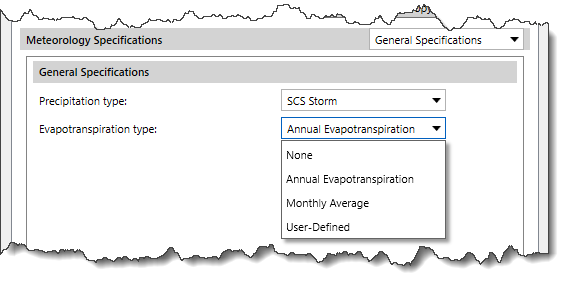
If the user selects this dropdown entry, the General Specifications panel will be displayed where the user can select the precipitation and evapotranspiration types from the Precipitation type and Evapotranspiration type dropdown combo boxes as shown below.
After selecting the precipitation and evapotranspiration types, the user can view the corresponding data panels using the Precipitation Data and Evapotranspiration Data panel selector.
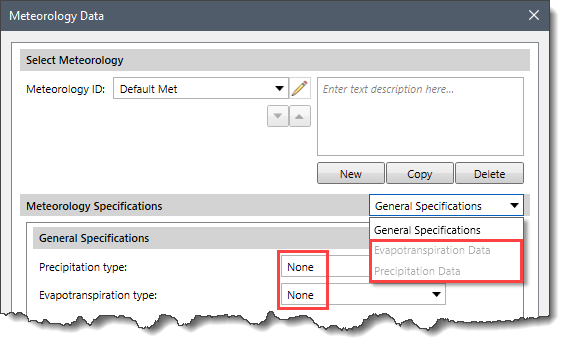
Note that selecting None from the Precipitation type or Evapotranspiration type dropdown combo boxes disables the Precipitation Data and Evapotranspiration Data panel selectors.
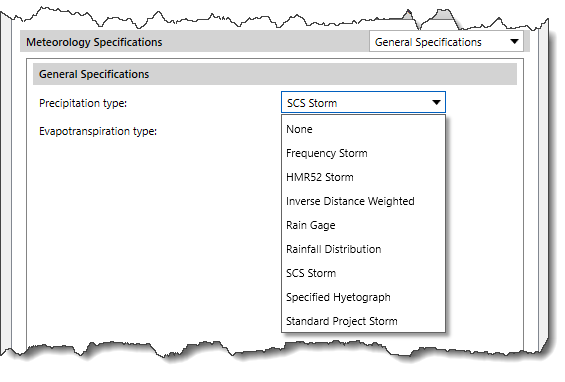
The Precipitation type dropdown menu contains the following entries:
After selecting the Precipitation type, the user can define the data for the selected precipitation type from the Precipitation Data panel.
The following sections describe the Precipitation Data panel for each precipitation type.
This precipitation type is used to produce a synthetic storm from HYDRO35, TP40, and TP49 statistical data. Refer to this article to learn more about the Frequency Storm precipitation type.
This precipitation type can be used to compute the probable maximum precipitation (PMP) for a watershed. The HMR52 storm precipitation type includes several parameters to describe the location, orientation, and temporal distribution of the storm. Refer to this article to learn more about the HMR52 Storm precipitation type.
This precipitation type was originally designed for application in real-time forecasting systems. This precipitation type uses recording gages that are reported at regular intervals such as 15 minutes or 1 hour. Refer to this article to learn more about the Inverse Distance Weighted precipitation type.
This precipitation type is designed to work with time series recording and single value recording precipitation gages. Refer to this article to learn more about the Rain Gage precipitation type.
This precipitation type is a region-based temporal rainfall distribution of different areas. The data used in this precipitation type is created by historical storm events and the statistical analysis for each climate region and then grouped by different durations (6-hr, 12-hr, 24-hr, etc.), quartiles (1st, 2nd, 3rd, 4th), and percent of occurrence (10%, 20%, 30%, etc.). Refer to this article to learn more about the Rainfall Distribution precipitation type.
Drainage planning in the United States is often performed using hypothetical storms developed by the Soil Conservation Service (SCS), now known as the Natural Resources Conservation Service (NRCS). These storms were developed by the SCS as averages of rainfall patterns; they are represented in a dimensionless form. The SCS designed this storm method for a small drainage area. This precipitation type intends to estimate both peak flow rate and runoff volume from precipitation of a “critical” duration. Refer to this article to learn more about the SCS Storm precipitation type.
This precipitation type allows the user to specify the exact rain gage time series to use for the hyetograph at each subbasin. This precipitation type is useful when precipitation data is processed externally and imported without modification. Refer to this article to learn more about the Specified Hyetograph precipitation type.
This precipitation type provides precipitation versus time relationship that is designed to be reasonably representative of major storms that have occurred or might occur in the area of concern. Refer to this article to learn more about the Standard Project Storm precipitation type.
The Evapotranspiration type dropdown menu contains the following entries:
After selecting the Evapotranspiration type, the user can define the data for the selected evapotranspiration type from the Evapotranspiration Data panel.
The following sections describe the Evapotranspiration Data panel for each evapotranspiration type.
This evapotranspiration type is designed to work with a maximum daily rate combined with an optional pattern of variation throughout the year. Each basin has its evaporation rate information.
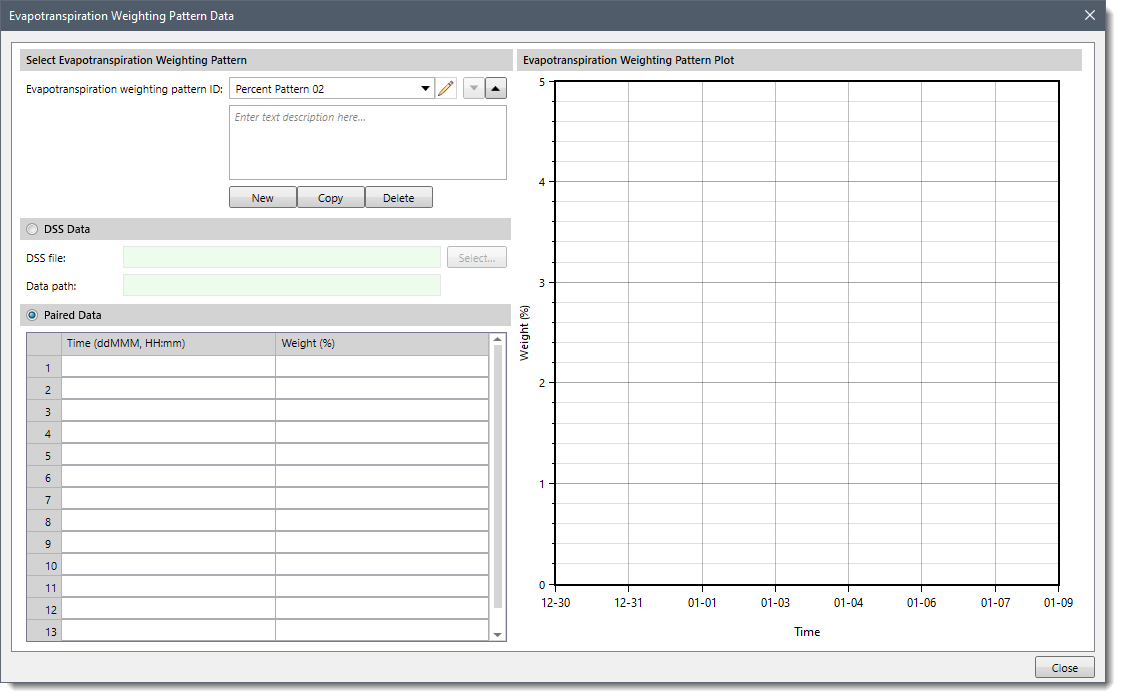
Specifying only a daily rate can produce good results for simulations lasting a few days to weeks. The optional pattern can be used to adjust the applied evapotranspiration rate during simulations lasting weeks to years. The evapotranspiration for each day of the simulation is computed by multiplying the evapotranspiration rate by the percentage interpolated from the defined percent pattern.
When Annual Evapotranspiration is selected as the Evapotranspiration type, the following data panel will be displayed for the Evapotranspiration Data selector.
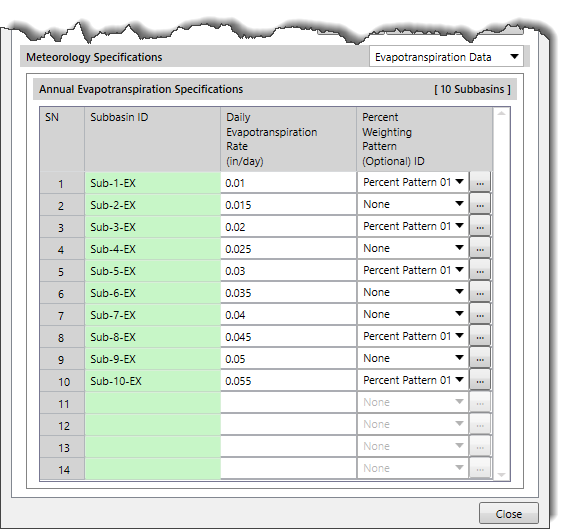
The above data panel contains the following sections:
The following data columns are provided in the data grid of this section.
This evapotranspiration type is designed to work with measured pan evaporation data. However, it can also be used with the data collected by the eddy correlation technique or other modern methods. Regardless of how the evapotranspiration data is collected, it is typically presented as the average depth of evaporated water each month.
When the Monthly Average is selected as the Evapotranspiration type, the following data panel will be displayed for the Evapotranspiration Data selector.
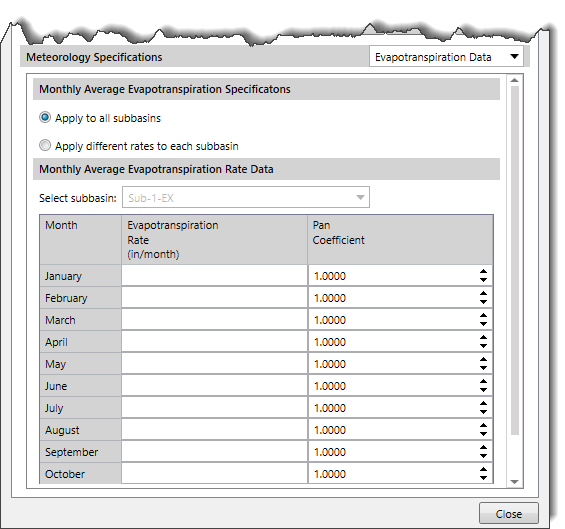
The above data panel contains the following sections:
In the Select subbasin dropdown combo box, all the subbasins within the model are listed. This allows the user to select a specific subbasin and define unique evapotranspiration data for that subbasin. If the Apply to all subbasins radio button is selected, the Select subbasin dropdown combo box lists will be disabled.
The following data columns are provided in the data grid of this section.
This evapotranspiration type allows the user to specify an exact time series to use for the potential evapotranspiration. It is also useful when a single evapotranspiration observation measurement is used over a subbasin.
When User-Defined is selected as the Evapotranspiration type, the following data panel will be displayed for the Evapotranspiration Data selector.
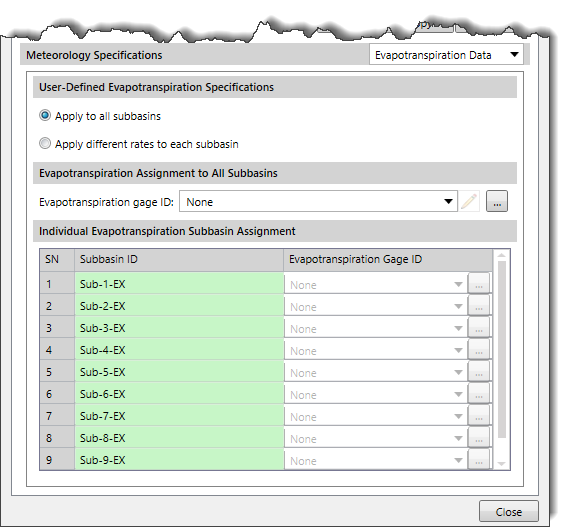
The above data panel contains the following sections:
Note that this section is disabled (i.e., grayed out) if the Apply different rates to each subbasin radio button entry is selected. Otherwise, if this section is enabled, all subbasins are assigned the same evapotranspiration time series gage.
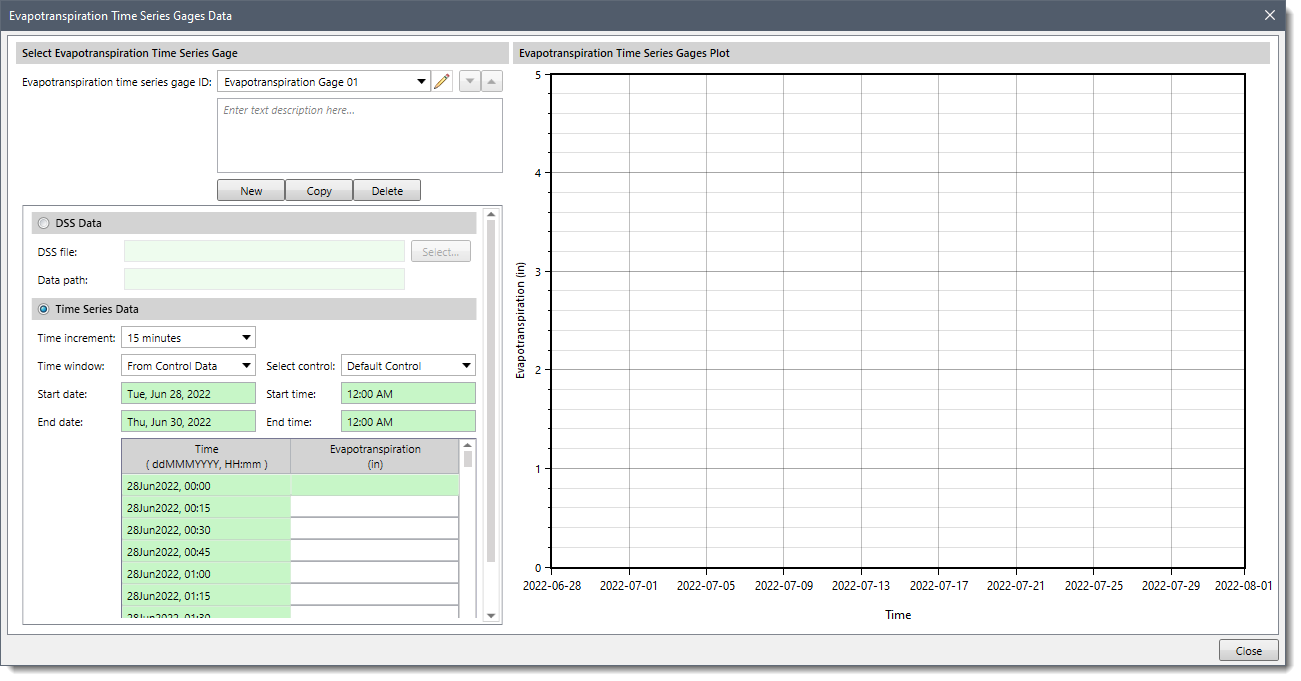
The Evapotranspiration gage ID dropdown combo box lists all the evapotranspiration time series gages contained within the model. This allows the user to select a specific gage to define unique evapotranspiration data to all the subbasins within the scenario. Clicking the […] button will display the Evapotranspiration Time Series Gages Data dialog box that allows the user to define evapotranspiration time series gage data as shown below.
This section is disabled (i.e., grayed out) if the Apply to all subbasins radio button is selected. Otherwise, if this section is enabled, each subbasin is assigned its own evapotranspiration time series gage.
The following data columns are provided in the data grid of this section.
After specifying all of the necessary precipitation and evapotranspiration data for the specified scenario, the user should compute the analysis to incorporate the defined meteorology data into the project.


CivilGEO G2 Reviews
4.8/5.0 Rating, Over 230 Reviews

GeoHECRAS is recognized as the top Civil Engineering Design Software with an average of 4.8 out of 5.0 rating from over 230 real user reviews on G2.


We use cookies to give you the best online experience. By agreeing you accept the use of cookies in accordance with our cookie policy.
When you visit any web site, it may store or retrieve information on your browser, mostly in the form of cookies. Control your personal Cookie Services here.


