
Welcome to CivilGEO Knowledge Base
Welcome to CivilGEO Knowledge Base
The terms land cover data and land use data are often used interchangeably, yet their meanings are substantially different. Land cover data documents the physical characteristics of Earth’s surface—whether it is forest, tidal wetland, urbanized region, or grassland. Land use data refers to how people utilize the land—whether for agricultural, recreational, residential, commercial, or industrial purposes.
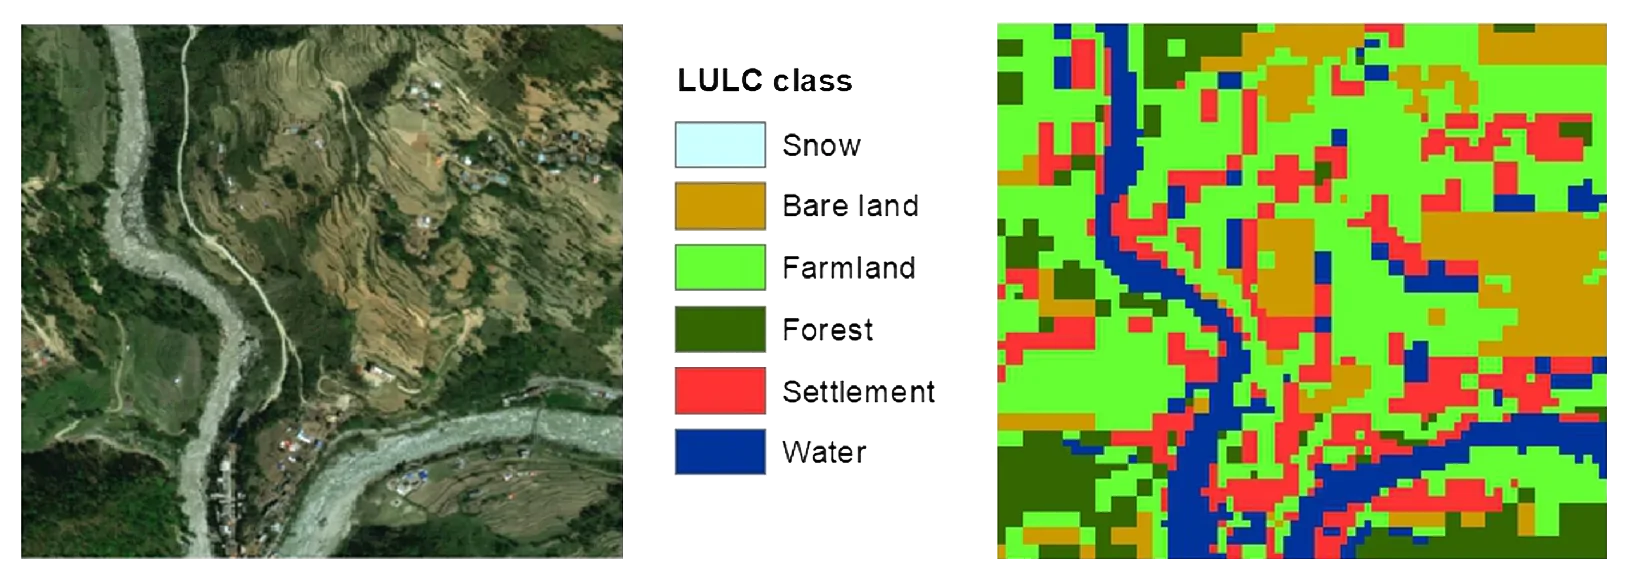
Land Use and Land Cover (LULC) data sets are raster (occasionally vector) files developed by classifying raw satellite data into land use and land cover classes. LULC raster files contain multiple band layers, each of which is color coded according to the LULC category—for example, one RGB band layer can identify grasslands, another bare lands, and yet another, wetlands.
LULC classification schemes are typically arranged in a nested hierarchy where land cover is often used at the macro scale (urbanized land for example) and land use becomes apparent with increasing map detail where the actual use (residential, industrial, mixed urban etc.) is identified. Below are two levels of a popular multilevel classification system designed by the United States Geological Survey (USGS), with each level mapping to more detailed land use and land cover classes.
| Level I | Level II |
|---|---|
| 1. Urban or built-up | 11. Residential 12. Commercial and services 13. Industrial 14. Transportation, communication, and utilities 15. Industrial and commercial complexes 16. Mixed urban and built-up land |
| 2. Agriculture | 21. Cropland and pasture 22. Orchards, groves, vineyards, nurseries, and ornamental horticultural areas 23. Confined feeding operations |
| 3. Rangeland | 31. Herbaceous rangeland 32. Shrub and brush rangeland 33. Mixed rangeland |
| 4. Forest land | 41. Deciduous Forest land 42. Evergreen Forest land 43. Mixed Forest land |
| 5. Water | 51. Streams and canals 52. Lakes 53. Reservoirs 54. Bays and estuaries 61. Forested wetlands |
| 6. Wetlands | 61. Forested Land 62. Non forested wetlands |
| 7. Barren | 71. Dry salt flats 72. Beaches 73. Sandy areas other than beaches 74. Bare exposed rock 75. Strip mines, quarries, and gravel pits |
Various global and regional land use and land cover datasets relating to land shapes and usage, whether natural or affected by humans, are available online. Some of the most popular land use and land cover data collections are listed below:
| Collection Name | Usage Notes |
|---|---|
| National Land Cover Dataset (NLCD) NLCD is the most recent and detailed land cover data generated in cooperation with the Multi-Resolution Land Characteristics Consortium (MRLC), a partnership of Federal agencies working together to produce current, nationally consistent, land cover products for all 50 states of the United States and Puerto Rico. |
|
| NOAA's Coastal Change Analysis Program (C-CAP) NOAA’s C-CAP program is developed to provide nationally standardized, raster-based inventories of land cover for the coastal areas of the U.S. Data are derived from the analysis of multiple remotely sensed imagery. C-CAP database forms the coastal expression of the National Land Cover Database (NLCD). |
|
| USGS GAP (Gap Analysis Project) The GAP/LANDFIRE National Terrestrial Ecosystems data set includes detailed vegetation and land cover patterns for the continental United States. The data set incorporates the Ecological System classification system developed by NatureServe to provide accurate, seamless data that can serve as input into wildlife habitat distribution models, complex hydrological models, fire dynamics models, and many other applications. |
|
| Global Land Cover - SHARE (GLC-SHARE) GLC-SHARE was created by the FAO (Food and Agriculture Organization) of the United Nations in collaboration with various institutions, using the best available high resolution national, regional, and/or sub-national land cover databases. The main advantage of the GLC-SHARE product is that its global extent maps preserve available land cover information at the country level derived from spatial and multi-temporal source data. |
|
Land use/land cover (LULC) changes are important elements out of the many active environmental factors affecting catchment hydrology. This is because changes in land use have an impact on hydrologic components such as evapotranspiration (ET), interception, and infiltration, all of which can significantly impact surface and subsurface flows.
There are not many LULC datasets available, owing to the high cost of collecting satellite data and the time-consuming categorization process. In addition, the majority of LULC data products are published many years after the satellite photos were obtained, making them somewhat out of date by the time they are released. As a result, up-to-date spatial data on land use and land cover dynamics might be inconsistent and incomplete.
Nevertheless, extensive knowledge on the status of land and the changes to land use and land cover is essential to the process of developing accurate hydrologic predictions for sustainable regional (re)development. Within GeoHECHMS, the Draw Land Use and Classify Land Use commands can be used to address inconsistencies and gaps in land use and land cover data.
The Draw Land Use command allows the user to manually define land use by interactively painting different regions of land use type in order to create a thematic land use layer. To learn more about this command, refer to this article in our Knowledge Base.
The Classify Land Use command allows the user to geospatially analyze an orthophoto and then categorize land use using an automatic color segmentation approach for regions where land cover data is not available. To learn more about this command, refer to this article in our Knowledge Base.


CivilGEO G2 Reviews
4.8/5.0 Rating, Over 230 Reviews

GeoHECRAS is recognized as the top Civil Engineering Design Software with an average of 4.8 out of 5.0 rating from over 230 real user reviews on G2.


We use cookies to give you the best online experience. By agreeing you accept the use of cookies in accordance with our cookie policy.
When you visit any web site, it may store or retrieve information on your browser, mostly in the form of cookies. Control your personal Cookie Services here.


