
Welcome to CivilGEO Knowledge Base
Welcome to CivilGEO Knowledge Base
Land cover data represent the physical characteristics of Earth’s surface—whether it is forest, tidal wetland, urbanized region, or grassland. Using land cover data, the user can examine landscape patterns and characteristics as given below:
Land cover also influences or has an impact on watershed hydrology, including water quality, environmental conditions, habitat and species composition, climate, and carbon storage. It also alters the hydrologic regimes, runoff patterns, and flood buffering in watersheds.
The user can use land cover as a starting point from which various monitoring activities (change detection) can be performed. This land cover information can be used for many purposes, such as assessing non-point sources of pollution, understanding landscape variables for ecological analysis, assessing the behavior of chemicals, and analyzing the effects of air pollution.
The Land Cover command of CivilGEO’s software allows the user to display both natural and man-made land cover of the selected region (United States, Canada, Africa, Europe, India, Australia, and New Zealand) on the Map View.
Note that a CRS should be assigned prior to running this command. Otherwise, the software will display the below informational dialog box.
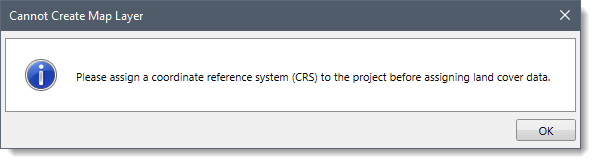
To learn more about the coordinate reference system (CRS), refer to this article in our knowledge base.
To display the land cover on the Map View, select the Land Cover dropdown menu from the Map Data ribbon menu.
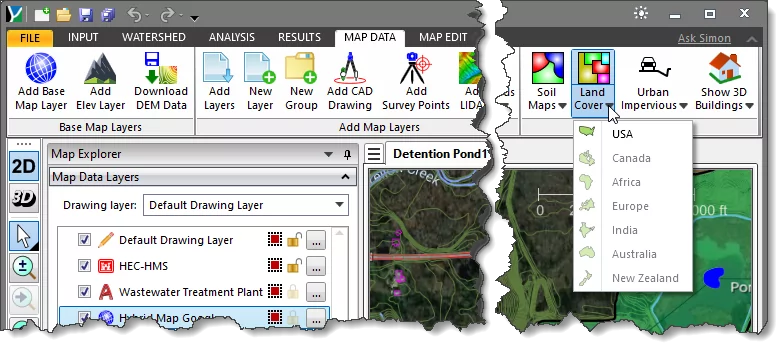
Note: Based on the current CRS of the project, the corresponding region will be enabled.
Clicking on any of the desired countries listed above will cause the software to display the following Land Cover dialog box.
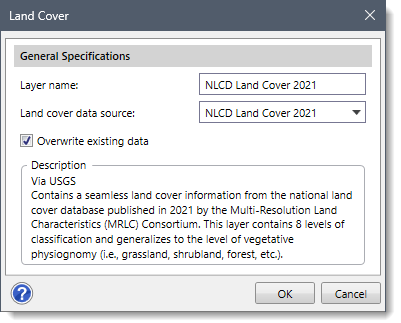
The Layer name entry field allows the user to define the name of a new land cover layer to be created and displayed in the Map Data Layers panel. The software sets “NLCD Land Cover” as the default name for the land cover layer, which can be changed by the user.
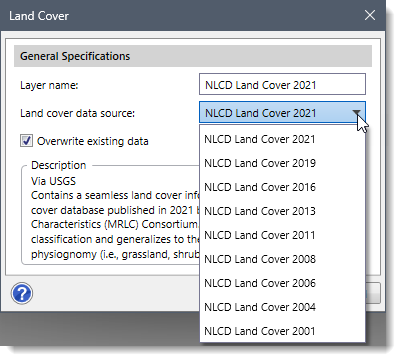
The Land cover data source dropdown combo box allows the user to select which land use data source to utilize for the newly created layer. By default, the software selects the latest land use data. The following options are available in the dropdown combo box:
If the “Overwrite existing data” checkbox option is checked, then the new land cover data selected in the Land cover data source dropdown combo box will overwrite the existing land cover data (if one exists).
Note that for countries other then the USA, the Land cover data source dropdown combo box and Overwrite existing data checkbox options are not available.
The user can click on the [OK] button to add the land cover of the selected region on the Map View.
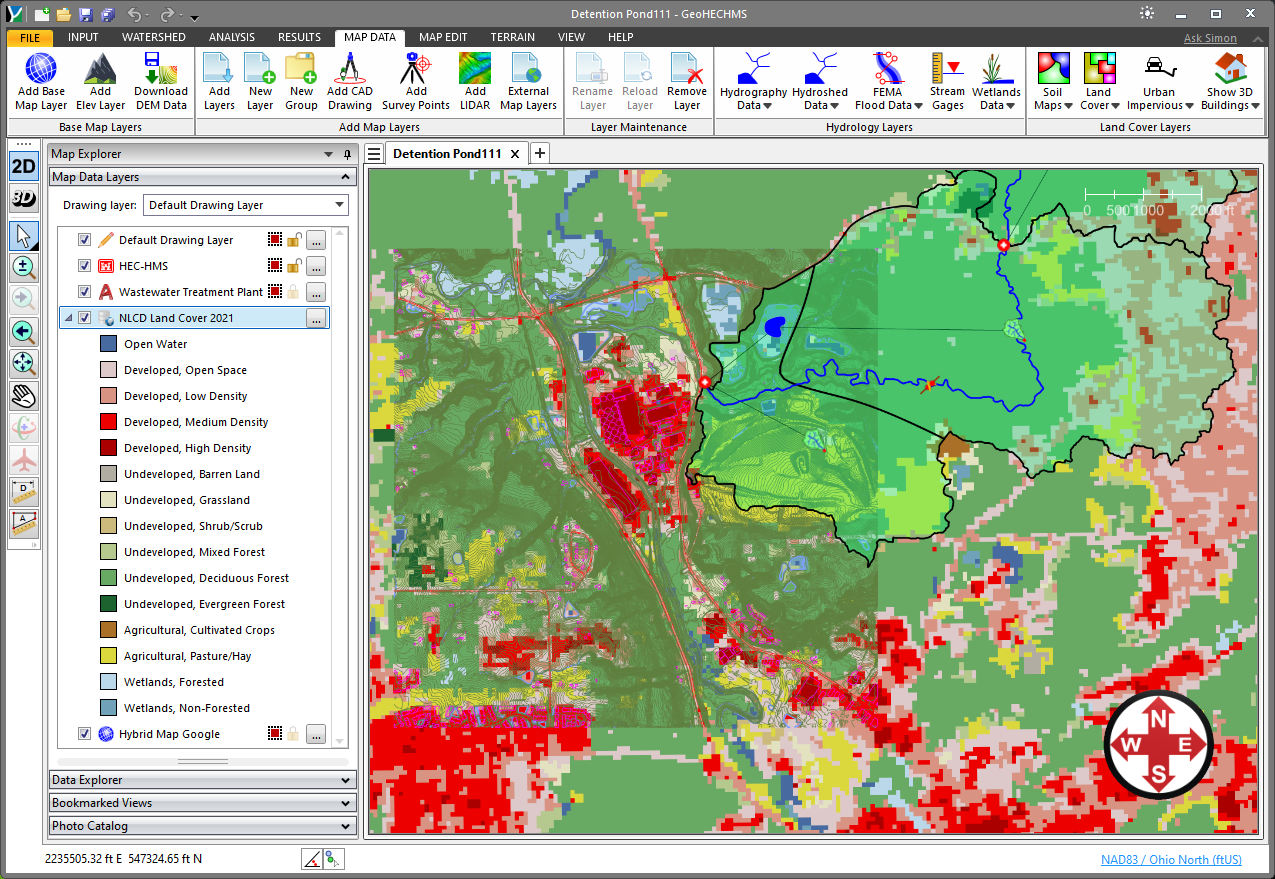
In the Map Data Layers panel, the software will provide a data legend for each land cover layer that lists the land cover data included within that layer. The user can expand the layer to view the data legend.


CivilGEO G2 Reviews
4.8/5.0 Rating, Over 230 Reviews

GeoHECRAS is recognized as the top Civil Engineering Design Software with an average of 4.8 out of 5.0 rating from over 230 real user reviews on G2.


We use cookies to give you the best online experience. By agreeing you accept the use of cookies in accordance with our cookie policy.
When you visit any web site, it may store or retrieve information on your browser, mostly in the form of cookies. Control your personal Cookie Services here.


