
Welcome to CivilGEO Knowledge Base
Welcome to CivilGEO Knowledge Base
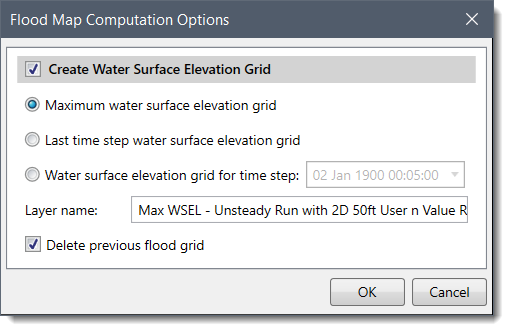
While GeoHECRAS constructs a flood map representing the area of inundation, it can simultaneously generate an elevation raster grid (or elevation grid) file representing the water surface elevation for the mapped area. This raster grid file allows the flood map to be utilized in other software programs, such as ESRI ArcMap and ArcGIS. Each grid cell within the elevation raster contains a single value representing the computed water surface elevation. Areas that are not flooding are marked as “NODATA” in their grid cells.
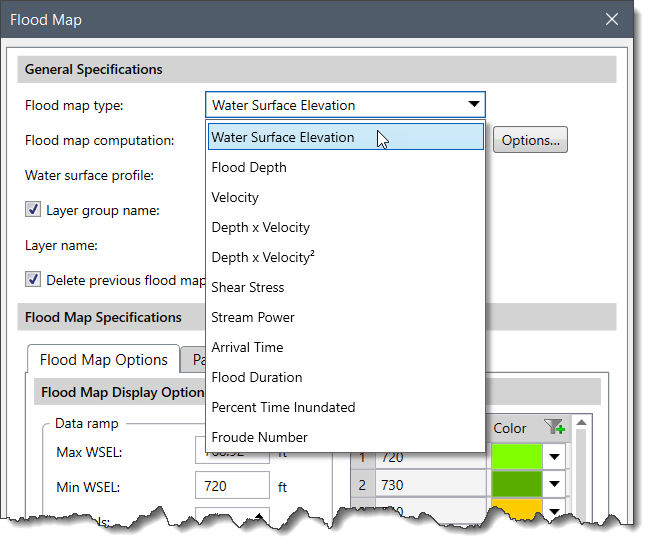
In addition to creating a flood map elevation raster grid, the software can generate raster grid files for any of the available flood maps that GeoHECRAS can produce, including:
It is a simple process to direct the software to generate a corresponding raster grid file while generating a flood map. The following section details how this is done.
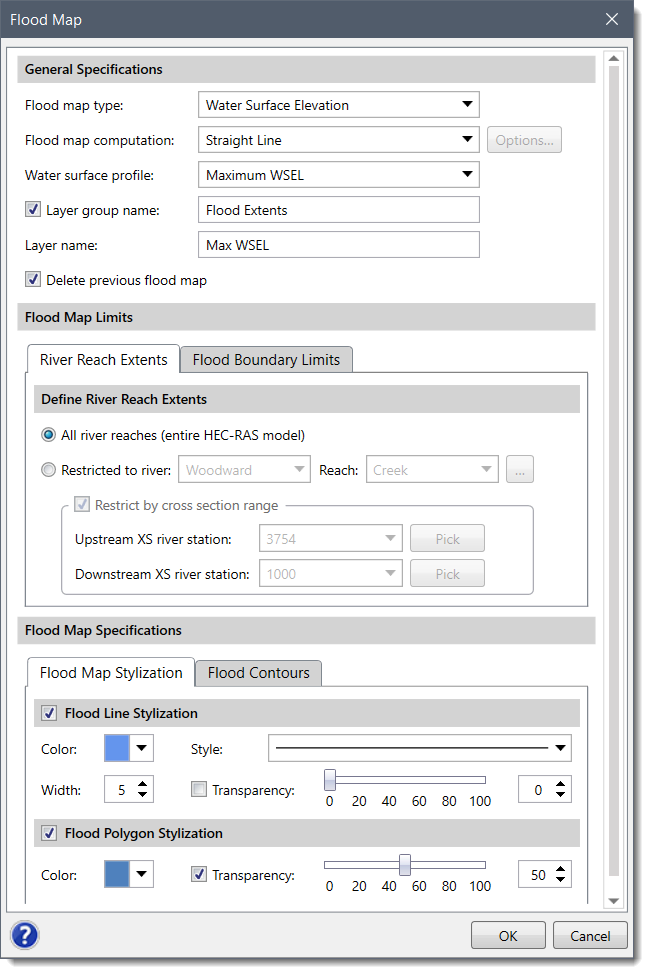
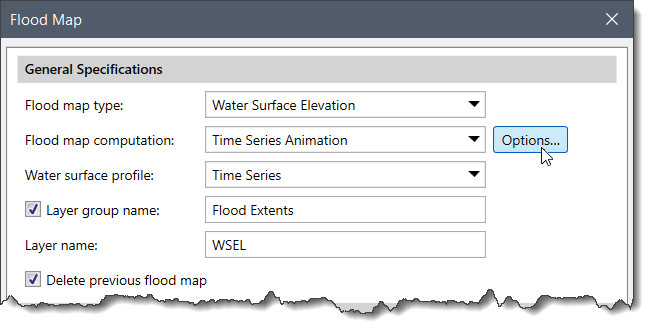
This section describes the process used to generate a water surface elevation raster while generating the flood map. Take note that this same process can be used to generate raster grids for other flood results, such as maximum velocity flood maps.
For the flood map and corresponding water surface elevation raster grid to be generated, the HEC-RAS model analysis results must be available. If not, first perform a HEC-RAS flow analysis for the defined model.
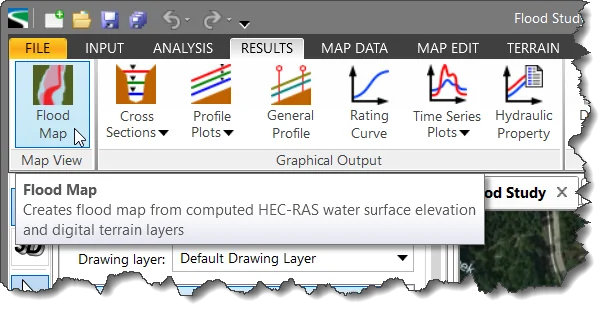
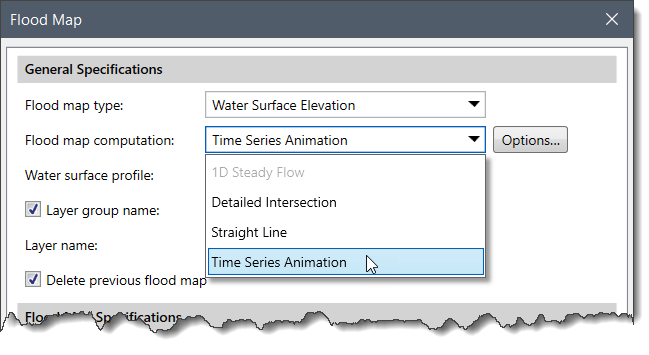
Follow the steps below to create the water surface elevation raster grid:
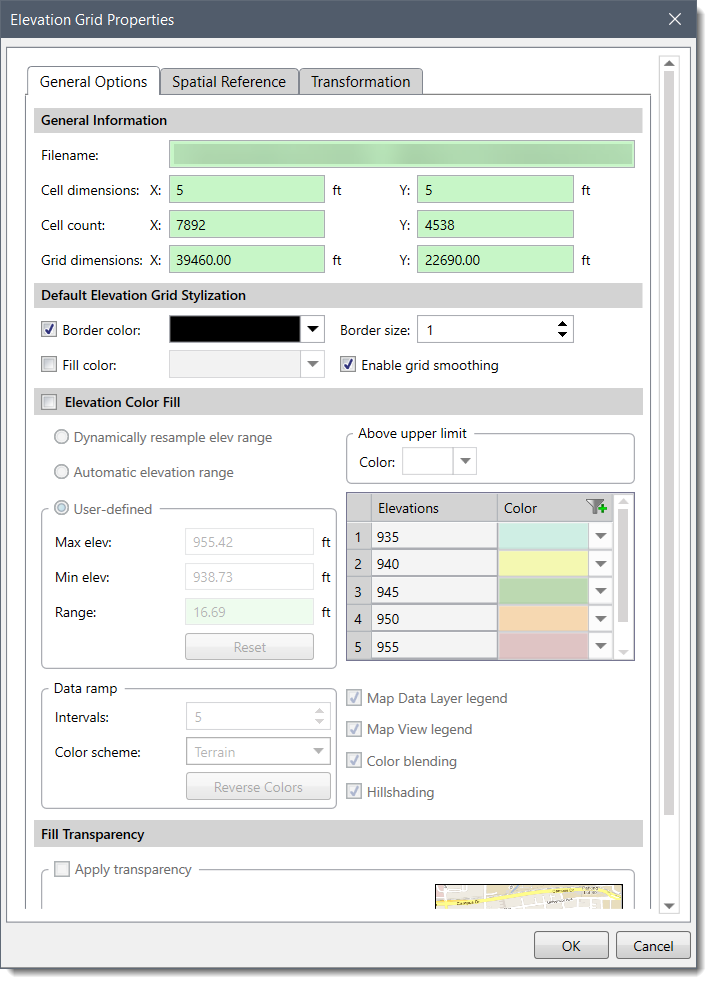
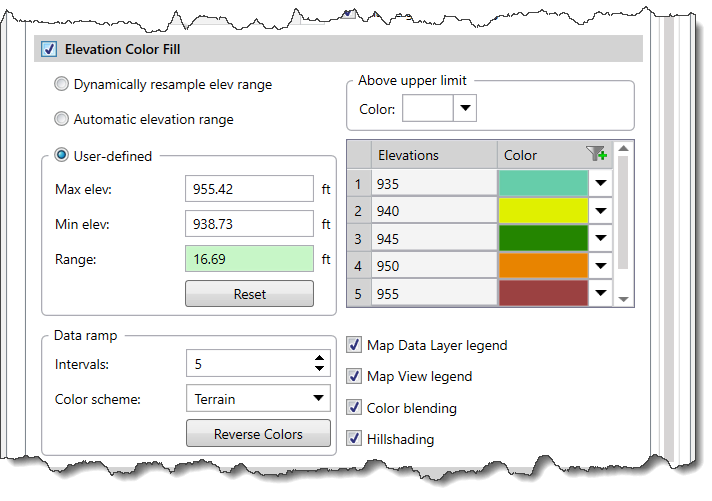
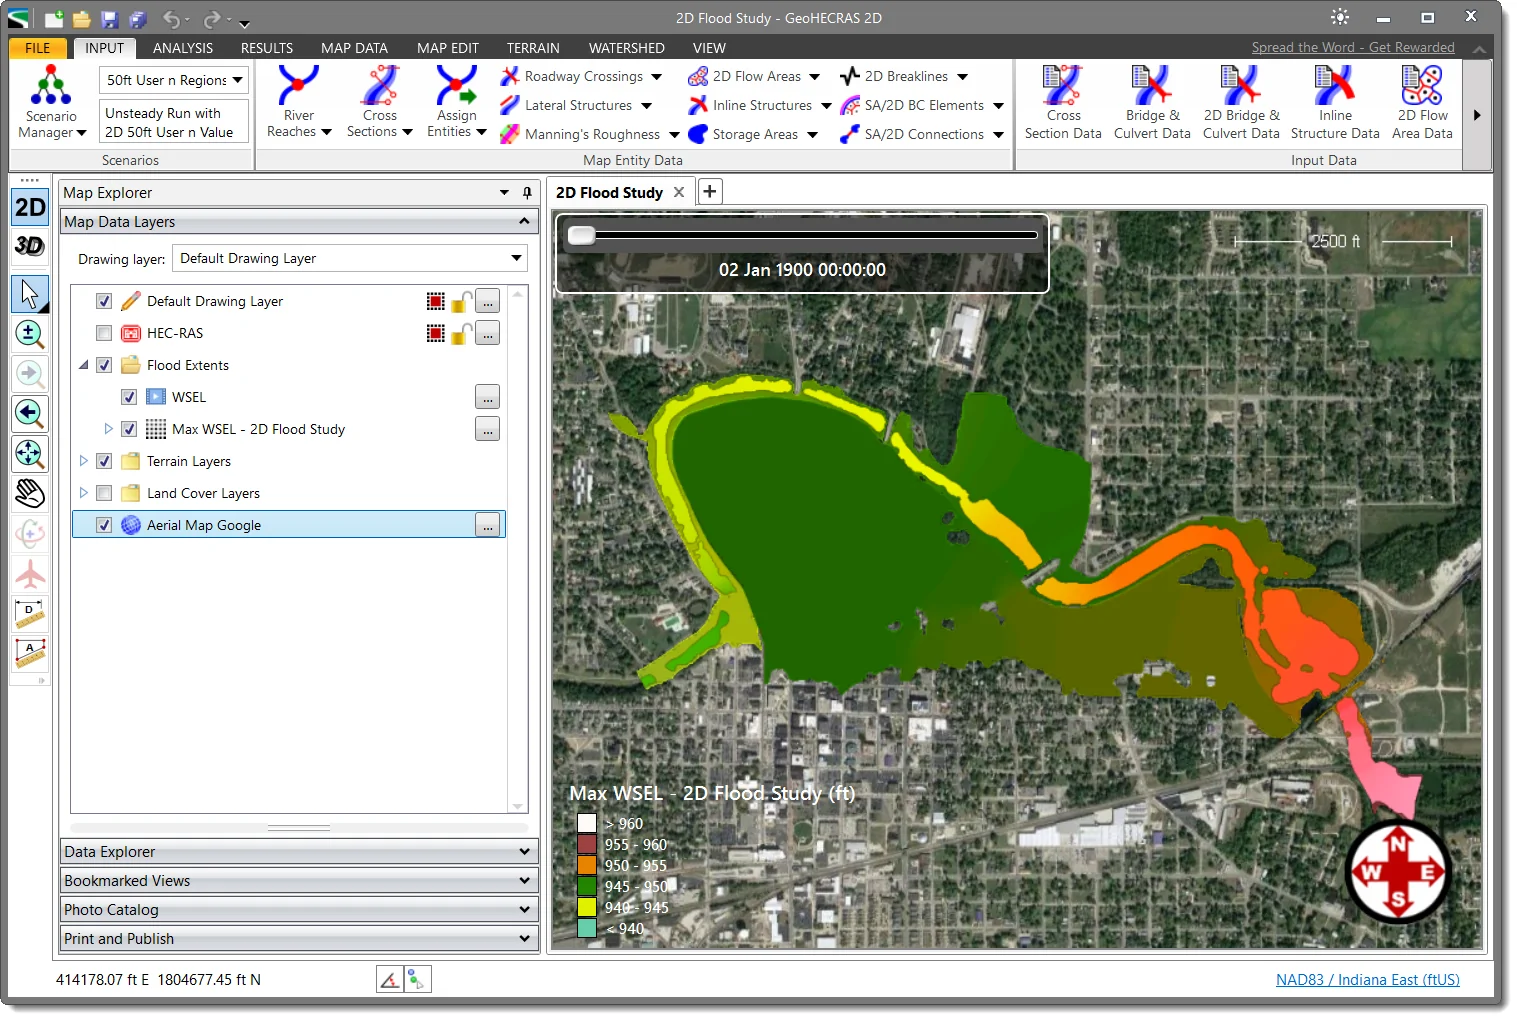
Once the elevation raster grid has been created, it will be automatically added to the Map Data Layers panel. If desired, the user can change the way the computed water surface elevation raster grid is displayed on the Map View.
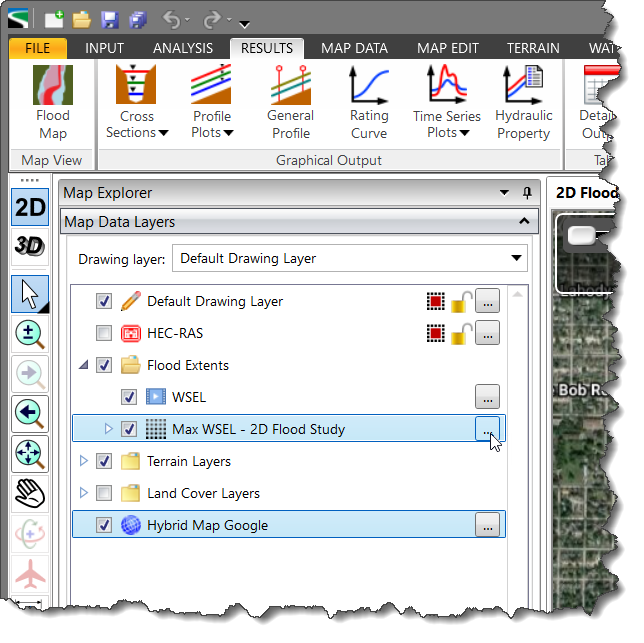
If the elevation raster is not displayed, turn off the display of other raster layers or online map layers that lie above the elevation raster in the Map Data Layers panel. The order of the layers listed in the Map Data Layers panel determines the display order of each layer, and there might be another layer that overlays the elevation raster layer. Alternatively, drag the elevation raster above the other layers listed in the Map Data Layers panel so that the elevation raster can be seen on the Map View.


CivilGEO G2 Reviews
4.8/5.0 Rating, Over 230 Reviews

GeoHECRAS is recognized as the top Civil Engineering Design Software with an average of 4.8 out of 5.0 rating from over 230 real user reviews on G2.


We use cookies to give you the best online experience. By agreeing you accept the use of cookies in accordance with our cookie policy.
When you visit any web site, it may store or retrieve information on your browser, mostly in the form of cookies. Control your personal Cookie Services here.


