You can change the display properties of the following HEC-RAS elements shown on the Map View:
- River Reaches
- Cross Sections
- Roadway Crossings (i.e., bridges and culverts)
- Inline Structures (i.e., dams)
- Lateral Structures (i.e., levees and flood walls)
- 2D Flow Areas
- Storage Areas (i.e., reservoirs and off channel storage)
- Storage Area Connections
- Profile Line Plots
- Time Series Nodes
- Pumps
- and more…
These same display properties are utilized when exporting the HEC‑RAS model to an AutoCAD drawing file.
To view or edit the display properties of different HEC-RAS elements, follow the steps below:
- In the Map Data Layers panel, click on the […] Properties button of the HEC-RAS layer.
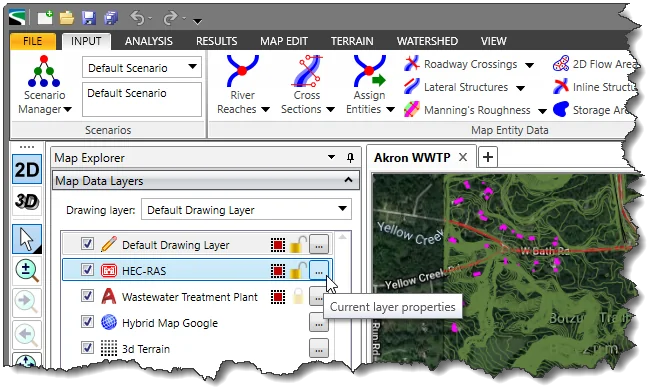
- The HEC-RAS Properties dialog box will be displayed.
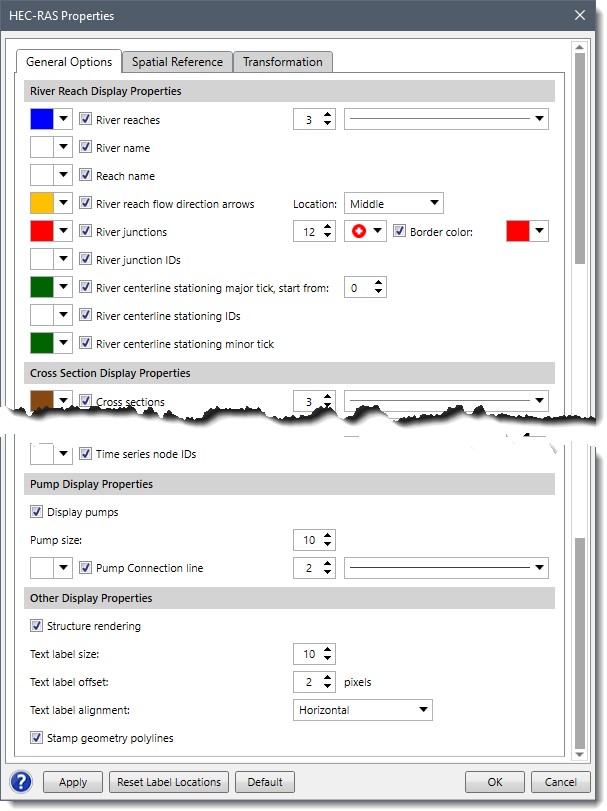
- In the General Options tab, scroll down through the dialog box to see all the available display options. The following sections are available:
- River Reach Display Properties
Use this section to configure the display properties of the river reaches.
You can turn the display on/off and configure the display properties of these items:
- River reaches
- River and Reach names
- River reach flow direction arrows
- River junctions and junction IDs
- River centerline stationing IDs, major, and minor tick
- Cross Section Display Properties
Use this section to configure the display properties of river cross sections. A cross section represents the geometry of the underlying terrain surface.
You can turn the display on/off and configure the display properties of these items:
- Cross sections
- Interpolated cross sections
- Cross section IDs and direction arrows
- Node names
- Roughness segments
- Bank stations
- Ineffective flow areas
- Conveyance obstructions
- Levee stations
- Internal Boundary Condition Display Properties
Use this section to configure the display properties of hydraulic structures, such as dams, bridges, culverts, levees, etc. in the model.
You can turn the display on/off and configure the display properties of these items:
- Roadway crossings and their IDs
- Sloping Embankment: Upstream, Downstream, and node names
- Inline structures, their IDs, and node names
- Lateral structures, their IDs, and node names
- 2D Flow Area Display Properties
Use this section to configure the display properties of 2D modeling entities, such as 2D flow areas, boundary conditions, bridge piers, land cover, 2D flow training structures, etc.
You can turn the display on/off and configure the display properties of these items:
- 2D flow area boundaries, cell faces, cell points, cell IDs, face points, face point IDs, area IDs, boundary face IDs, area breaklines, breakline IDs, and filled-in flow areas
- External BC lines and their IDs
- Internal BC lines and their IDs
- Initial condition points and their IDs
- Land cover regions and their IDs
- Bridge piers and bridge pier IDs
- 2D ineffective flow areas and their IDs
- 2D conveyance obstructions and their IDs
- 2D meshing zones and their IDs
- Patch meshes and their IDs
- Patch faces and nodes
- 2D flow training structures and their IDs
- Storage Area Display Properties
Use this section to configure the display properties of storage area elements, such as reservoirs and off-channel storage.
You can turn the display on/off and configure the display properties of these items:
- Storage Areas and their IDs
- Filled-in storage areas
- SA/2D connections and their IDs, flow directions arrows, and weirs
- Profile Line Plots
Use this section to configure the display properties of profile line plots and their IDs on the Map View. Profile line plots are used for plotting results from a 2D flow area. The data is extracted longitudinally, like a profile plot.
- Time Series Nodes
Use this section to configure the display properties of time series nodes and their IDs on the Map View. Time series nodes are used for generating a time series plot and the time series data at that node.
- Pump Display Properties
Use this section to turn the display on/off and to change the size of pumps on the Map View. You can also turn on/off and configure the display properties of the pump connection lines.
- Other Display Properties
You can use this section to turn the display on/off for Structure rendering, Stamp geometry polylines, and can also configure the display properties of these items:
- Text label size
- Text label offset
- Text label alignment
- After configuring the above display settings, click the [OK] button to apply them on the map view.
![Click the [OK] button to apply](/wp-content/uploads/sites/25/2014/11/HEC-RAS-Element-Display-properties-Imge-3.jpg)
Notes:
- To restore the default display settings, click the [Default] button.
- To restore the HEC-RAS labels to their default locations, click the [Reset Label Locations] button.
- To update any changes in the dialog box without closing it, click the [Apply] button.


