
Welcome to CivilGEO Knowledge Base
Welcome to CivilGEO Knowledge Base
Cross sections are developed based on the location layout of cross section lines and the properties of other layers such as the rivers, bank lines, and terrain layers. Cross sections should be laid out perpendicular to where water will flow in the channel and overbank areas. Most cross section lines are created from a minimum of four points (i.e., the end points and points at the edge of the main channel). Cross sections will also be visualized when looking in the downstream direction; therefore, they should be created from left to right when looking downstream. There are many considerations when developing cross section data in terms of orientation, location, and spacing, but keep in mind that the cross sections should represent a smooth transition in geometry (elevation and area) and properties (conveyance, surface roughness, etc.). It is always recommended to use the terrain, river centerline, bank lines, flow path lines, inundation mapping, and other data to properly place cross section lines.
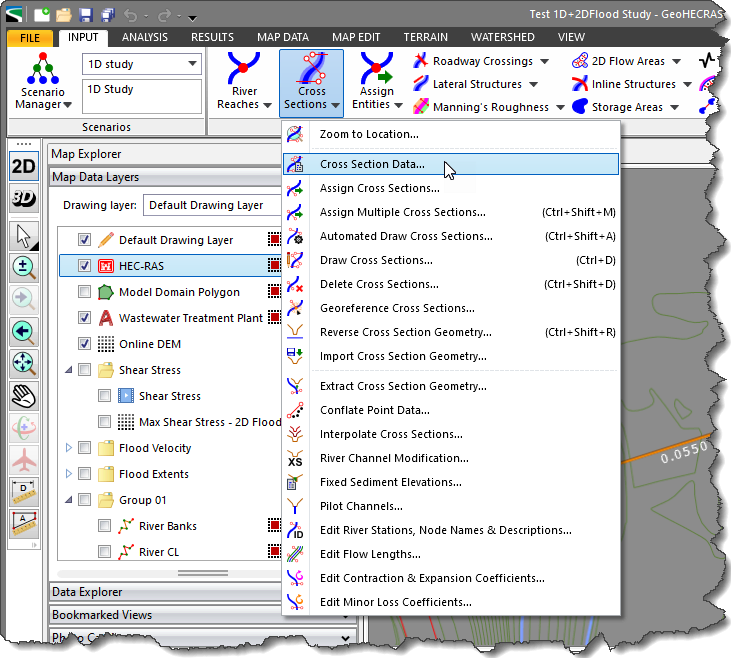
Follow the steps below to view or modify the cross section data in GeoHECRAS:
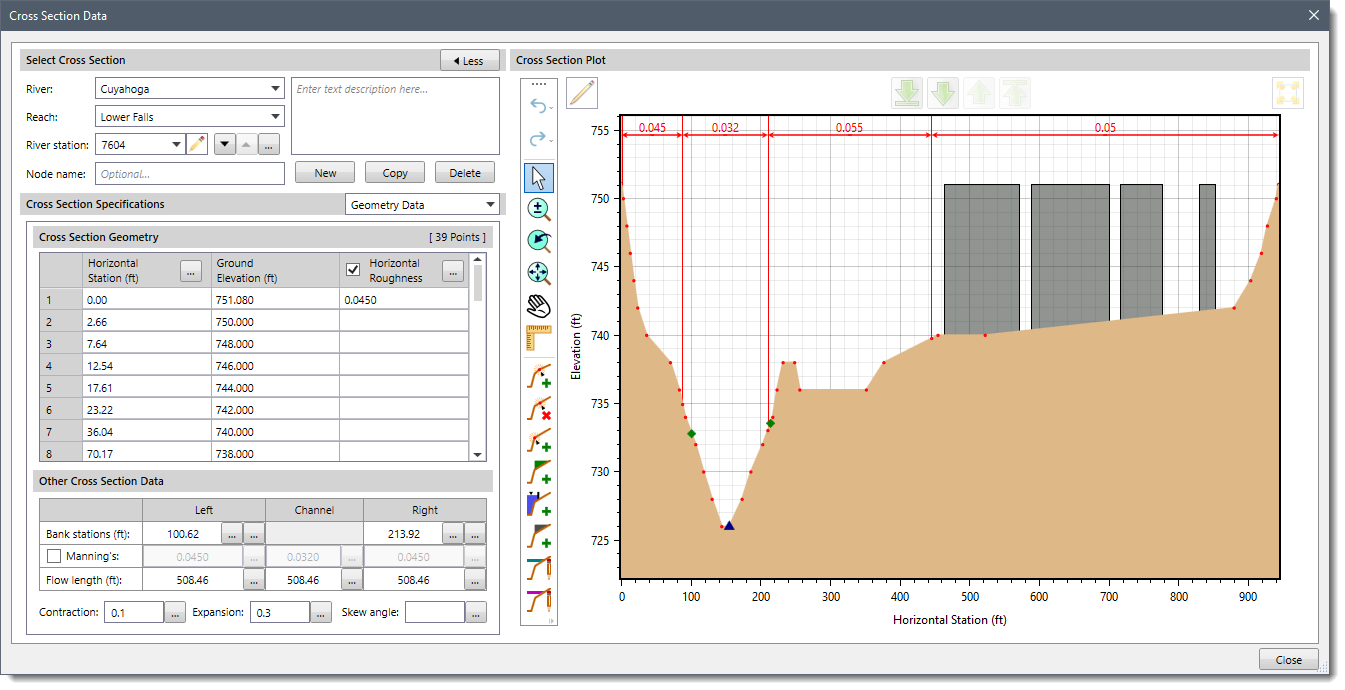
The following sections describe how to define the cross section data and interact with the above dialog box.
The Select Cross Section panel allows the user to select a cross section for purposes of defining the cross section data.
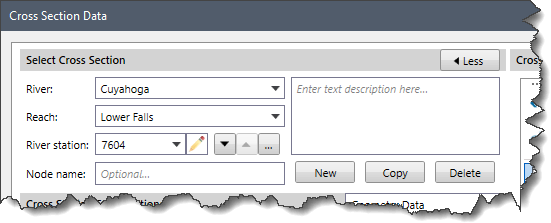
This section contains the following options:
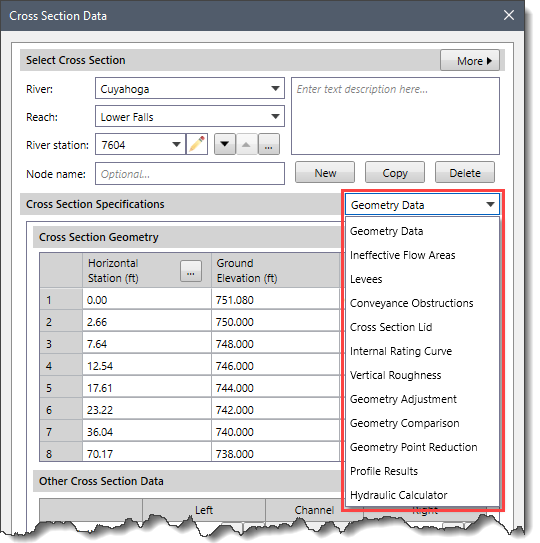
Once the desired cross section is selected, the user can switch between the following panels from the Cross Section Specifications dropdown entry to view and edit the associated cross section data.
This section contains a dropdown combo box with the following data panel entries, which allow the user to define cross section data:
This data panel allows the user to define the geometry data of the current cross section.
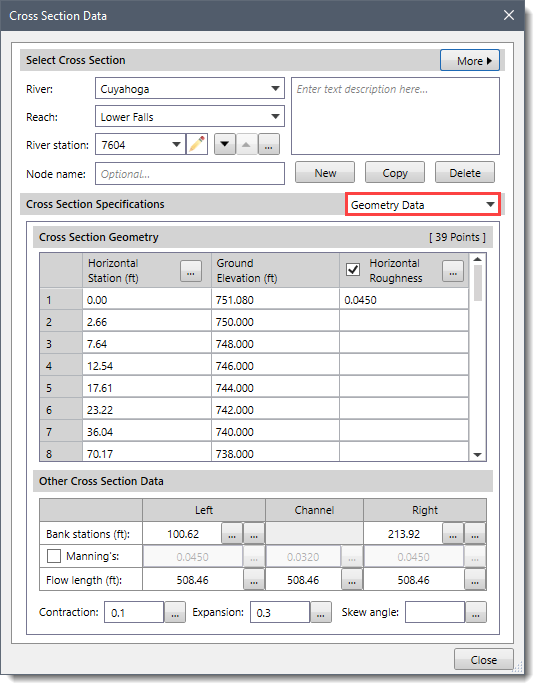
The Geometry Data panel contains the following sections:
This section of the panel provides a table for entering and editing cross section geometry. The top right corner of the table header displays the number of points for the current cross section. This allows the user to quickly determine which cross sections need to be reduced in terms of total number of ground points.
The table contains the following columns:
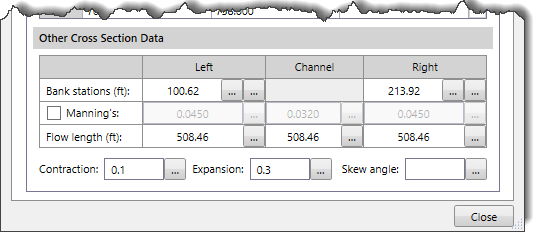
This section of the panel defines the following additional cross section data.
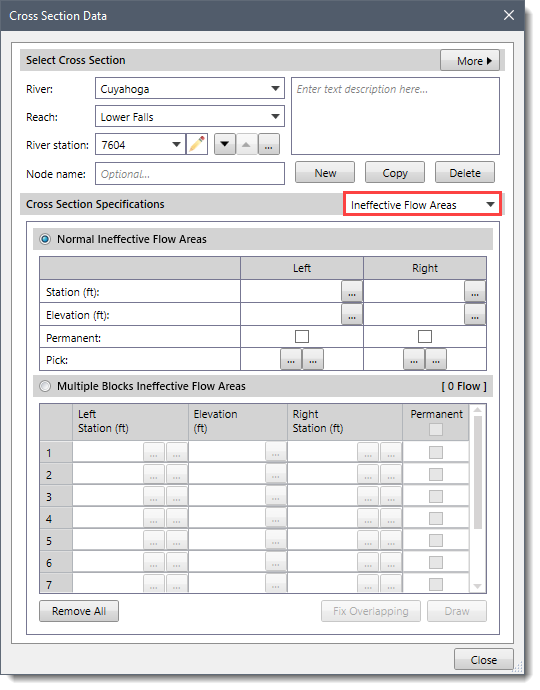
This data panel allows the user to define ineffective flow areas of the cross section, which represent water that is not actively being conveyed. Refer to this article in our knowledge base to learn more about ineffective flow areas.
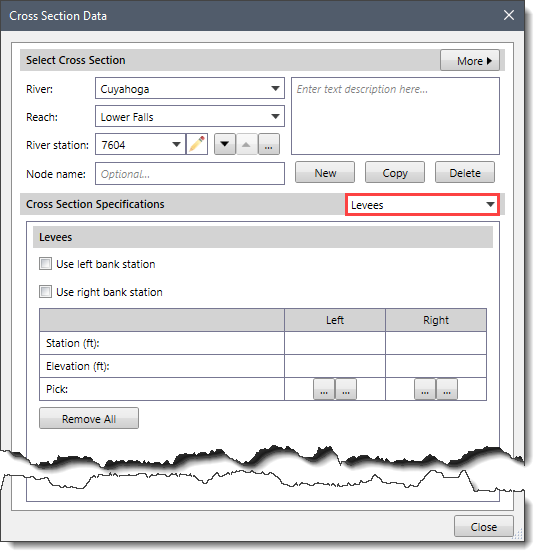
This data panel allows the user to define levees to constrain the flow to the main channel by defining a left and/or right levee station and corresponding elevation at a cross section. Refer to this article in our knowledge base to learn more about levees.
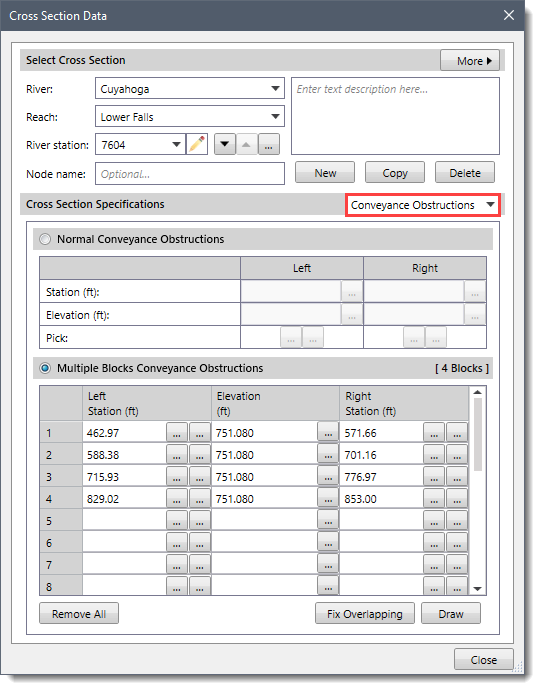
This data panel allows the user to define areas at a cross section that are permanently blocked from conveying flow. Refer to this article in our knowledge base to learn more about conveyance obstructions.
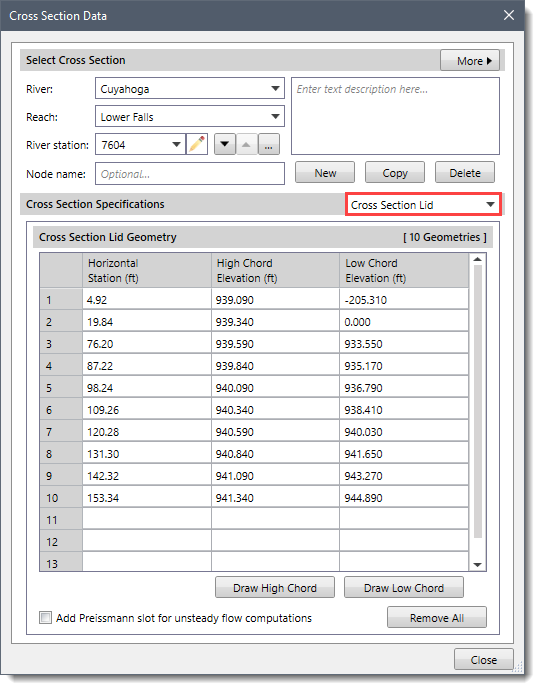
This data panel allows the user to define long pipes or tunnels over a flow direction. Refer to this article in our knowledge base to learn more about cross section lids.
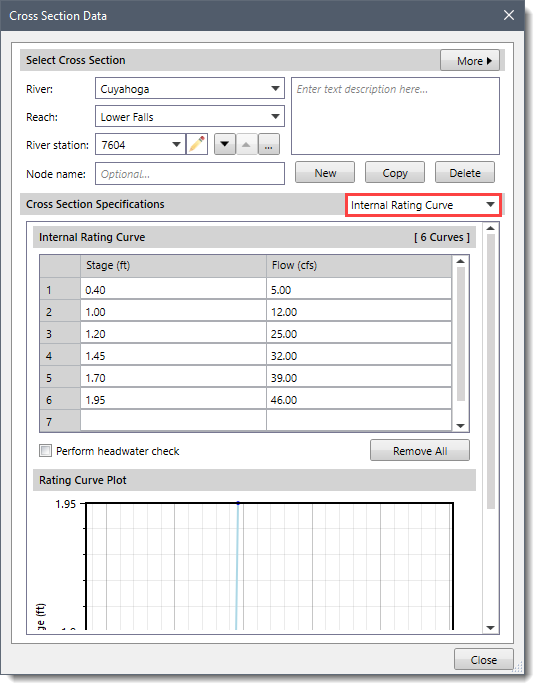
This data panel is used to define a rating curve (Stage vs Flow curve) at the current cross section. By defining a rating curve at a cross section, the software will use the rating curve to lookup the corresponding water surface elevation rather than computing the water surface elevation.
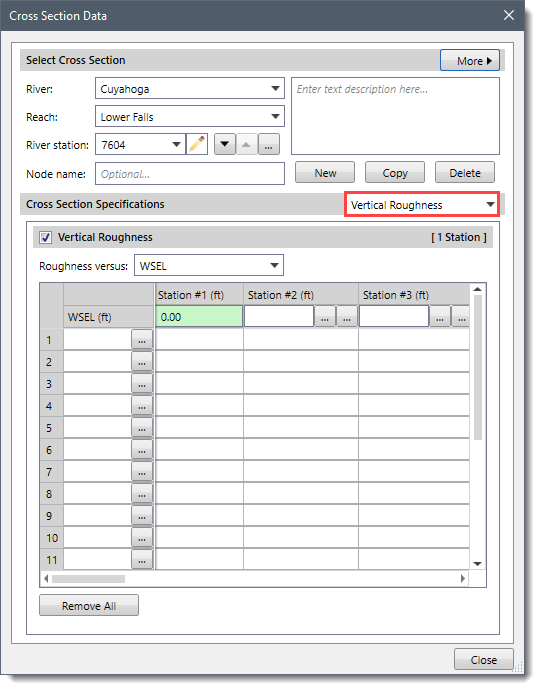
This data panel allows the user to define the vertical variation of Manning’s roughness for cross sections. This panel allows the user to enter Manning’s roughness values that vary both horizontally as well as vertically. After enabling the Vertical Roughness section, the user can define the data between Roughness versus Flow or Roughness versus WSEL. In this way, the user can vary the roughness value either by elevation or discharge rate. During the computations, HEC-RAS will interpolate Manning’s roughness whenever the computed water surface elevation is between the user-defined elevations. If the computed water surface elevation is below the lowest elevation defined, then the roughness values from that lowest elevation will be used. Similarly, if the computed water surface elevation is above the highest elevation defined, the roughness values from that highest elevation will be used.
This data panel is used to adjust geometry for the current cross section or other cross sections.
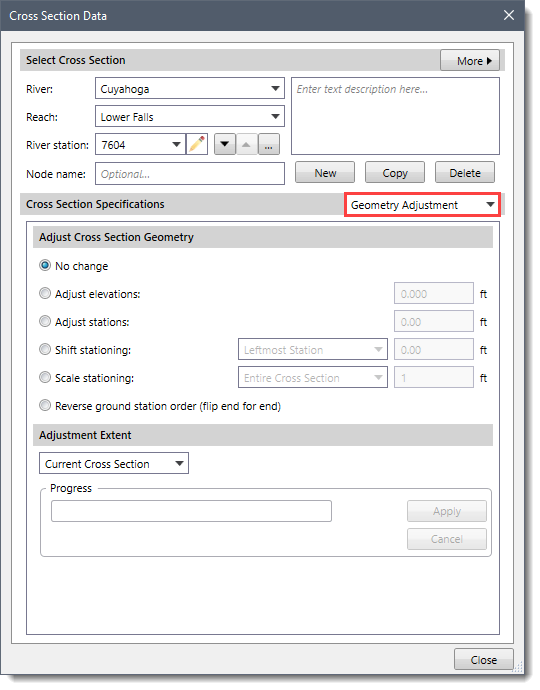
This section allows the user to define the type of adjustment to be applied to the cross section geometry.
This section contains the following options:
This section is used to select which cross sections and river reaches are to be changed by the specified adjustment. If bridge structures or inline structures are defined for selected reach(s), then their corresponding cross section geometry is also adjusted.
Clicking the [Apply] button applies the defined cross section adjustment method.
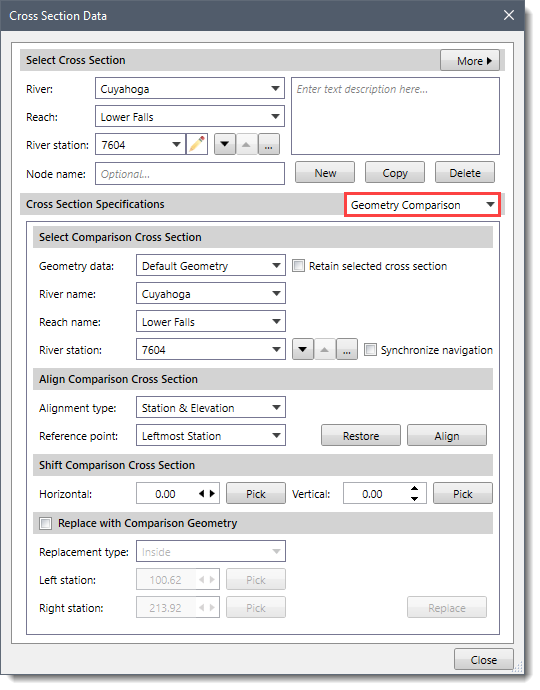
This data panel allows the user to select a comparison cross section to display in the cross section plot, align the comparison cross section with the current cross section, and replace the current cross section with the selected portion of the comparison cross section. Refer to this article in our knowledge base to learn more about geometry comparisons.
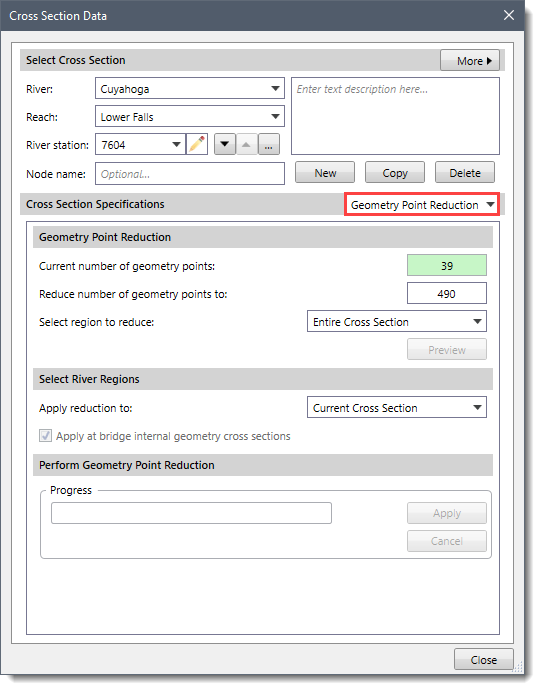
This data panel allows the user to automatically filter out unnecessary station-elevation points for Cross Section Geometry, Roadway Geometry, Inline Structure Crest Geometry, and Lateral Structure Crest Geometry. Refer to this article in our knowledge base to learn more about geometry point reduction.
This data panel allows the user to select the analysis results on the cross section plot. The table displayed under the Profile Results section lists all of the analyzed water surface profiles, allowing the user to specify for which profiles the results should be displayed.
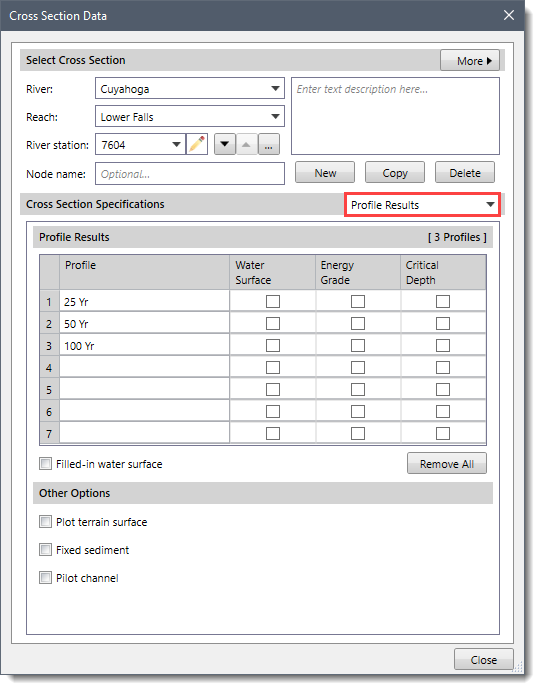
This data panel contains the following sections:
This section contains the following options:
This section allows the user to enable additional curves for the plot terrain surface, fixed sediment, and pilot channel in the cross section plot.
This data panel allows the user to choose an unknown variable and the software will then automatically compute the solution after the user enters the known parameters. For example, for a given water surface elevation (WSEL) and energy (or bed) slope, the software will compute the discharge rate. It accounts for Manning’s roughness subareas, but does not account for ineffective flow areas, conveyance obstructions, levees, or lids.
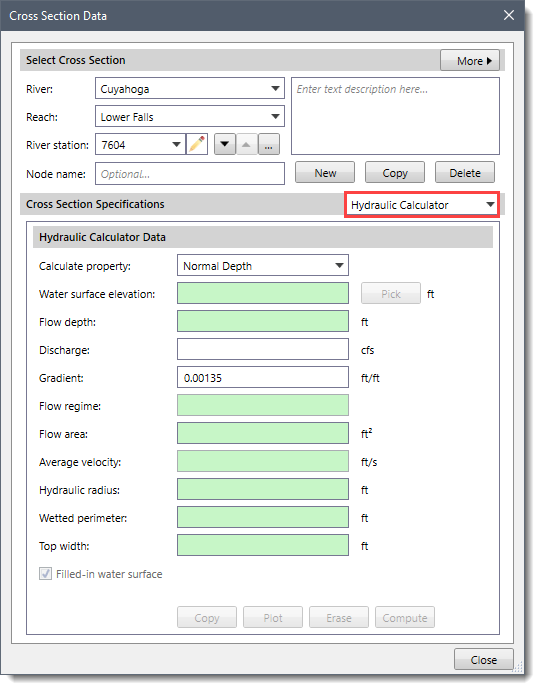
Selecting Normal Depth from the Calculate property dropdown combo box enables the Discharge and Gradient entry fields. The user can enter these entry fields and click the [Compute] button to compute all the associated hydraulic parameters under the Hydraulic Calculator Data section.
Similarly, selecting Normal Discharge from the Calculate property dropdown combo box enables the Water surface elevation, Flow depth, and Gradient entry fields. The user can enter these entry fields and click the [Compute] button to compute all the associated hydraulic parameters.


CivilGEO G2 Reviews
4.8/5.0 Rating, Over 230 Reviews

GeoHECRAS is recognized as the top Civil Engineering Design Software with an average of 4.8 out of 5.0 rating from over 230 real user reviews on G2.


We use cookies to give you the best online experience. By agreeing you accept the use of cookies in accordance with our cookie policy.
When you visit any web site, it may store or retrieve information on your browser, mostly in the form of cookies. Control your personal Cookie Services here.


