
Welcome to CivilGEO Knowledge Base
Welcome to CivilGEO Knowledge Base
Cross sections are developed based on the location layout of cross section lines and properties from other layers such as the river reach, bank lines, and terrain layers. Cross sections should be drawn perpendicular to where water will flow in the channel and overbank areas. Cross sections are used to route the flow from one node to another in the basin model.
When selecting a routing method, multiple options are provided for specifying the cross-section shape: circular, 8-point, rectangle, tabular, trapezoid, and triangular. Depending upon the chosen shape, additional information must be entered to describe the size and shape of the cross-section. The user can select the cross section shape and define the additional information for the selected shape in the Routing Data panel of the Reach Data dialog box. However, for 8-point and tabular cross sections, this data can also be defined and modified in the Cross Section Data dialog box.
Note that the 8-Point cross section can be defined for both the Muskingum Cunge and Normal Depth routing methods. However, the tabular cross section can only be defined for the Muskingum Cunge routing method.
Refer to this article in our knowledge base to learn more about HEC-HMS routing methods.
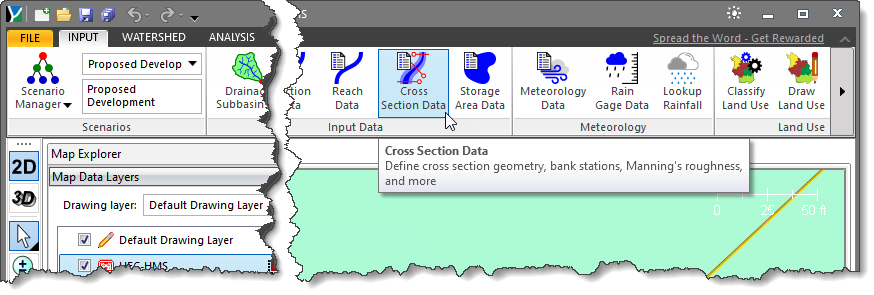
GeoHECHMS can automatically extract and simplify the cross section geometry into an 8-point cross section and store this data in the Cross Section Data dialog box. This dialog box contains the geometry data, bank station, Manning’s roughness, and other related data.
Follow the steps below to view or modify the cross section data:
 Alternatively, the user can either double-click on the cross section polyline from the Map View or choose the Cross Section Data command from the Cross Sections dropdown menu of the Input ribbon menu.
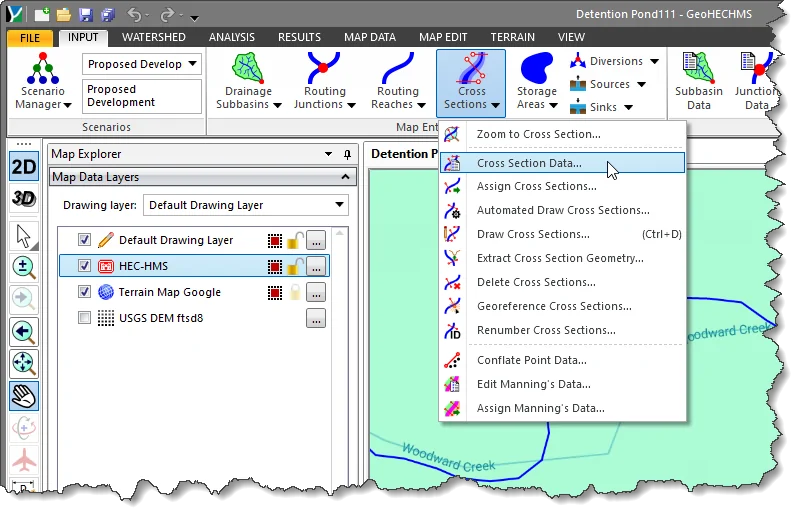
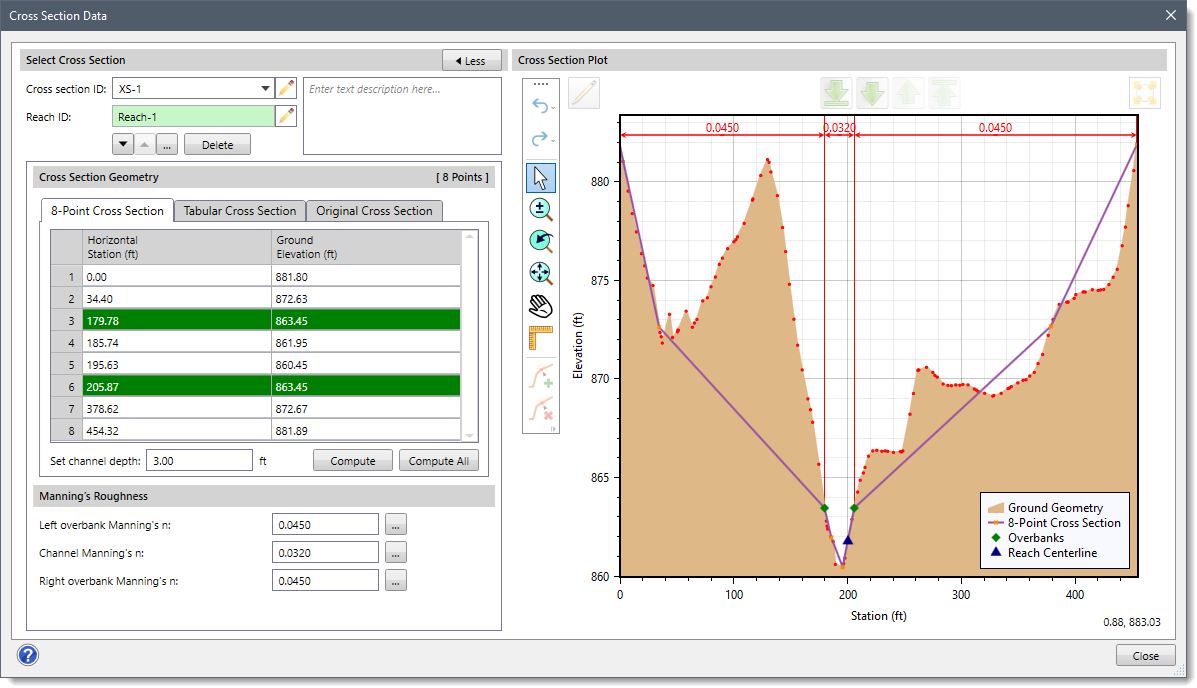
The following sections describe how to define the cross section data and interact with the above dialog box.
This section allows the user to select the cross section for defining the cross section data.
The Cross section ID dropdown combo box lists the cross section IDs of the irregular cross section geometry already defined. This allows the user to select a cross section geometry that has already been defined. Click the pencil icon and select the cross section ID to edit the cross section data.
Note that this data field is mapped to the Cross section ID field defined for the Muskingum Cunge routing method of the Reach Data dialog box. Changing the value in either field will update the value in the other field.
The [Delete] button can be used to delete the current cross section geometry and corresponding cross section ID.
The corresponding reach for the selected cross section is displayed in the Reach ID read-only field. However, in HEC-HMS it is possible to create multiple reaches that reference the same irregular cross section geometry. In those situations, this field shows Not Available. If there is a one-to-one relationship so that the cross section is assigned to a single river reach, the pencil icon will be enabled. Clicking on the pencil icon will allow the user to edit the reach ID.
The user can navigate between previous and next cross sections using the up and down arrow buttons. Alternatively, the user can click the […] button to select the cross section from the Map View.
Note that the up and down arrow buttons will be disabled (i.e., grayed out) when the model contains only a single cross section.
This section contains the data for the 8-point cross section, tabular cross section, and original cross section geometry.
This panel defines the station-elevation data for the 8-point cross section shape. The cross section is usually configured to represent the main channel plus left and right overbank areas. A separate Manning’s n value is entered for each overbank. The cross section should extend from the channel invert up to the maximum water surface elevation that will be encountered during a simulation.
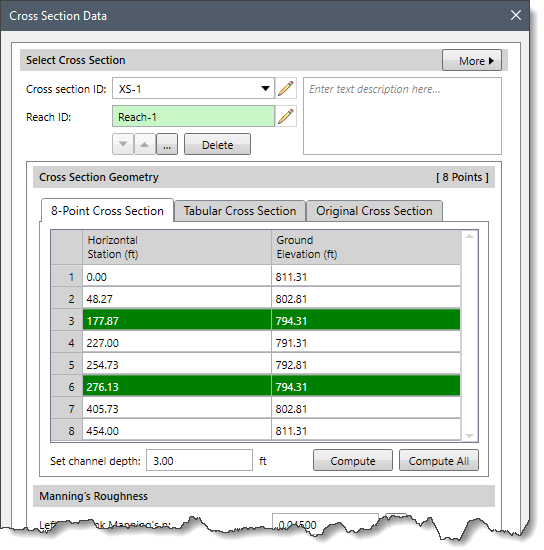
The following parameters are provided in this panel:
Clicking the [Compute] button allows the user to recompute 8-point and tabular cross section geometry for the current reach. For recomputing the 8-point and tabular cross section geometry of all reaches at once, the user can click the [Compute All] button.
After extracting a cross section from the terrain surface, the software can compute an equivalent tabular representation of the cross section—similar to how an 8-point cross section is defined. This panel is used to store the data used by HEC-HMS for tabular cross sections.
The tabular shape cross section allows the use of user-defined elevation vs. discharge, elevation vs. flow area, and elevation vs. top width relationships. Tabular cross sections are typically used when relationships derived from hydraulic simulations are available. For tabular cross sections, no Manning’s n roughness coefficients need to be entered.
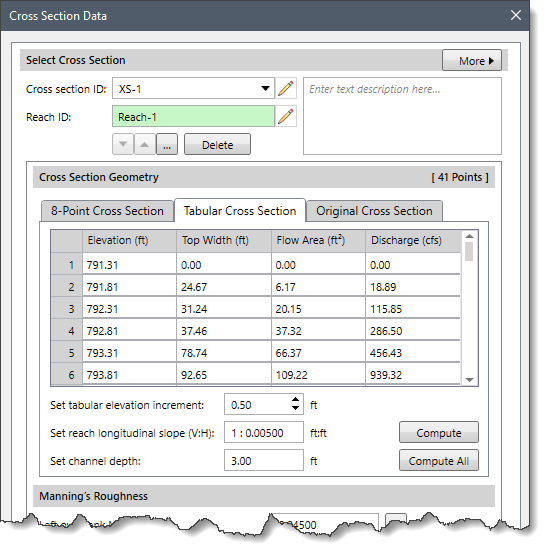
The following parameters are provided in this panel:
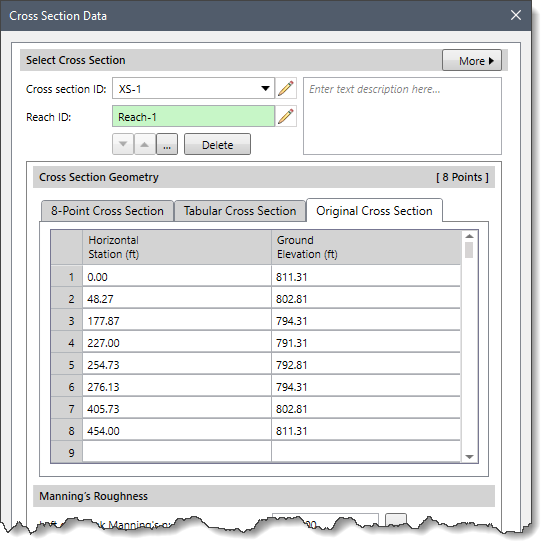
This panel displays the original cross section geometry that was retrieved from the underlying terrain model. However, HEC-HMS does not use this data.
This section allows the user to enter Manning’s roughness values for the left overbank, main channel, and right overbank.
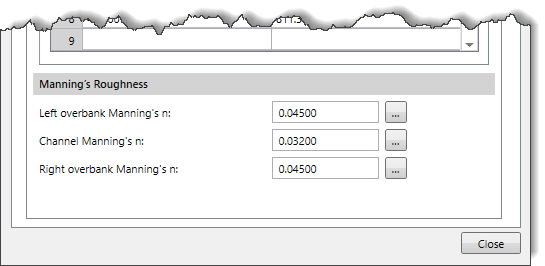
The following parameters are provided in this section:
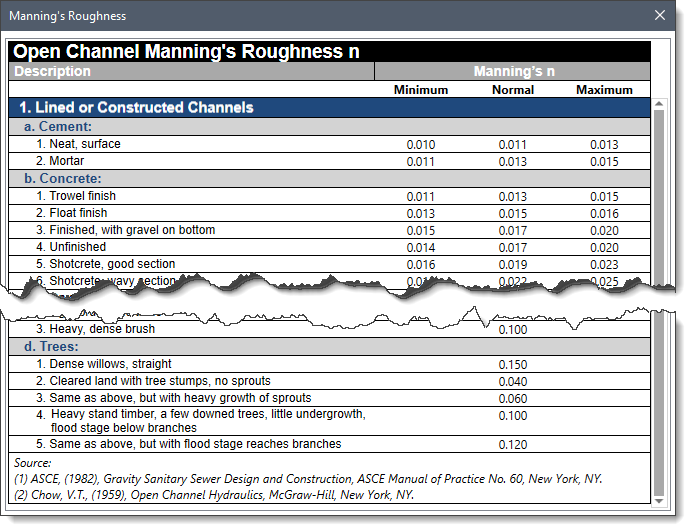
Clicking on the […] lookup button will display a Manning’s Roughness lookup table dialog box.
This section displays the profile plot of the cross section geometry. It contains a tool palette that allows the user to zoom, pan, select, edit, navigate, and perform other functions on the cross section plot.
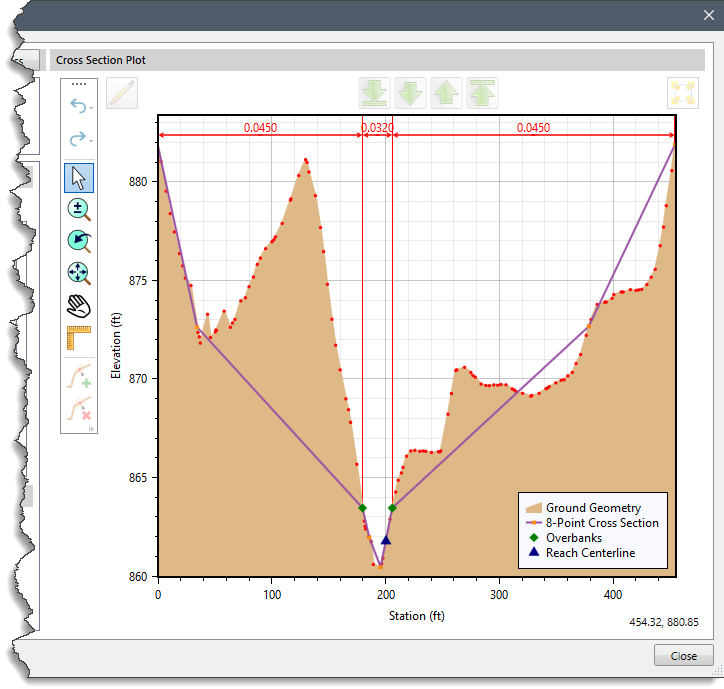
For an 8-point cross section, the plot will show both the 8-point cross section geometry and the original cross section geometry (if it exists) as two separate lines. The lines have different colors so that the user can distinguish between the two cross sections. The user can modify the 8-point cross section geometry using the tool palette to better match the actual cross section geometry.
For a tabular cross section, the plot will show both the tabular cross section geometry and the original cross section geometry (if it exists) as two separate lines. The user cannot modify the tabular cross section geometry.


CivilGEO G2 Reviews
4.8/5.0 Rating, Over 230 Reviews

GeoHECRAS is recognized as the top Civil Engineering Design Software with an average of 4.8 out of 5.0 rating from over 230 real user reviews on G2.


We use cookies to give you the best online experience. By agreeing you accept the use of cookies in accordance with our cookie policy.
When you visit any web site, it may store or retrieve information on your browser, mostly in the form of cookies. Control your personal Cookie Services here.


