
Welcome to CivilGEO Knowledge Base
Welcome to CivilGEO Knowledge Base

Welcome to CivilGEO Knowledge Base
Welcome to CivilGEO Knowledge Base
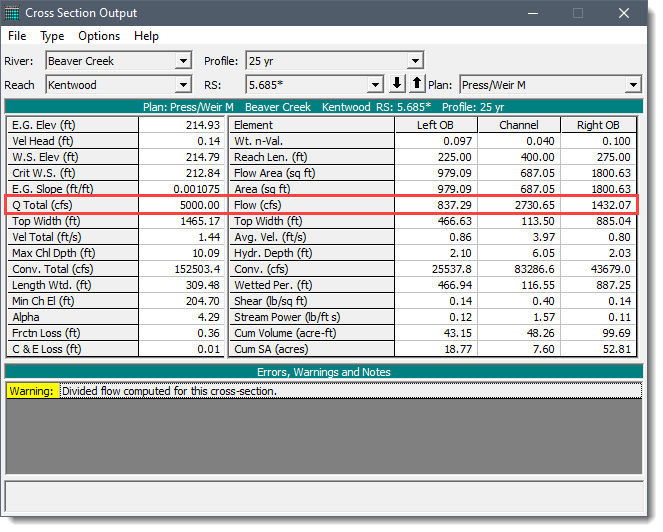
The general cross section output shows the distribution of flow in three subdivisions of the cross section: left overbank, main channel, and the right overbank.
Additional output showing the distribution of flow for multiple subdivisions of the left and right overbanks as well as the main channel can be requested for either steady flow or unsteady flow analysis. Select the Flow Distribution Locations command from the Analysis ribbon menu.

Selecting this ribbon menu command will display the Flow Distribution Locations dialog box.
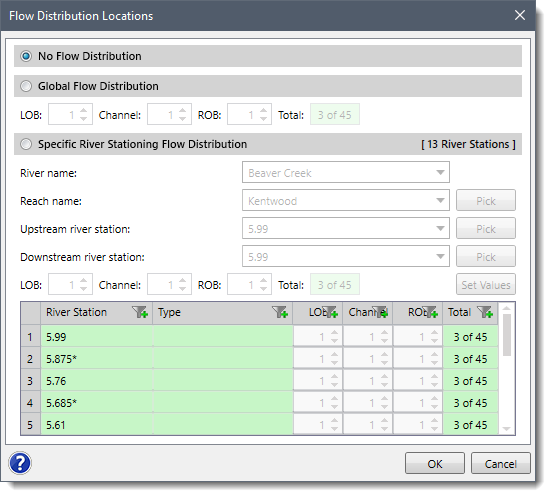
By default, there is no flow distribution selected. However, the user can either define a flow distribution globally or at specific cross section locations.
Next, the number of flow slices for the flow distribution computations must be defined for the left overbank, main channel, and the right overbank. Up to 45 total flow slices can be defined. Each flow element (i.e., left overbank, main channel, and right overbank) must have at least one flow slice. The user can change the number of slices used at each of the cross sections.
During the HEC‑RAS steady flow or unsteady flow computations, at each cross section where flow distribution is requested, the HEC‑RAS program will calculate the following for each flow slice:
The computations for the flow distribution are performed after the program has computed a water surface elevation and energy gradeline by the normal methodology. The flow distribution computations are performed as follows:
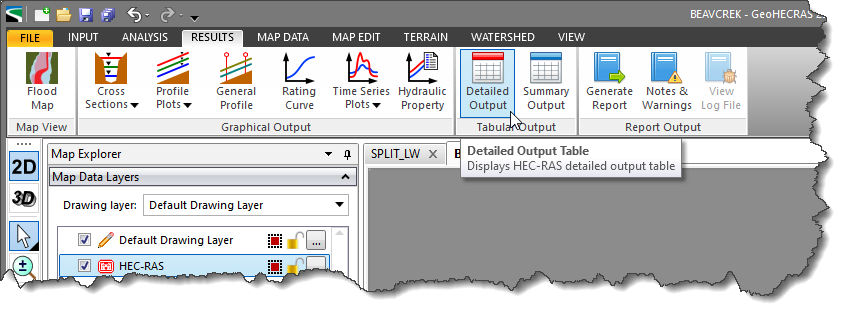
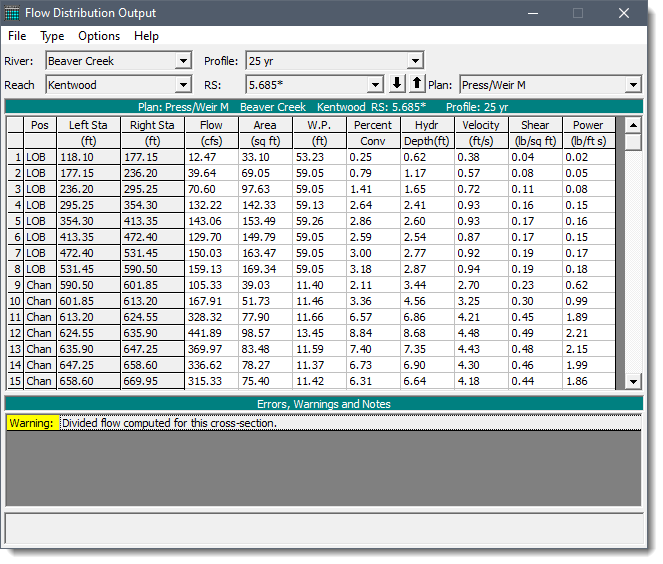
To display the flow distribution output table for a cross section, select Detailed Output command from the Results ribbon menu.
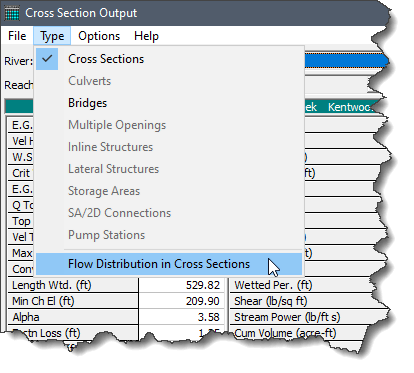
The Cross Section Output dialog box will be displayed. From this dialog box, select Flow Distribution in Cross Sections from the Type menu.
The dialog box will change to display the flow distribution output table, as shown below.
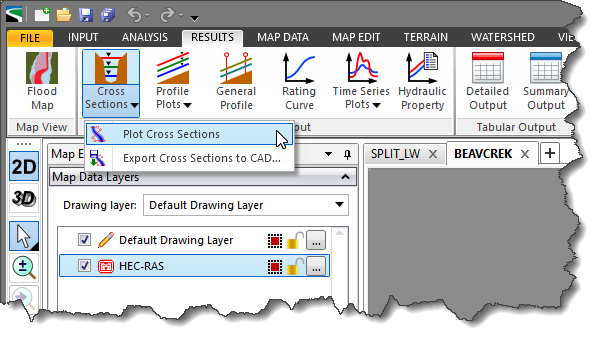
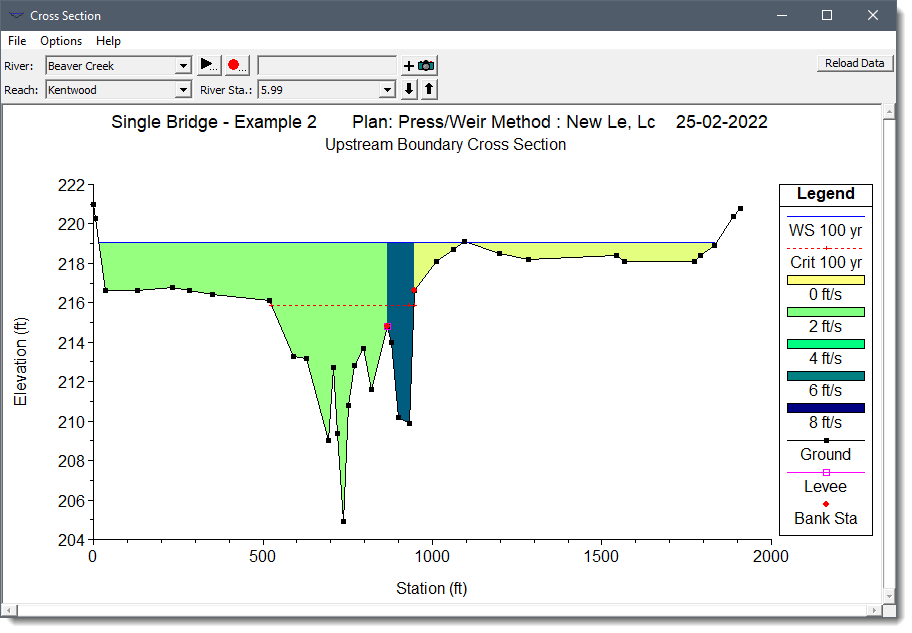
To display the flow distribution on the cross section plot, select the Plot Cross Sections command from the Cross Sections menu item of the Results ribbon menu.
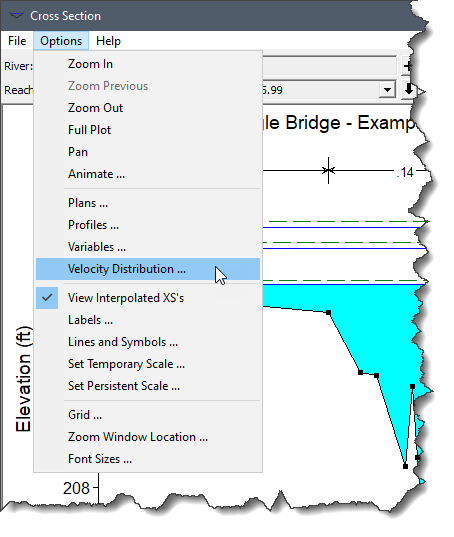
The Cross Section dialog box will be displayed. From this dialog box, select Velocity Distribution from the Options menu.
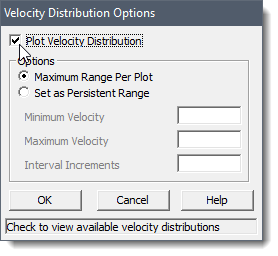
The Velocity Distribution Options dialog box will be displayed. Check the Plot Velocity Distribution checkbox option and then click the [OK] button.
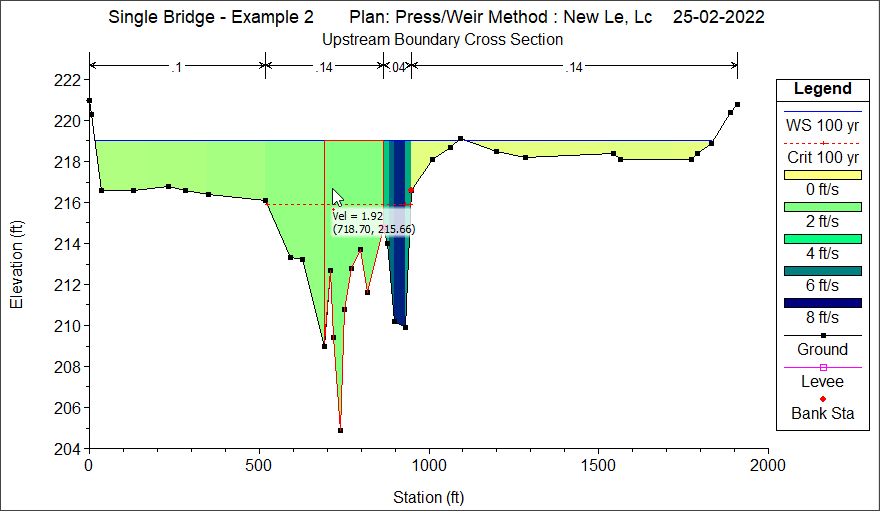
The velocity distribution will then be plotted on the cross section plot.
By clicking on a specific velocity segment on the cross section plot, the software will report the velocity at the selected location.
In general, the results of the flow distribution computations should be used cautiously. Specifically, the velocities and percentages of discharge are based on the results of a one‑dimensional hydraulic model. A true velocity and flow distribution varies vertically as well as horizontally. To achieve such detail, the user would need to use a three‑dimensional hydraulic model or go out and measure the flow distribution in the field. While the results for the flow distribution provided by HEC‑RAS are better than the standard three subdivisions (left overbank, main channel, and right overbank), the values are still based on average estimates of the one dimensional results. Also, the results obtained from the flow distribution option can vary with the number of slices used for the computations. In general, it is better to use as few slices as possible.
 1-800-301-02-955
 608-729-5100
(US and Canada)
 [email protected]
 +1 608-729-5100
CivilGEO India
Graphix Tower, A-13 A
3rd Floor, Sector 62
Noida, Uttar Pradesh 201309
IndiaTel:
1-800-301-02-955 or
+91 022-3831-8601
CivilGEO United States
8383 Greenway Blvd
6th Floor
Middleton, WI 53562
USATel:
608-729-5100 or
800-488-4110
Copyright © CivilGEO, Inc. All rights reserved. The CivilGEO logo, “GeoHECHMS”, “GeoHECRAS”, and “Ready To Engineer” are registered trademarks of CivilGEO,
Inc. All other brands, company names, product names or trademarks belong to their respective holders.
We use cookies to give you the best online experience. By agreeing you accept the use of cookies in accordance with our cookie policy.
When you visit any web site, it may store or retrieve information on your browser, mostly in the form of cookies. Control your personal Cookie Services here.
The ZoomInfo WebSights snippet drops three cookies to track Unique Visits:
1. _pxhd - Related to the Perimeter X security layer (Perimeter X isused to prevent bot attacks).
2. _cfduid - Related to the CloudFlare security layer (CloudFlare is the Network Security protocol that ZoomInfo uses to orchestrate the rate limiting rules).
3. visitorId - This is how WebSights identifies recurring visitors


