
Welcome to CivilGEO Knowledge Base
Welcome to CivilGEO Knowledge Base
This article demonstrates how to convert an ESRI TIN file to an elevation contour shapefile using ArcGIS and the 3D Analyst and (optionally) Spatial Analyst extensions.
A Triangulated Irregular Network (TIN) is a vector representation of a ground surface. An elevation contour dataset represents lines of equal elevation.
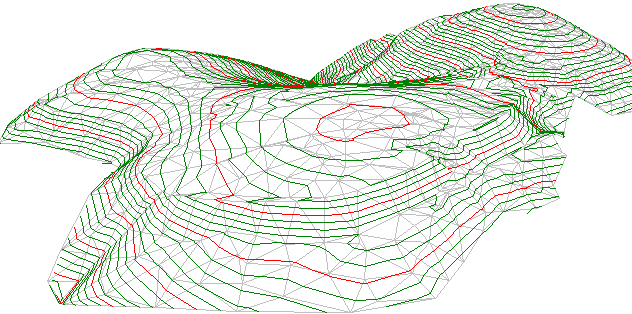
TIN surface with overlaid contours
While both formats store elevation data, TINs are less widely supported in GIS and CAD packages. They are also more computationally intensive to render, and large datasets can take a long time to draw on screen. In addition, ESRI TIN and Terrain Datasets are in proprietary format and are only supported by ESRI software products making it very difficult to share with other software applications.
Elevation contours on the other hand are faster to render, and are supported by a wider variety of software applications.
While it is possible to convert a TIN directly to a contour shapefile, better results are achieved by first converting the TIN to an elevation raster (grid) and then creating contours from the elevation raster. Contours produced directly from a TIN file tend to contain topological errors and have rough jagged edges. Contours produced from an elevation raster tend to be smoother, more aesthetically pleasing, and contain fewer topological errors.
This article will utilize an elevation grid for creation of the contour shapefile. For instructions on how to create an elevation raster from a TIN, see this article.
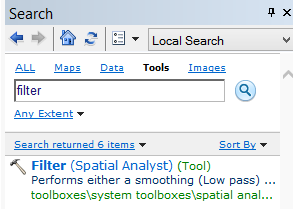
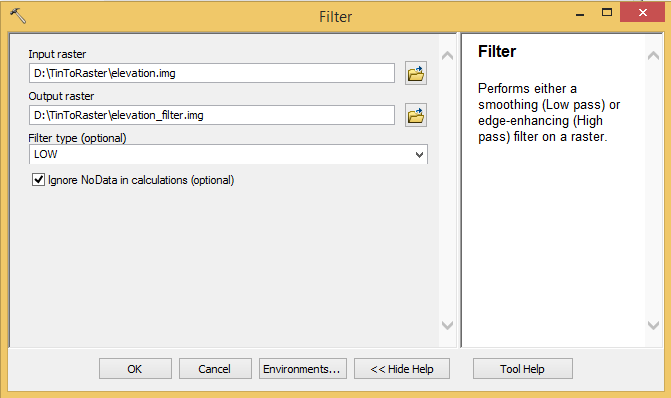
Before creating contours from the elevation raster, it is a good idea to first filter the input raster in order to remove any anomalous cells. This reduces the number of isolations (small, insignificant peaks) created by the contour tool.
Note: This tool requires the Spatial Analyst extension. If this extension is not available, continue on to the next step and use the unfiltered raster.
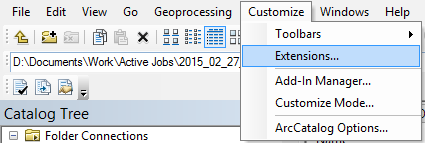
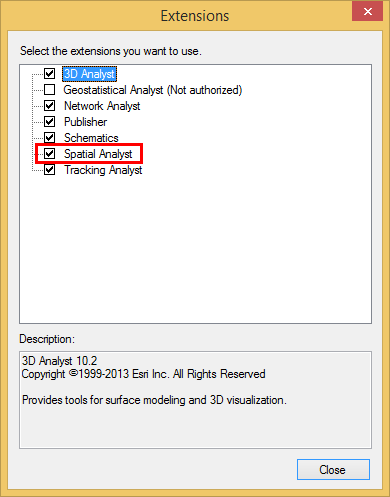
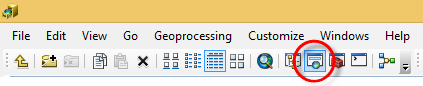
To enable the Spatial Analyst extension, follow these steps:
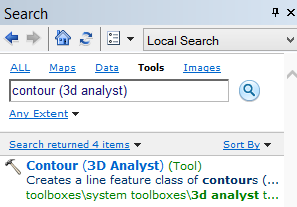
The next step is to generate the contours from the elevation raster file.
To generate the contours from the elevation raster, follow these steps:
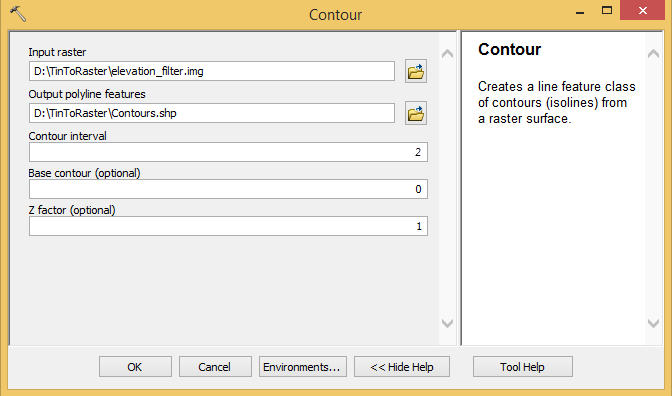
When entering a file name for the Output Polyline Features field, the file extension determines what file format the contour polylines will be saved as. For example, entering “contours.shp” will save the contours as an ESRI shapefile. Shapefiles are more widely supported in other software applications. However, shapefiles have a 2 gigabyte file size limit.
The Base Contour field is used to optionally define a starting elevation for the contour lines. This allows you to limit the number of contours generated. For example, entering 200 will cause contour lines to be created at 200 ft, 202 ft, 204 ft, etc.
The Z Factor field is used to convert between different elevation units. For example, if the elevation raster units are in meters and you need the contours units in feet, you would enter a Z Factor of 3.28084 (i.e., 3.28084 feet = 1 meter). Conversely, if the elevation raster units are in meters and you need the contours units in meters, you would enter a Z Factor of 0.3048 (i.e., 0.3048 meter = 1 foot).
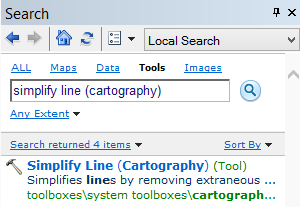
The contours that were created in the previous process can contain spikes and other errors—especially in flat areas. To remove these errors, the simplify filter can be run on the contour lines.
To simplify the contours, follow these steps:
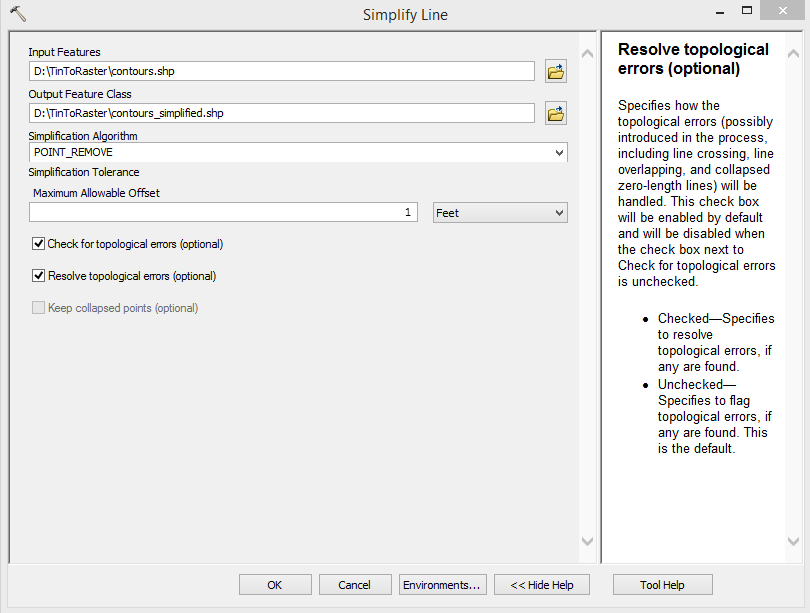
Depending on the size and complexity of the contour line data, this tool can take a few minutes or up to an hour to run.
There is no rule on what value to enter for the Maximum Allowable Offset field. Smaller values remove less vertices, but also retain more detail. Smaller values are generally used in steeper terrain areas. Larger values remove more vertices, but also simplify the lines more. Larger values are generally used in flatter terrain areas. Trial and error is used to determine an appropriate value to use. The Simplify Line tool can be run multiple times on the same dataset; each iteration overwrites the previous results. It is not necessary to run the Simplify Line tool on a fresh copy of the contour shapefile each time.
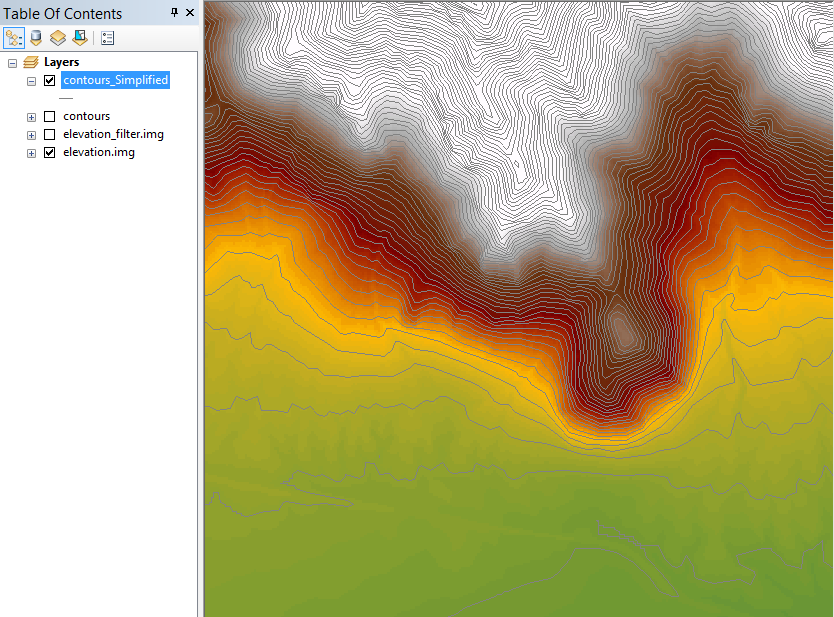
Once the Simplify Lines tool has completed, open the simplified contour shapefile in ArcMap to check for any errors. The below image shows the computed contours overlaid on the elevation raster.


CivilGEO G2 Reviews
4.8/5.0 Rating, Over 230 Reviews

GeoHECRAS is recognized as the top Civil Engineering Design Software with an average of 4.8 out of 5.0 rating from over 230 real user reviews on G2.


We use cookies to give you the best online experience. By agreeing you accept the use of cookies in accordance with our cookie policy.
When you visit any web site, it may store or retrieve information on your browser, mostly in the form of cookies. Control your personal Cookie Services here.


