
Welcome to CivilGEO Knowledge Base
Welcome to CivilGEO Knowledge Base
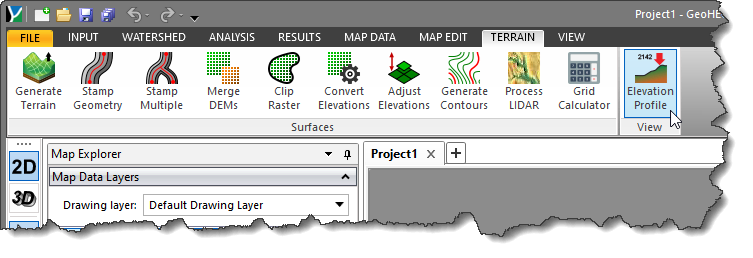
The Elevation Profile command is used to display the elevation profile plot, profile line details, and profile line geometry for a selected polyline and terrain surface.
Follow the steps given below to use the Elevation Profile command:
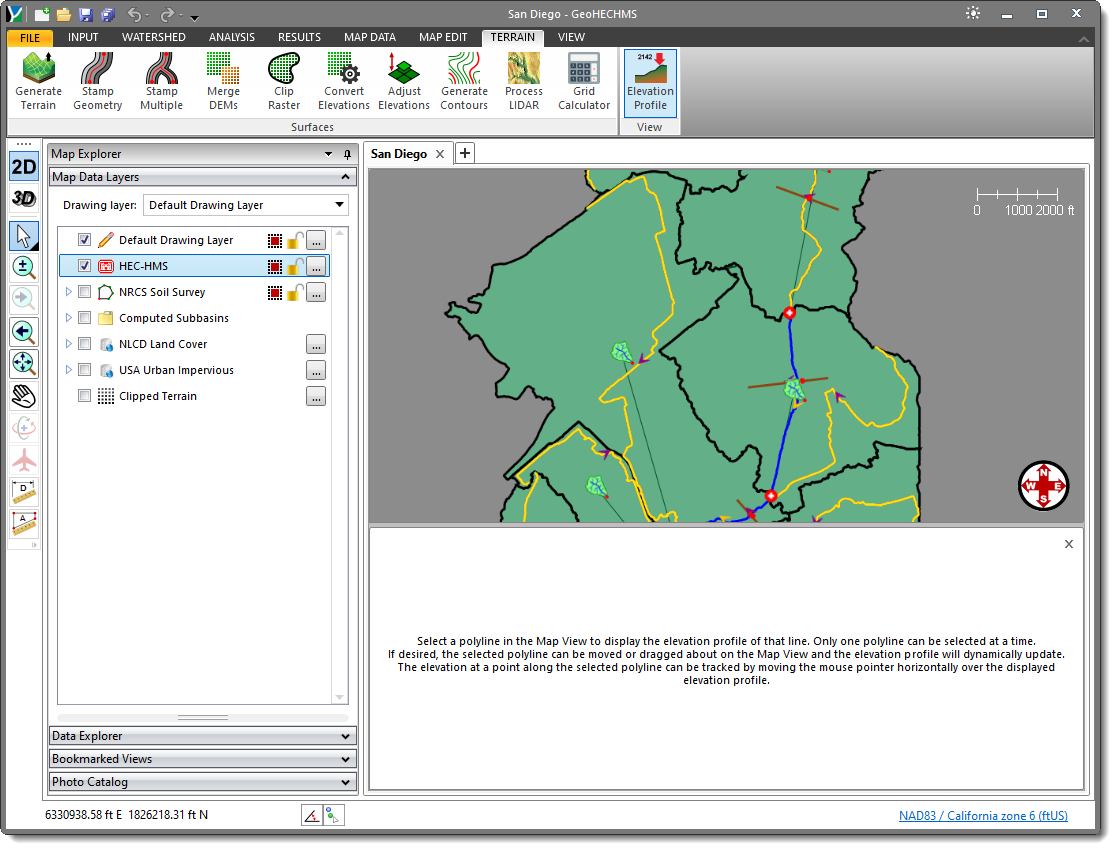
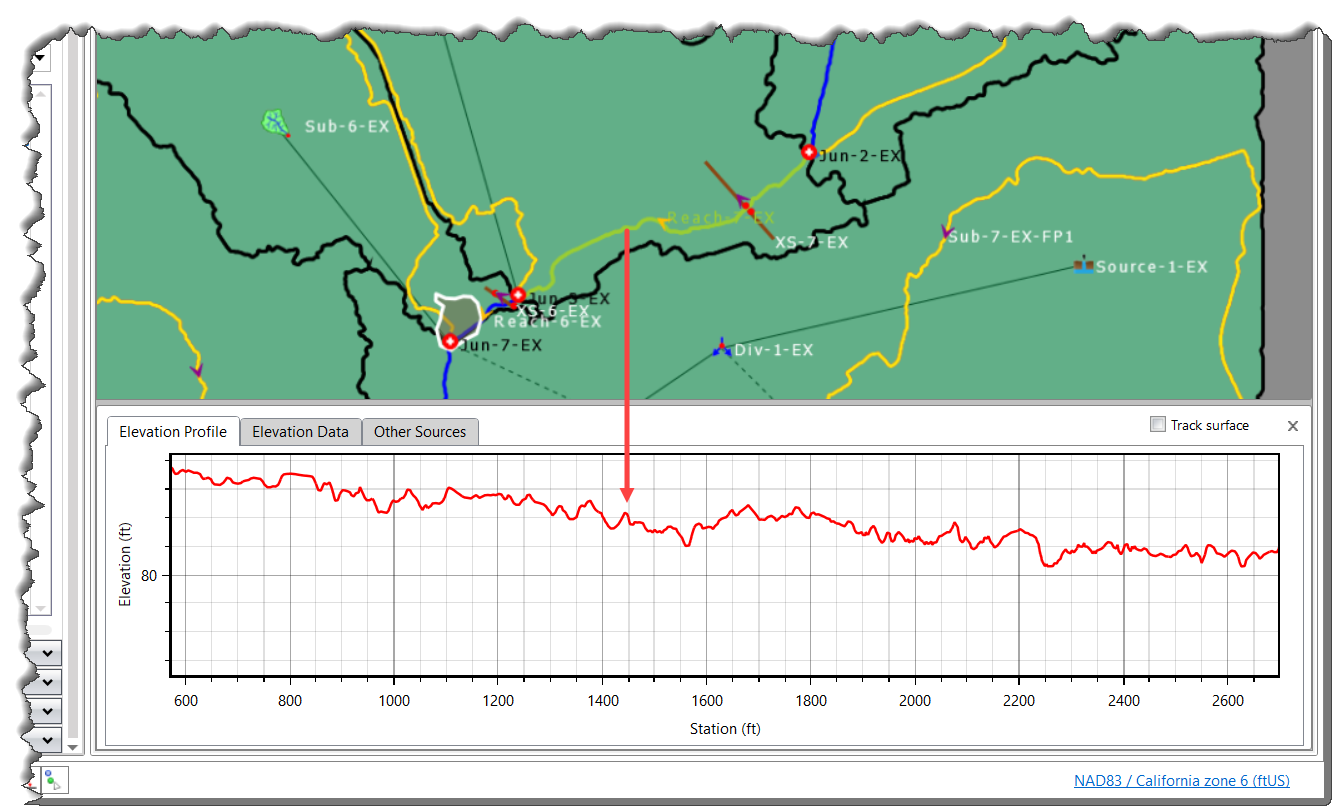
After selecting the polyline on the Map View, the Elevation Profile plot will be displayed in the Elevation Profile panel. As the user drags the mouse over the Elevation Profile plot, a vertical line with a tracker will be displayed that contains the corresponding station and elevation height. In addition, a vertical arrowhead is also shown on the Map View that updates dynamically over the mouse drag. The arrowhead displays the same station and elevation readings as displayed in the Elevation Profile plot.
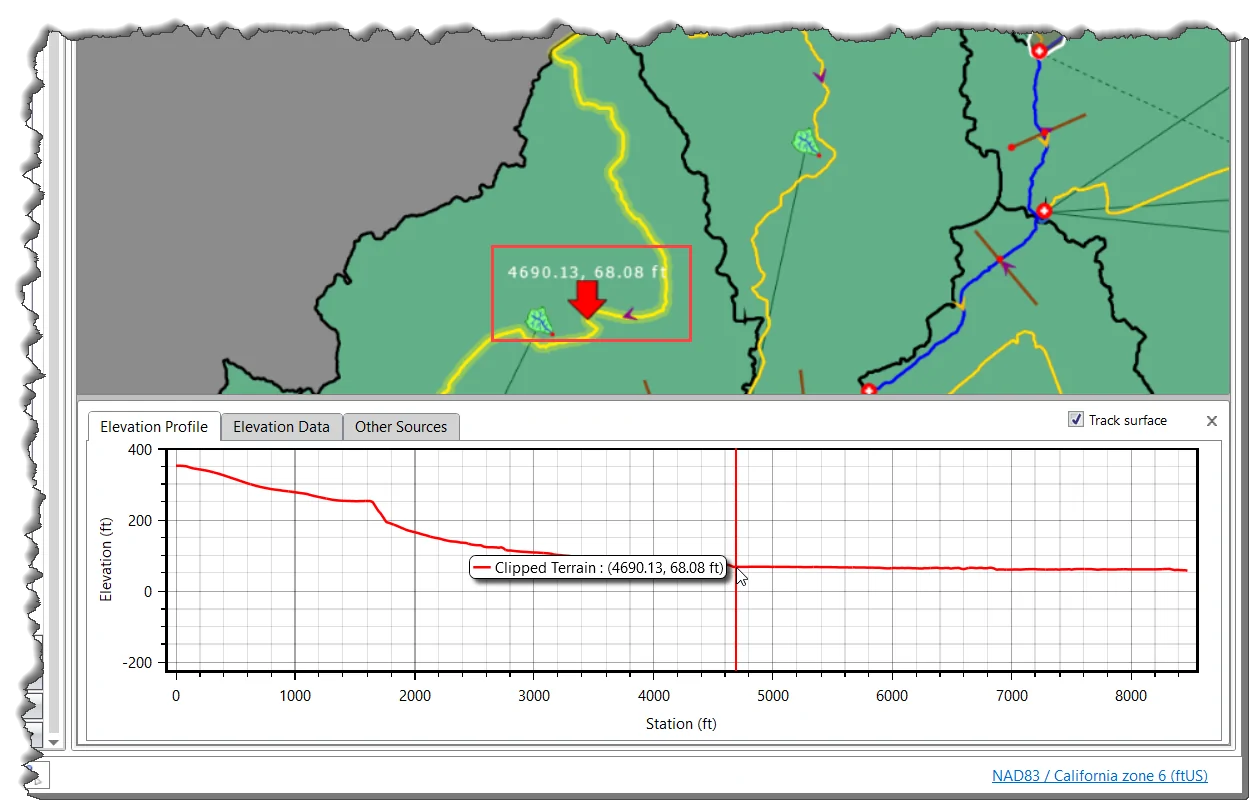
The active elevation profile tracking from both the Map View and Elevation Profile panel can be turned off by unchecking the Track surface checkbox option present at the top right corner of the panel.
Note that if the user grabs the polyline from the Map View and moves it around the terrain surface, the Elevation Profile panel is dynamically updated to show the new elevation profile.
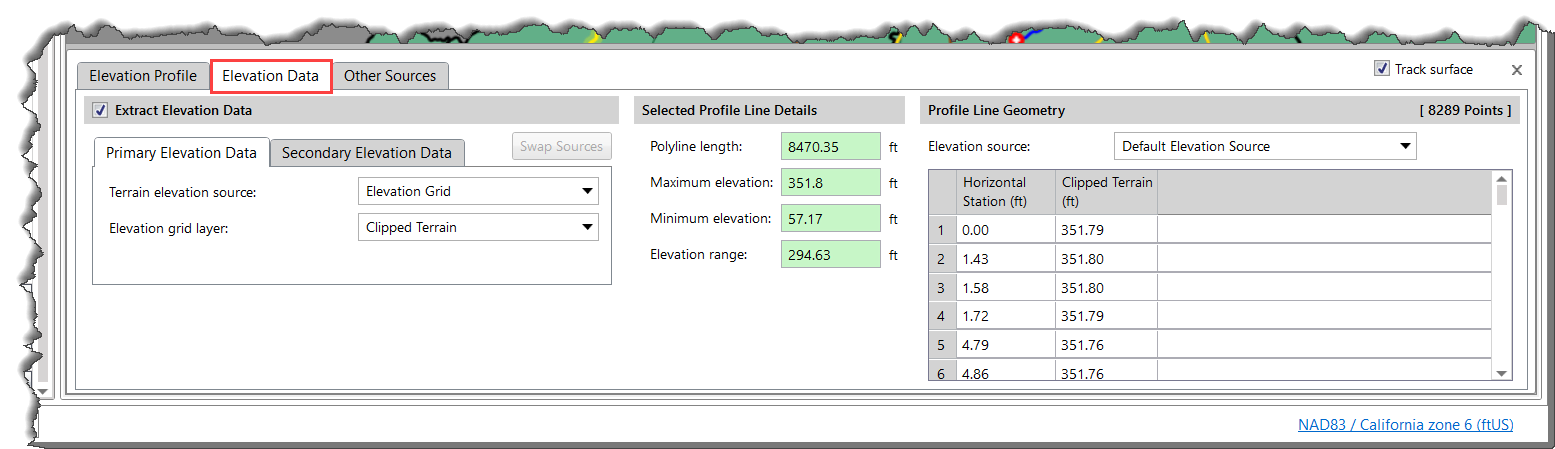
The Elevation Data panel allows the user to select the elevation data source. By default, this panel will reference the selected terrain surface in the Scenario Manager (if one is defined). If no terrain surface is selected in the Scenario Manager, then this entry will be undefined (i.e., blank).
Refer to this article in our knowledge base to manage the selected terrain surface in the Scenario Manager dialog box.
In the Elevation Data panel, the user can select the elevation data source from the Extract Elevation Data section. This section is enabled by default and allows the user to select primary and secondary elevation sources.
Note that if the Extract Elevation Data checkbox is disabled, the options contained within this section will be disabled (i.e., grayed out).
The Primary Elevation Data and Secondary Elevation Data panels are used to define the primary and secondary (if available in the project) elevation data sources for extracting the elevation profile. Depending on the selected elevation data source type, the content of these panels changes to include the additional elevation data information.
When a secondary elevation data source is available, the software forms a concave hull around the primary elevation data source to identify its bounds. For locations where elevation data from the primary data source is unavailable, the software will use elevation data from the secondary data source.
Note that the user cannot utilize the same data source to define both the primary and secondary elevation data.
The user can click the [Swap Sources] button to swap the selected elevation source from primary elevation data to secondary elevation data and vice versa.
If an elevation data source has been defined for the selected polyline, then the software will display the following polyline properties:
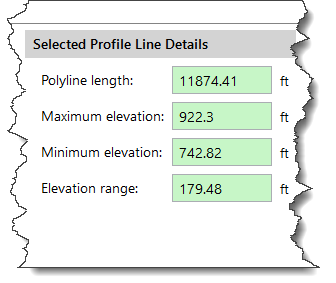
Note that if the selected polyline does not lay entirely over the defined elevation data source, then only the length property will be displayed and other properties will remain blank and shown as “NA” (i.e., Not Available).
The Profile Line Geometry section contains a data grid that displays the profile line station-elevation data for the selected elevation source. By default, the Elevation source dropdown selects the default elevation source selected in the Scenario Manager dialog box. If the user selects a different elevation source from the dropdown menu (if available), then its corresponding profile line geometry will be displayed.
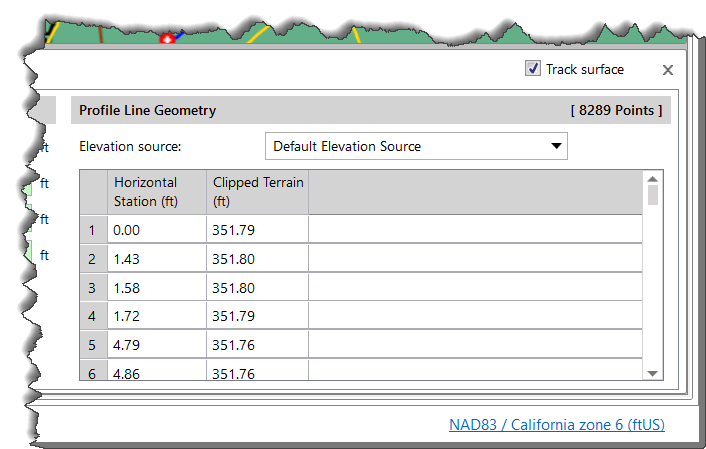
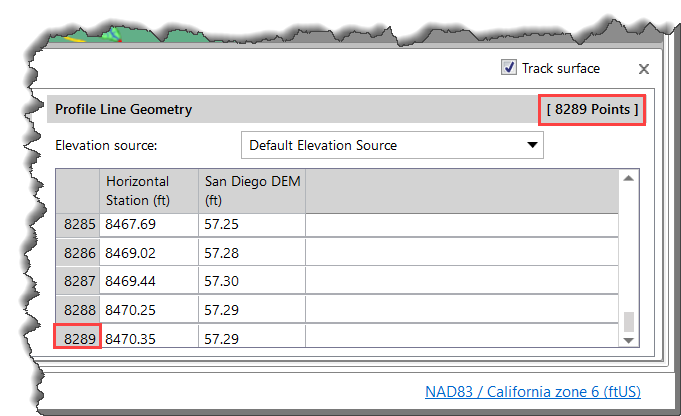
The profile line geometry is covered along the length of the selected polyline. The top right corner of the above panel displays the total points into which a selected polyline would have been divided. In addition, the Horizontal Station present at the last point in the Profile Line Geometry grid denotes the length of the selected polyline.
The length of the selected polyline can also be seen in the Data Explorer panel of the software. Refer to this article in our knowledge base for more information about viewing and editing the GIS attribute data using Data Explorer.
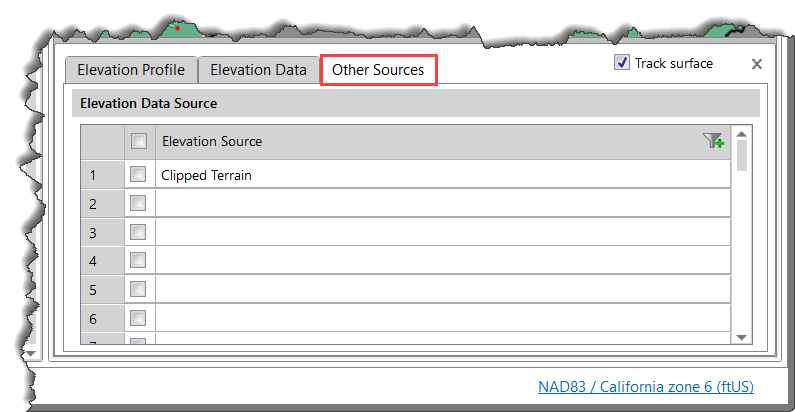
The Other Sources section lists all the available elevation source(s) present in the model. In addition, if the user selects multiple elevation sources from the list, the software will then display the corresponding plots in the Elevation Profile panel.


CivilGEO G2 Reviews
4.8/5.0 Rating, Over 230 Reviews

GeoHECRAS is recognized as the top Civil Engineering Design Software with an average of 4.8 out of 5.0 rating from over 230 real user reviews on G2.


We use cookies to give you the best online experience. By agreeing you accept the use of cookies in accordance with our cookie policy.
When you visit any web site, it may store or retrieve information on your browser, mostly in the form of cookies. Control your personal Cookie Services here.


