
Welcome to CivilGEO Knowledge Base
Welcome to CivilGEO Knowledge Base
Cross sections are located at intervals along a stream for in order to characterize the flow carrying capability of the stream and the adjacent floodplain. They should extend across the entire floodplain and should be perpendicular to the anticipated flow lines. Sometimes it is necessary to layout cross sections in a curved or a dog-leg alignment to meet this requirement. They should not intersect each other and should remain perpendicular to the main channel.
The Draw Cross Sections command enables the user to draw a cross section on the Map View as well as extract the cross section geometry from the underlying ground terrain.
Follow the steps below to use the Draw Cross Sections command:
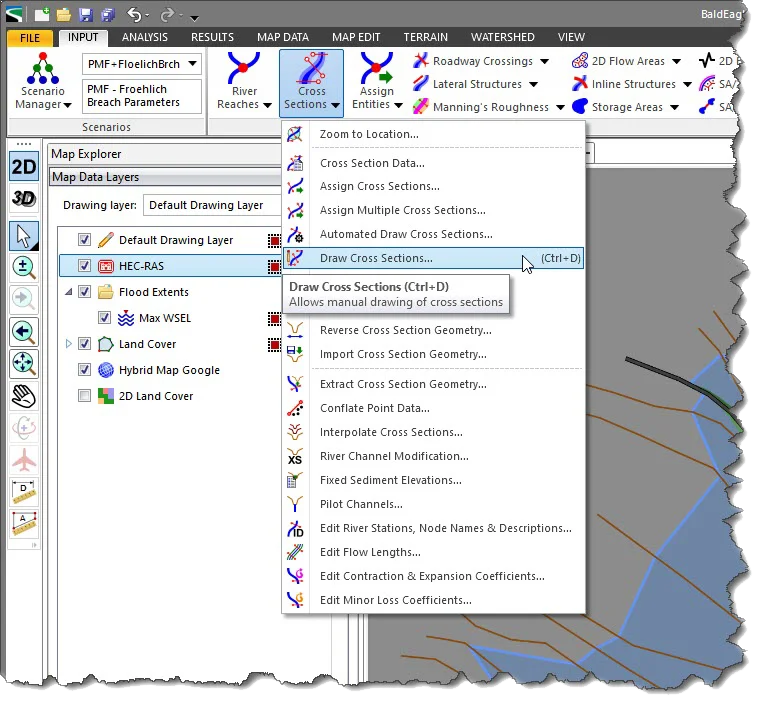
The below sections describe the Draw Cross Sections command and how to interact with the above dialog box.
Note that the software provides a shortcut key (Ctrl+D) that automatically starts the Draw Cross Sections command. Pressing the Ctrl+D key allows the user to draw the cross sections directly on the Map View without having to interact with the ribbon menu or Draw Cross Sections dialog box. To learn how draw cross sections using the shortcut key (Ctrl +D), refer to this article in our knowledge base.
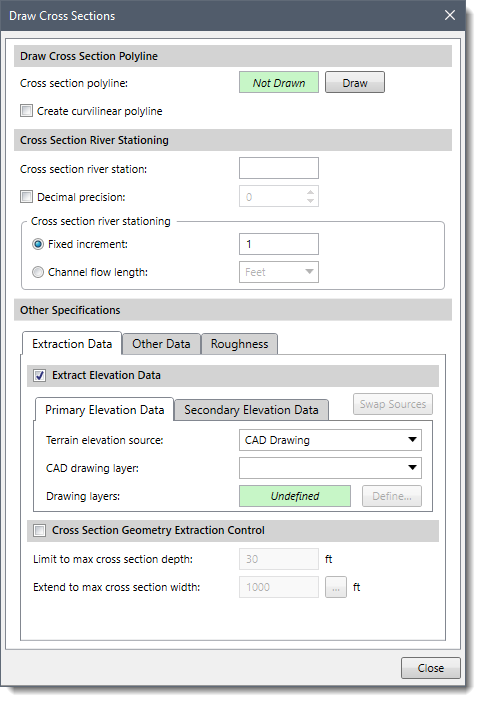
This section is used to interactively draw a polyline on the Map View in order to assign it as a cross section. It is highly recommended that the rest of the dialog box input parameters be defined before drawing the cross sections on the Map View. These parameters define information, such as how the cross section IDs should be numbered, where the cross section geometry will be extracted from, and if cross section bank stations should be assigned.
When ready to construct the cross sections on the Map View, click the [Draw] button. The Draw Cross Sections dialog box will temporarily disappear and a prompt will be displayed on the status bar, informing the user what to do next. Within the Map View, draw a polyline across the river, from one side to the other, to define the cross section. Note that the drawn polyline must cross an existing river reach, or the software will report this as an issue. However, the user can draw in either direction across the river (i.e., left to right or right to left) as the software will determine cross section direction based upon the previously defined river reach direction.
After the cross section polyline has been drawn, either right-click and select Done from the displayed context menu or press the [Enter] key. The software will then construct the cross section and then prompt the user to draw the next cross section. When finished drawing cross sections, right-click and select Cancel from the displayed context menu or press the [Esc] key. The software will return the user to the dialog box.
This section is used to define the river stationing of the constructed cross sections. After drawing a cross section polyline, the software will automatically compute the river station for the cross section based upon other cross sections already assigned to the river reach and the parameters defined in this section.
For the cross sections being constructed, the river stationing value after the decimal point can be defined using the Decimal precision spin control. Cross sections can be numbered using a fixed increment or by the river chainage along the river reach. The river chainage can be in miles or feet when working in US units, or kilometers or meters when working in metric (SI) units.
This tabbed panel is used to define the geometry extraction specifications for the drawn cross sections.
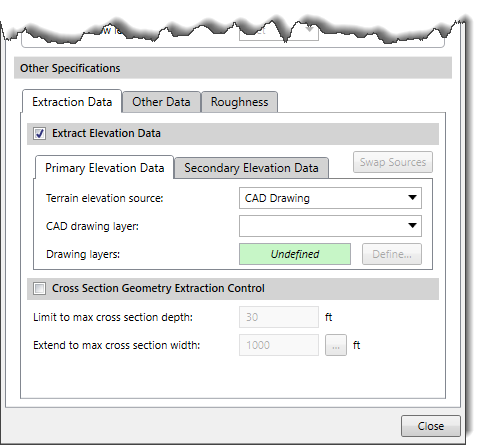
This optional section is used to define the elevation data source to be used for extracting the cross section geometry. Depending upon the elevation data source type that is selected, different options are provided to specify additional elevation data information.
Refer to this article in our knowledge base for information on the types of terrain elevation data that can be used for constructing cross sections.
If the Extract Elevation Data checkbox is unchecked, then the subsequent sections below it will be unavailable (i.e., grayed out). In addition, no geometry will be created when the cross section is created. The cross section will just be a flat horizontal line at elevation 0.
This optional section is used to control the amount of the cross section geometry to extract for the drawn polyline. This assures that an adequately deep enough cross section is created on both sides of the river reach. The software will attempt to retrieve the cross section geometry data to the depth specified within the maximum cross section width specified.
If the drawn polyline does not extend outward far enough to get the cross section depth specified, the software will automatically extend the cross section line further outward. Similarly, if the drawn polyline extends too far outward for the depth specified, the software will automatically trim the drawn cross section line.
This tabbed panel is used to define channel bank locations based upon the options selected for the drawn cross sections.
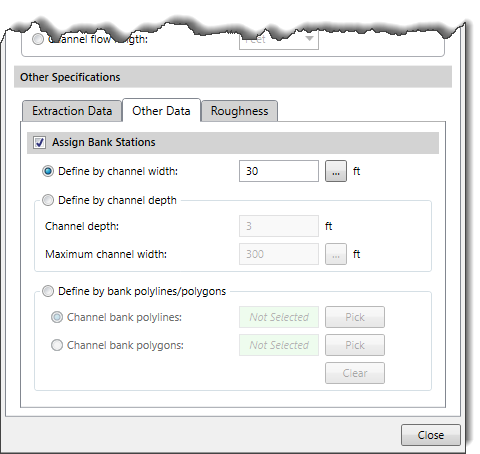
This optional section is used to construct HEC‑RAS channel bank locations based upon the selected option. The following options are available:
This option will assign the bank stations using a defined channel width. The software will first determine where the thalweg location is on the cross section. It will then move outward from the thalweg equally until the requested channel width is reached.
This option will assign the bank stations using an assumed normal flow depth and a maximum channel width search distance. The software will first determine where the thalweg location is on the cross section. It will then move outward from the thalweg until the requested channel depth is reached within the maximum channel width specified.
This option will assign the bank stations using selected polylines or polygons. The software will first determine where the thalweg location is on the cross section. It will then move outward from the thalweg until a previously selected bank polyline or polygon edge is reached.
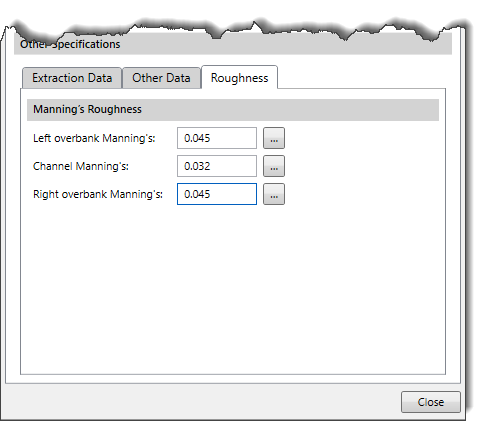
During the construction of the cross section, the software will automatically assign a default Manning’s roughness for the left overbank, channel, and right overbank areas in the Roughness panel. However, the user can change the default values to whatever is desired.
In addition, the software automatically determines the flow lengths to the next downstream cross section. If a new cross section is being inserted between two adjacent cross sections, the software will automatically adjust the flow lengths of the next upstream cross section to account for the insertion of the new cross section.
The software also allows the user to define more than three Manning’s n values for any selected cross section. The user can provide horizontally varying Manning’s n values to define multiple sub roughness areas for the selected cross section.
After the cross section has been drawn, the user can double-click on the cross section in the Map View to display the Cross Section Data dialog box.
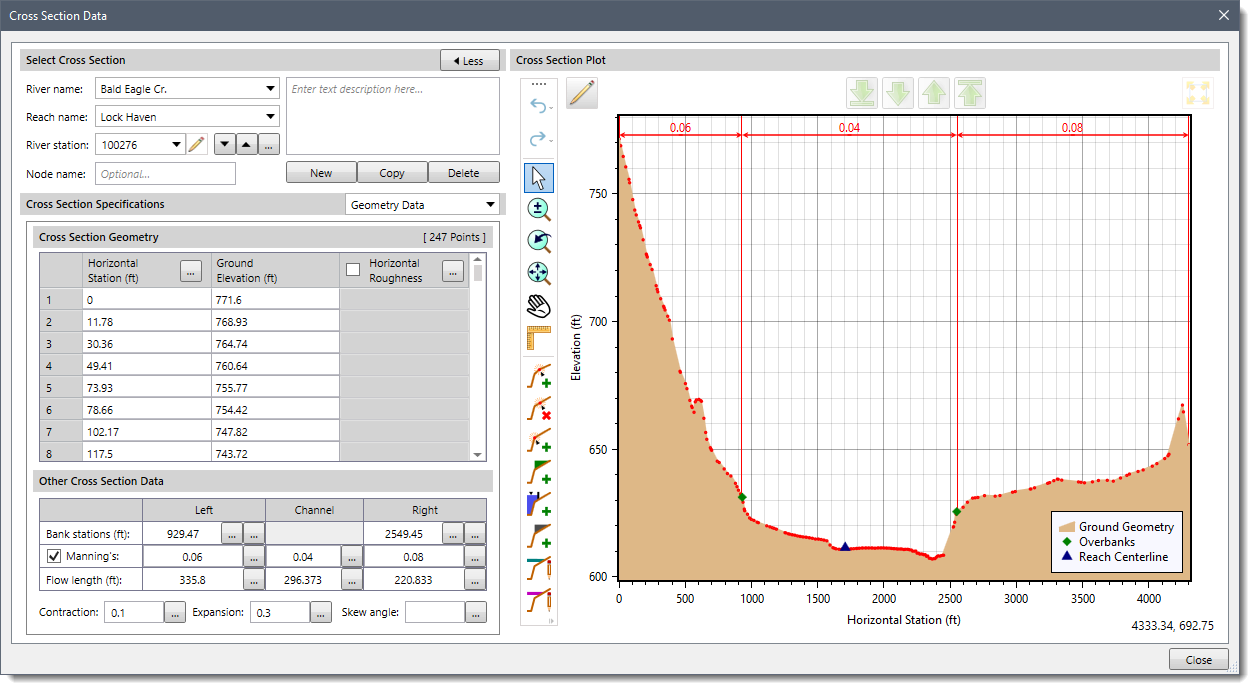
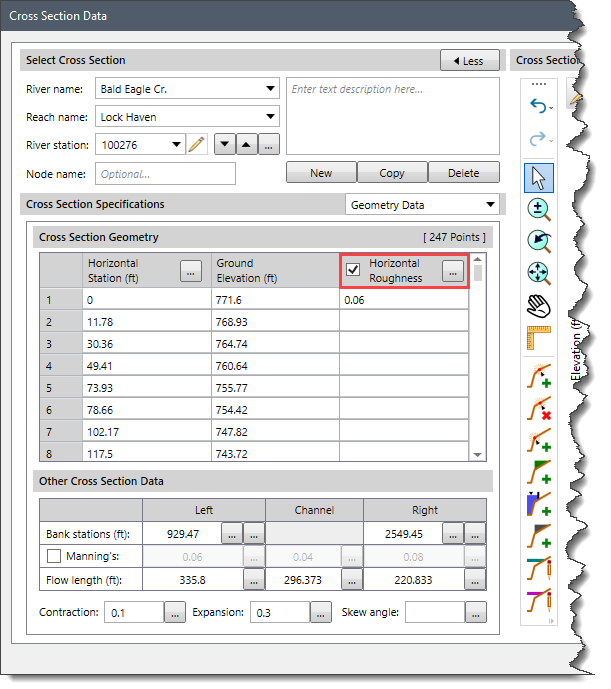
In the Cross Section Geometry section of the above dialog box, the user can select the Horizontal Roughness checkbox to enable the Horizontal Roughness column and enter the varying Manning’s n values.
A Manning’s n value must be placed in the first row of the table. This n value is good for all cross section stations until a new n value shows up in the table. The user is only required to enter a n value at the locations where the n value is changing, not for every station.
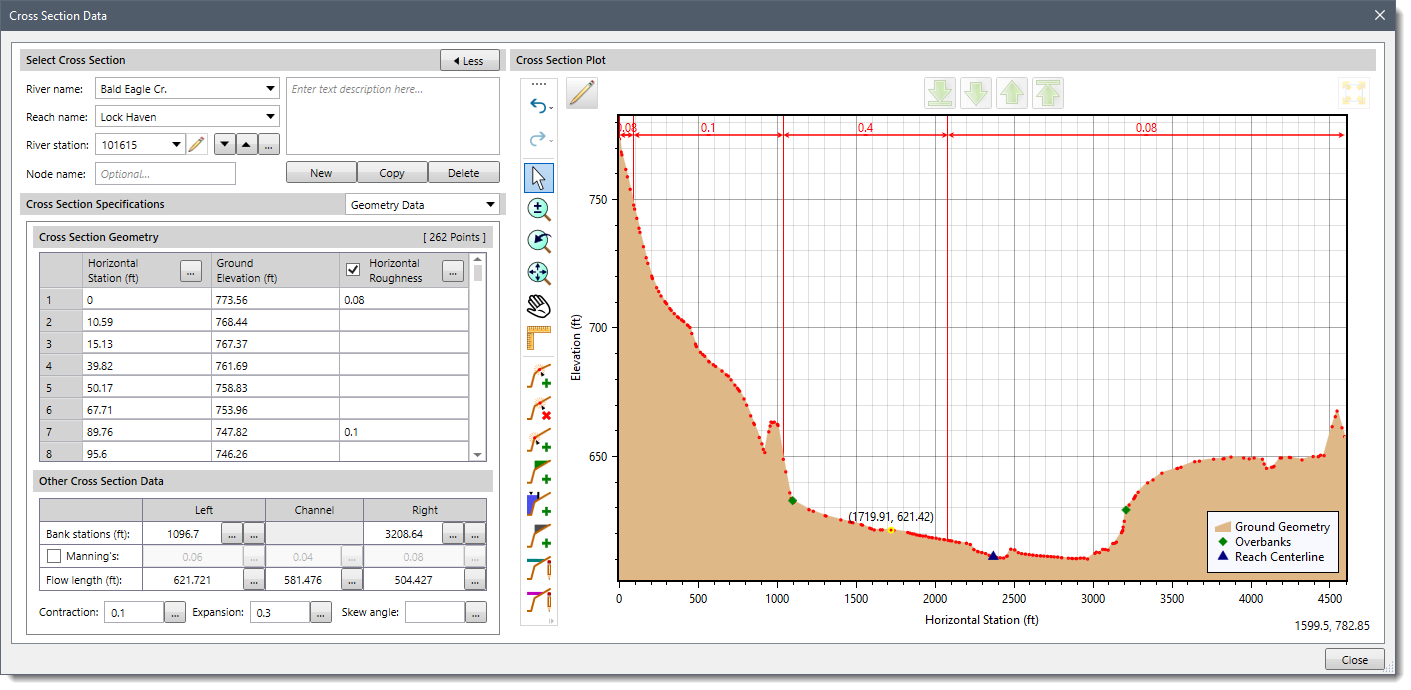
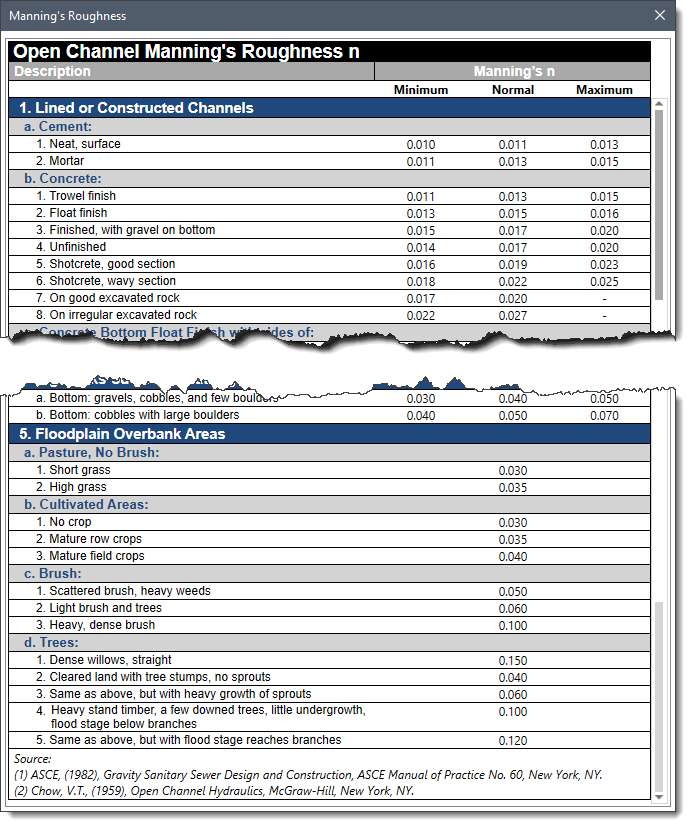
Note that, while defining the Manning’s n values, the user can click the […] button to display the Manning’s Roughness dialog box. This dialog box provides a reference to Manning’s roughness coefficients for some commonly used surface materials.


CivilGEO G2 Reviews
4.8/5.0 Rating, Over 230 Reviews

GeoHECRAS is recognized as the top Civil Engineering Design Software with an average of 4.8 out of 5.0 rating from over 230 real user reviews on G2.


We use cookies to give you the best online experience. By agreeing you accept the use of cookies in accordance with our cookie policy.
When you visit any web site, it may store or retrieve information on your browser, mostly in the form of cookies. Control your personal Cookie Services here.


