
Welcome to CivilGEO Knowledge Base
Welcome to CivilGEO Knowledge Base
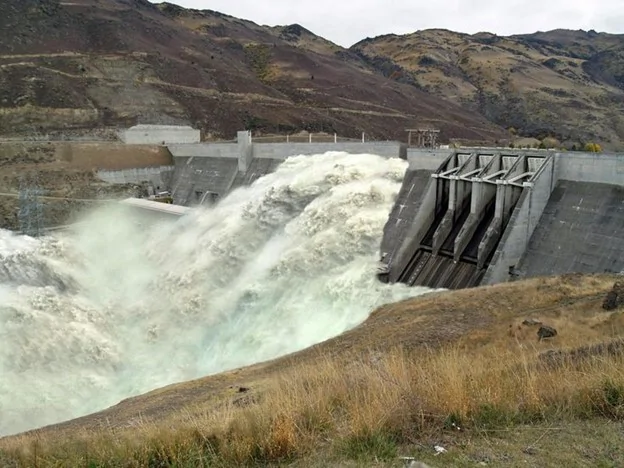
Dams have produced many benefits for our society, but floods caused by failed dams have also led to some of the most devastating disasters in the past two centuries. A dam break may result in flood waves as deep as tens of meters traveling along a valley at high speeds. The impact of such a wave on developed areas can be very devastating. Regardless of the reason, almost all failures begin with a breach formation. A breach is generally defined as the opening formed in the dam body that causes the dam to fail.
The types of dams that are commonly built and found are:
Dam break analysis simulates the movement of a dam break flood wave along a valley or any area downstream that would flood due to dam failure. Historically, all types of dams have experienced failures due to one or more types of events. However, most dam failures have occurred in earthen dams caused by some flood levels.
Many mechanisms can be the driving force of a dam failure. Given the different mechanisms that cause dam failures, there can be several possible ways a dam may fail for a given driving force/mechanism. The below table shows a list of dam types versus possible modes of failure.
Types of Dams |
|||||
|---|---|---|---|---|---|
| Failure Mode | Earthen/Embankment | Concrete Gravity | Concrete Arch | Concrete Buttress | Concrete Multi-Arch |
| Overtopping | ✔ | ✔ | ✔ | ✔ | ✔ |
| Piping/Seepage | ✔ | ✔ | ✔ | ✔ | ✔ |
| Foundation Defects | ✔ | ✔ | ✔ | ✔ | ✔ |
| Sliding | ✔ | ✔ | ✔ | ||
| Overturning | ✔ | ✔ | |||
| Cracking | ✔ | ✔ | ✔ | ✔ | ✔ |
| Equipment failure | ✔ | ✔ | ✔ | ✔ | ✔ |
GeoHECRAS can be used to model both overtopping and piping failure breaches for earthen dams. Additionally, the more instantaneous type of failures of concrete dams can also be modeled. The resulting flood wave is routed downstream using the unsteady flow equations. Inundation mapping of the resulting flood can be done in the Map View of the software when GIS data (terrain data) are available.
For two-dimensional (2D) HEC-RAS models, a dam can be represented as a SA/2D Connection. This allows the user to enter the breach data they determined when estimating breach parameters. Refer to this article in our knowledge base to learn how to draw SA/2D Connections.
Similarly, for 1D HEC-RAS models, a dam can be represented as an Inline Structure. Refer to this article in our knowledge base to learn how to draw inline structures.
Each of the above dam representations allow the user to put in an embankment, define overflow spillways and weirs, gated openings (radial and sluice gates), culverts, rating curves, and time series of flow releases. Gated openings can be controlled with a time series of gate openings or using the elevation gate operation feature.
The lake area upstream of the dam can either be modeled with cross sections, a storage area, or a 2D flow area.
If cross sections are used, the software will perform full unsteady flow routing through the reservoir pool and downstream of the dam. If a storage area is used, the software uses level pool routing through the lake, then unsteady flow routing downstream of the dam. If a 2D flow area is used, then full 2D modeling can be used within the reservoir pool and downstream of the dam.
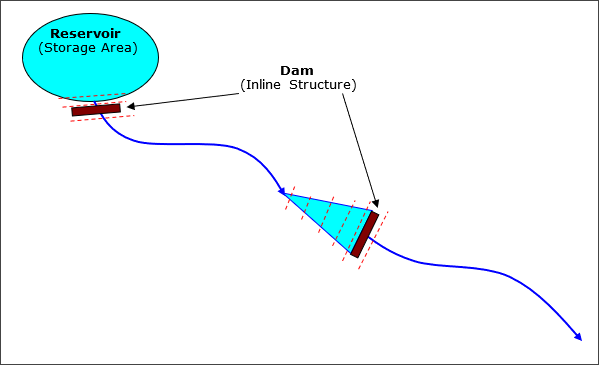
When using a storage area to represent a reservoir pool, the software requires two cross sections inside the reservoir pool, then an inline structure to represent the dam, and finally downstream cross sections.
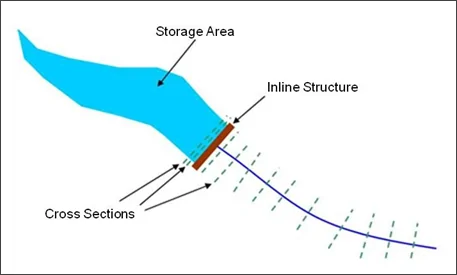
The routing reach is hydraulically connected to the reservoir (storage area) with the first (most upstream) cross section. This cross section’s water surface is forced to the elevation of the water surface in the storage area during the unsteady flow routing. The second cross section in the pool area is required as a bounding cross section for the inline structure (the dam).
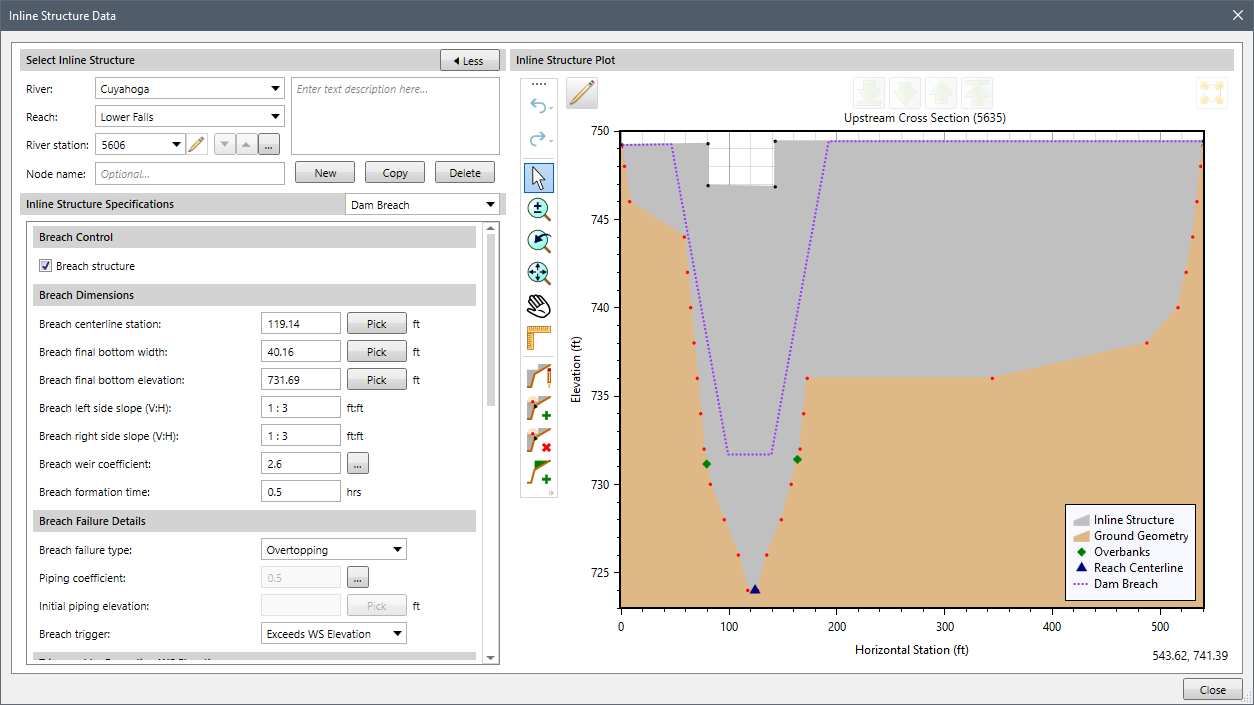
An example of modeling a dam using an inline structure is shown below. The embankment is shown as the gray-filled-in area above the ground. The overflow spillway is the rectangular notch on the upper left-hand side of the embankment.
To quantify the incremental effects of a dam break, the dam breach parameters are entered to simulate the dam break and analyze the sensitivities. Breach parameters describe the nature of a dam breach. For example, these parameters include the average breach width, the breach side slope, the breach height, breach progression (e.g., linear or non-linear i.e., sinusoidal), and the breach formation time.
Breach data is entered in the Dam Breach data panel of the Inline Structure Data dialog box.

Refer to this article in our knowledge base to learn how to enter dam breach data for performing dam break analysis.
In GeoHECRAS, the shape and progression of the breach depend on the data entered by the user. The breach formation shape depends on the breach’s final bottom width, the height of the structure, and the breach formation time.
The following sections provide the generalized description of the breach progression for overtopping and piping failure.
For overtopping dam failure mode, consider a breach with the following parameters:
The breach has to grow 400 feet wide in 4 hours. So, the growth rate is 100 feet/hour. This growth rate is used for both the horizontal and vertical growth rates.
In the case of linear breach progression, the breach will start as a tiny trapezoid (or rectangle if side slopes are zero) at the top of the weir based on the center station. The trapezoid will grow such that after one hour, the breach will have just reached the final bottom elevation (100 feet deep), and the breach will be 100 feet wide (at the bottom). Over the next three hours, the breach will grow horizontally from 100 feet wide to the final width of 400 feet at the bottom. The side slopes of the trapezoid always remain the same. In the less common situation where the breach is deeper than it is wide, the growth rate is based on the vertical depth divided by the formation time. The maximum width would be reached before the maximum depth.
The user has the option to specify a vertical/horizontal growth rate. By default, the software uses a value of 1.0. However, if the user feels the vertical growth rate should be slower or faster than the horizontal growth rate, they can enter a different vertical to horizontal growth rate ratio. For example, a value of 0.5 would produce a vertical growth rate that is half the speed of the horizontal growth rate.
If the breach progression is non-linear, the horizontal growth will be adjusted as needed. Progression in the vertical direction will match the horizontal growth.
For piping dam failure mode, consider the same scenario mentioned for overtopping failure with the same growth and an initial elevation of 120 feet.
In the case of linear breach progression, the breach will start as a tiny square (or rectangle) based on the center station and initial piping elevation. The sides of the square will grow at the rate of 100 feet/hour. The vertical growth is split between up and down. After 6 minutes, the square will be 10 feet on a side. The top of the square would be at an elevation of 125 feet and the bottom at an elevation of 115 feet. Once the bottom of the square reaches the final bottom elevation, all of the growth is applied upward. When the elevation of the top of the square is higher than the water surface elevation in the breach, it is assumed the breach will cave in. The breach will now be an open rectangle with the current bottom elevation and current bottom width (the rectangle extending vertically to the top of the weir). If the breach has not yet reached the final bottom elevation, it will grow downward at the full vertical growth rate. The bottom of the breach will continue to grow horizontally at the same rate (or adjusted rate for non-linear).
If the side slopes are not zero (vertical), then the side slopes of the rectangle/trapezoid will progress from vertical to the maximum side slope, linearly over the remaining time (or adjusted for non-linear progression based on user selection). So, if the side slope is 3 and the piping breach becomes an open breach after one hour, then the side slope would be 1 at the end of the second hour, 2 at the end of the third hour, and 3 at the end of the fourth hour. If the water surface remains high enough, then the piping breach will not turn into an open breach until the top of the piping breach reaches the top of the weir. It will then grow to the final trapezoidal shape as in the case of overtopping failure mode.
If the breach progression is non-linear, the piping breach would be a rectangle that grows vertically at 25 feet/hour.
Estimating a dam breach location, dimensions, and development time are crucial in assessing potential risk due to dam break. Although breach parameters are specific to each dam, dam safety professionals use several standard methods to estimate breach parameters. Breach parameters will directly affect the estimate of the peak flow coming out of the dam and any possible warning time available to downstream locations. Unfortunately, the breach location, size, and formation time are often the most uncertain pieces of information in a dam failure analysis.
Dam safety professionals estimate breach parameters for earthen dams and concrete dams. For embankment dams, there are several equations that you can use to estimate the various parameters. However, the most common ones are listed below:
In contrast, dam safety professionals estimate breach parameters for concrete dams based on the dam’s construction rather than equations. There are several types of concrete dams. Some of these include gravity dams, arch dams, multi-arch dams, and buttress dams. A gravity dam can also be combined with an arch dam to create what is known as a gravity-arch dam.
The below table shows a range of appropriate breach parameters for various types of concrete dams.
| Concrete Gravity Dams | Concrete Arch Dams | |
|---|---|---|
| Average Breach Width | A multiple of monolith widths | Entire dam width |
| Breach Side Slope | Vertical | Vertical to valley wall slope |
| Breach Formation Time | 0.1 to 0.5 hours | Nearly Instantaneous ≤ 0.1 hour |
Additionally, site-specific information and structural and geotechnical analyses should be used to refine and support the estimates of the breach parameters for each failure scenario/hydrologic event.
In any dam safety study, it is important to consider a range of parameter estimates for the breach size and development time for each failure scenario/event. After that, sensitivity analyses of the breach parameters should be performed to identify their effect on the outflow hydrograph, downstream stages and flows, and warning time to any population at risk.
Several plots and tables are available for evaluating the results of a dam break analysis, including cross section, profile, and 3-dimensional plots. These plots can be animated on a time step by time step basis to visualize the propagation of the flood wave.
An example of a cross section plot of a dam breach is shown below. Refer to this article in our knowledge base to learn how to view cross section plot.
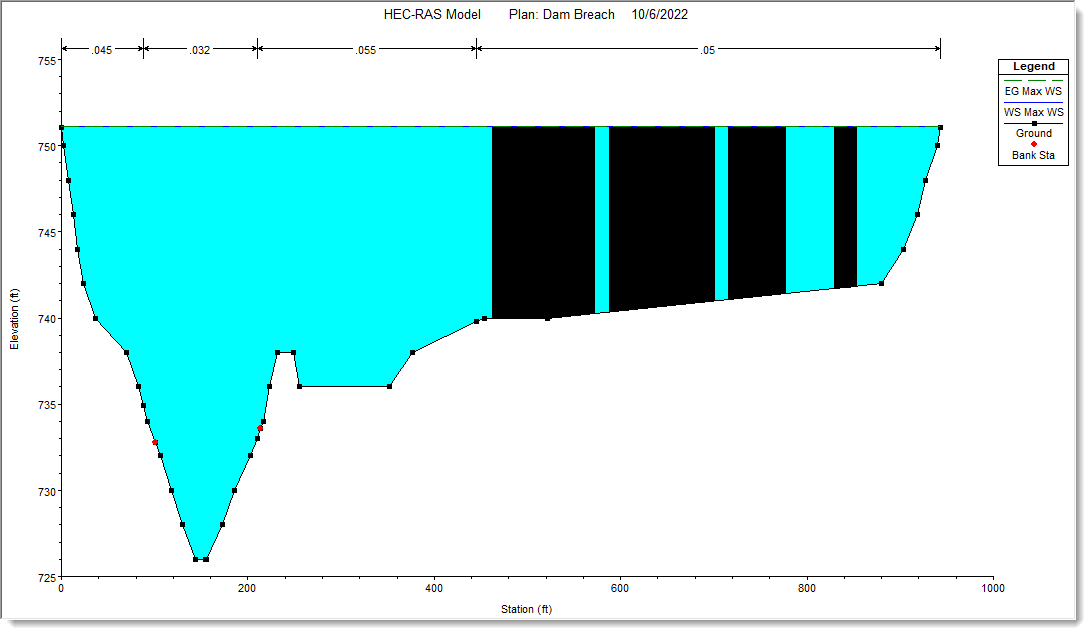
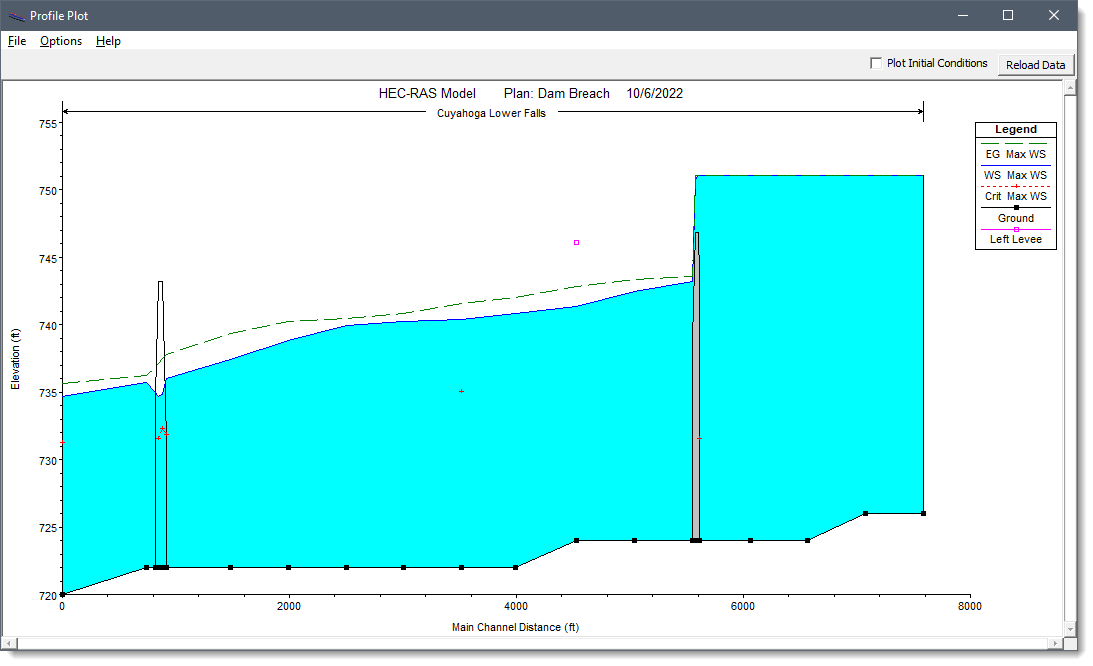
The corresponding water surface profile for the same instance is shown below. Refer to this article in our knowledge base to learn how to view water surface profile plots.
The user can also view hydrographs at any location at which hydrograph output is required. These hydrographs represent the flow leaving the dam and subsequent locations downstream as the flood wave moved through the river system. The below image shows a series of hydrographs from the breach shown in the previous images.
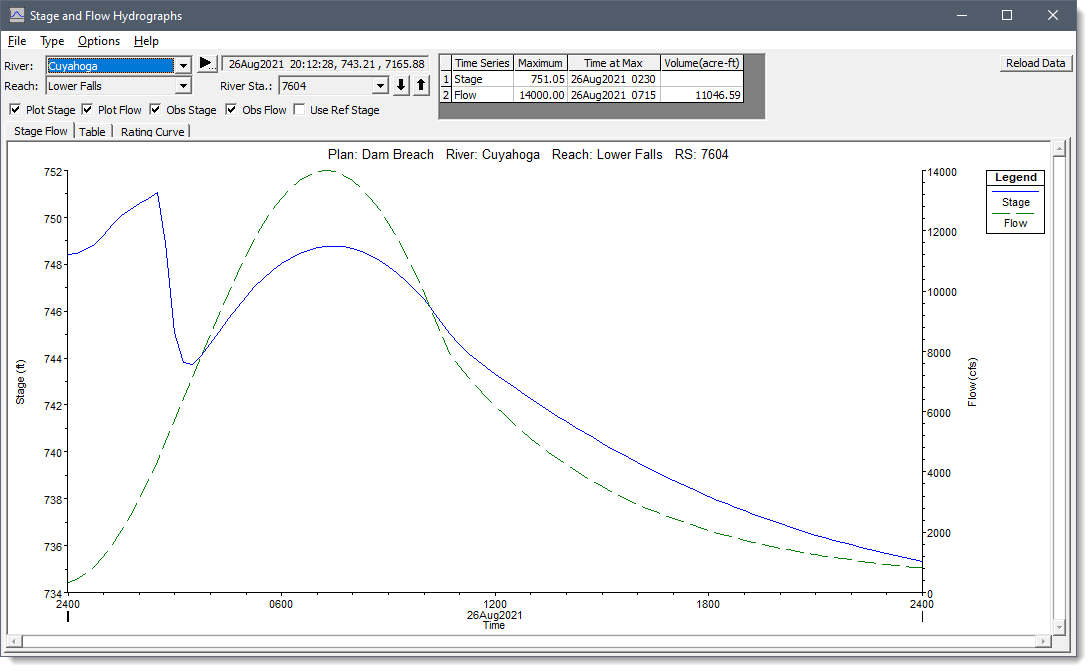
Refer to this article in our knowledge to learn how to view the stage and flow hydrographs.


CivilGEO G2 Reviews
4.8/5.0 Rating, Over 230 Reviews

GeoHECRAS is recognized as the top Civil Engineering Design Software with an average of 4.8 out of 5.0 rating from over 230 real user reviews on G2.


We use cookies to give you the best online experience. By agreeing you accept the use of cookies in accordance with our cookie policy.
When you visit any web site, it may store or retrieve information on your browser, mostly in the form of cookies. Control your personal Cookie Services here.


