
Welcome to CivilGEO Knowledge Base
Welcome to CivilGEO Knowledge Base
Flood events on rivers can cause erosion of the soil around a bridge foundation. This process is frequently referred to as bridge scour. Over time, scour can lead to bridge failure. Bridge scour is an essential factor to address because it is the most common cause of bridge failure.
The computation of scour at bridges within GeoHECRAS is based upon the methods outlined in Hydraulic Engineering Circular No. 18 (HEC 18) report. Before performing a scour analysis with the GeoHECRAS software, the engineer should thoroughly review the procedures outlined in the HEC 18 report. This article presents the data input required for computing contraction scour and local scour at piers and abutments.
To perform a bridge scour analysis, the user must first develop a hydraulic model of the river reach containing the bridge to be analyzed. This model should include several cross sections downstream from the bridge, such that any user defined downstream boundary condition does not affect the hydraulic results inside and just upstream of the bridge. The model should also include several cross sections upstream of the bridge to evaluate the long-term effects of the bridge on the water surface profile upstream. Refer to this article in our knowledge base to learn how to model a bridge in GeoHECRAS.
After performing the steady flow analysis, the bridge scour can then be evaluated. The total scour at a highway crossing comprises three components: long-term aggradation and degradation, contraction scour, and local scour at piers and abutments. The Scour Calculator in GeoHECRAS allows the user to compute contraction scour and local scour at piers and abutments. However, the software does not allow the user to evaluate long-term aggradation and degradation. Long-term aggradation and degradation should be evaluated before performing the bridge scour analysis. Procedures for performing these types of analyses are outlined in the HEC No. 18 report.
The bridge scour computations are performed by opening the Analysis ribbon menu and selecting the Scour Calculator command. The Hydraulic Design – Bridge Scour window will be displayed as shown below.
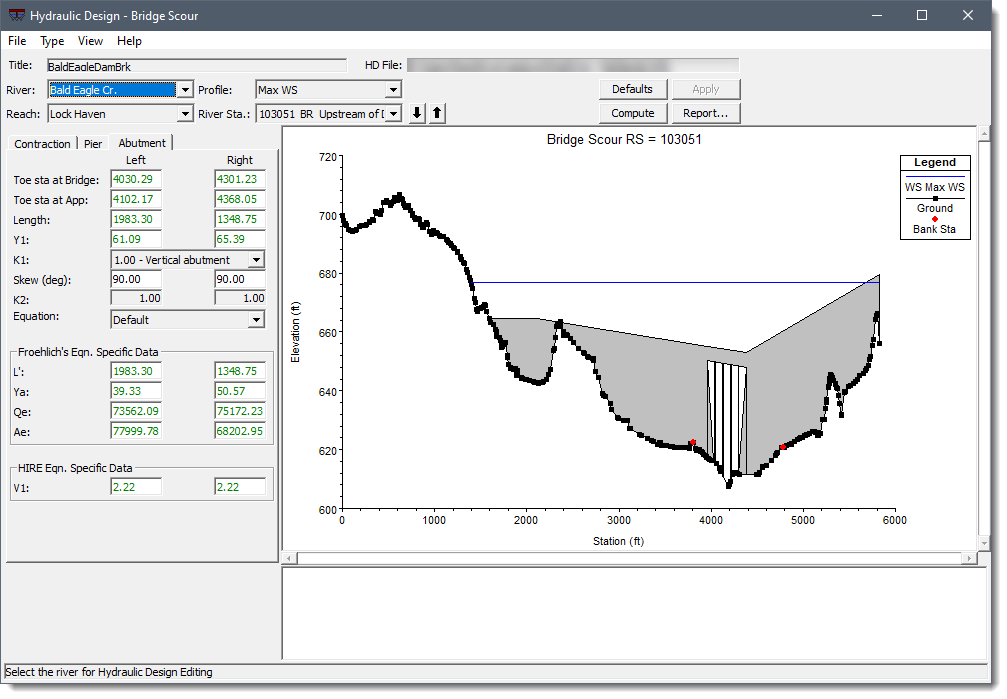
Once this option is selected, the software will automatically go to the output file and get the computed output for the approach section, the section just upstream of the bridge, and the sections inside the bridge. As shown in the above image, the Hydraulic Design – Bridge Scour window contains the input data, a graphic, and a window for summary results. Input data tabs are available for contraction scour, pier scour, and abutment scour. The user is required to enter only a minimal amount of input, and the computations can be performed. If the user does not agree with any of the data that the software has selected from the output file, the user can overwrite it by entering the user’s own values. This provides maximum flexibility in using the software. The forward sections of this article describe how to interact with the above window.
Contraction scour occurs when a bridge restricts flow and limits the flow area of a stream. Contraction scour can be divided into two categories: live-bed and clean-water contraction scour. Live-bed contraction scour occurs when flow transfers bed material from the upstream area of the river into the contracted bridge section. On the other hand, clear-water contraction scour occurs when sediment transport in the uncontracted approach section is negligible. In GeoHECRAS, the computation of contraction scour is performed separately for the left overbank, main channel and right overbank.
The below image shows the contraction scour data panel. Here, all of the variables except K1 and D50 are obtained automatically from the HEC-RAS output file. The user can change any variable to whatever value the user thinks is appropriate.
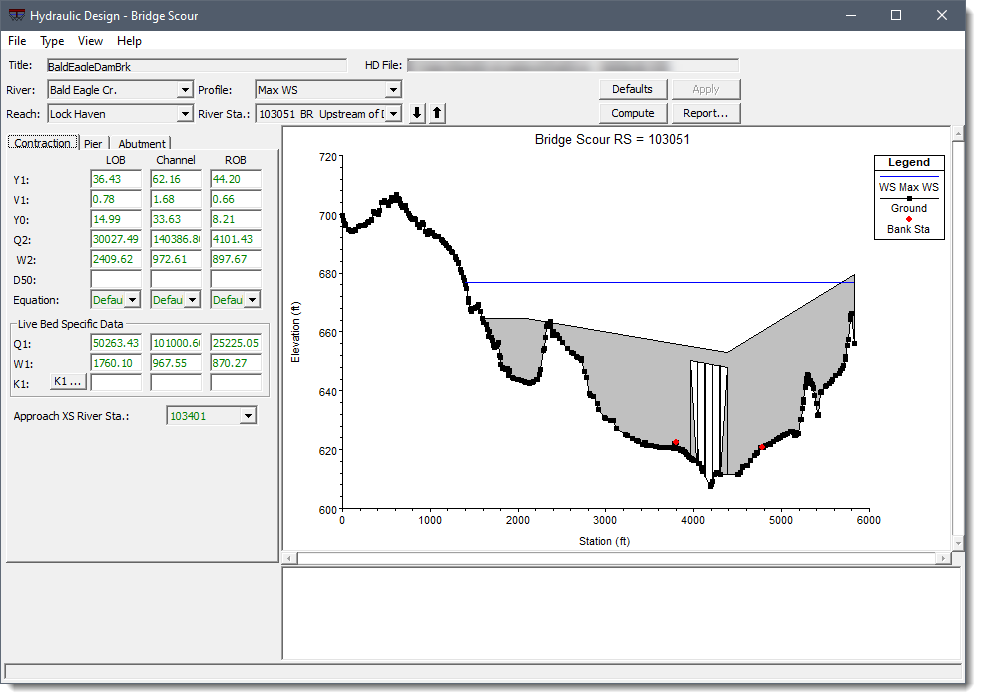
To compute contraction scour, the user is only required to enter the D50 (mean size fraction of the bed material) and a water temperature to compute the K1 factor. To have the software compute a value, click the [K1] button. The Compute K1 for Contraction Scour dialog box will be displayed.
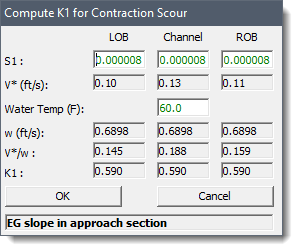
Once a water temperature is entered and the user clicks the [OK] button, the K1 factor will be displayed in the main contraction scour window.
Note that the D50 size fractions are needed to compute K1. These D50 values must be entered at the LOB, Channel and ROB locations before computing the K1.
Pier scour occurs due to the formation of horseshoe vortices and accelerated flow around the pier. The scour hole is created as these vortices erode material from the base of the pier. GeoHECRAS allows the user to compute pier scour by using either the Colorado State University (CSU) equation or the Froehlich equation. However, the CSU equation is recommended by HEC-18. As a result, the CSU equation is the default equation in GeoHECRAS.
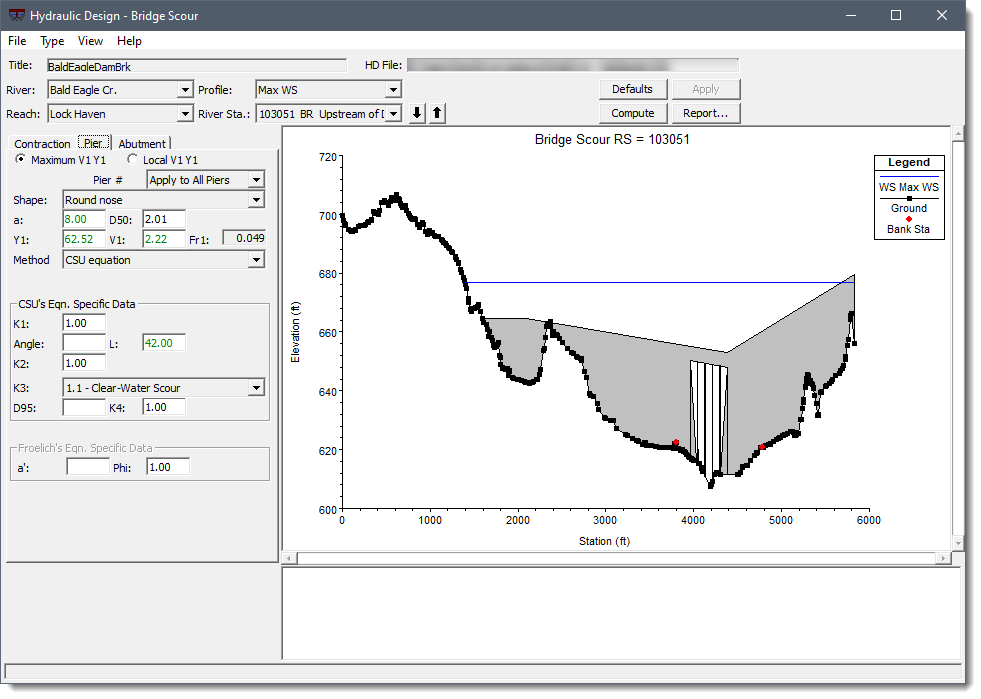
As shown in the above image, the user has the option to use the maximum velocity and depth in the main channel (Maximum V1 Y1) or the local velocity and depth at each pier (Local V1 Y1) for the calculation of the pier scour. In general, the Maximum V1 Y1 option is used to account for the potential of the main channel thalweg to migrate back and forth within the bridge opening. The migration of the main channel thalweg could cause the maximum potential scour to occur at any one of the bridge piers.
If the user selects the Maximum V1 Y1 option, the software will find the maximum velocity (V1) and depth (Y1) located in the cross section just upstream and outside of the bridge. The software uses the flow distribution output to obtain these values. The maximum V1 and Y1 will then be used for all the piers. If the user selects the Local V1 Y1 option, the software will find the velocity (V1) and depth (Y1) at the cross section just upstream and outside of the bridge that corresponds to the centerline stationing of each of the piers.
The Shape dropdown combo box allows the user to select the shape of the pier. The user can select from: square nose, round nose, circular cylinder, group of cylinders, or sharp nose (triangular) pier shapes. When the user selects a shape, the K1 factor for the CSU equation and the Phi factor for the Froehlich equation are automatically set. The user can set the pier nose shape for all piers, or a different shape can be entered for each pier.
The next step will be to enter the angle of attack value into the Angle entry field. The angle of attack is the angle of the flow approaching the pier. If the flow direction upstream of the pier is perpendicular to the pier nose, then the angle would be entered as zero. If the flow is approaching the pier nose at an angle, then that angle should be entered as a positive value in degrees. When an angle is entered, the software automatically sets a value for the K2 coefficient. When the angle is greater than 5 degrees, K1 is set to 1.0.
After this, from the K3 dropdown combo box, select the bed condition. The user can select from: clear-water scour, plane bed and antidunes, small dunes, medium dunes, and large dunes.
At last, enter the D95 value in the D95 entry field. The D95 size fraction is used in the computation of the K4 factor and must be entered in millimeters directly by the user. The software will use this value, along with the D50, a, and the depth of water just upstream of the pier (V1), to automatically calculate the K4 correction factor. The K4 factor is used to decrease scour depths to account for armoring of the scour hole. This factor is only applied when the D50 of the bed material is greater than 0.006 feet (0.2 mm) and the D95 is greater than 0.06 feet (2.0 mm).
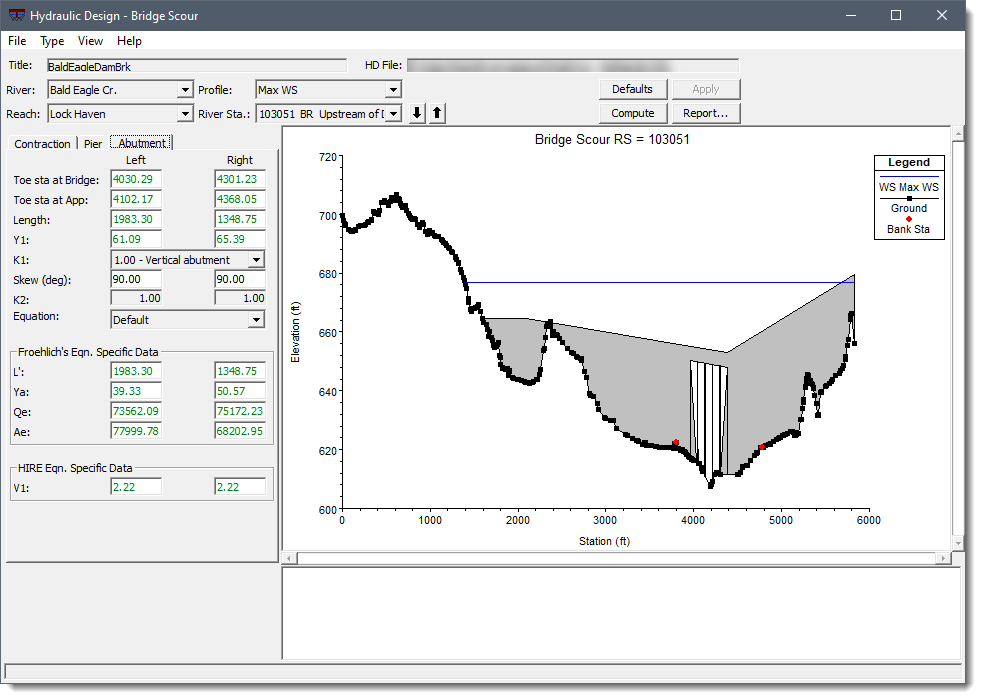
Abutment scour can be computed by either the HIRE equation or Froehlich’s equation. In GeoHECRAS, the computation of abutment scour is performed separately for the left and right abutments. The user is only required to enter the abutment type (vertical, vertical with wing walls and spill-through), i.e., K1. The software automatically populates the data needed for both equations. However, the user can change any variable.
The total scour is a combination of the contraction scour and the individual pier and abutment scour at each location.
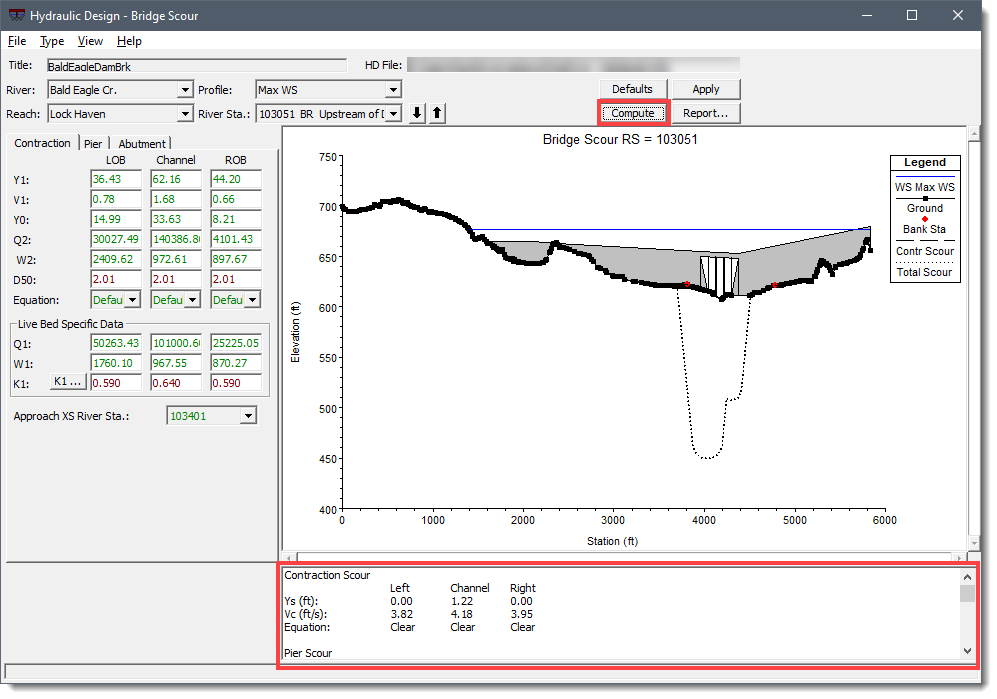
Once all three types of scour data are entered, clicking on the [Compute] button will cause the software to update the bridge scour graphic to reflect the total computed scour. It will also generate results in the bottom portion of the window, as shown below.
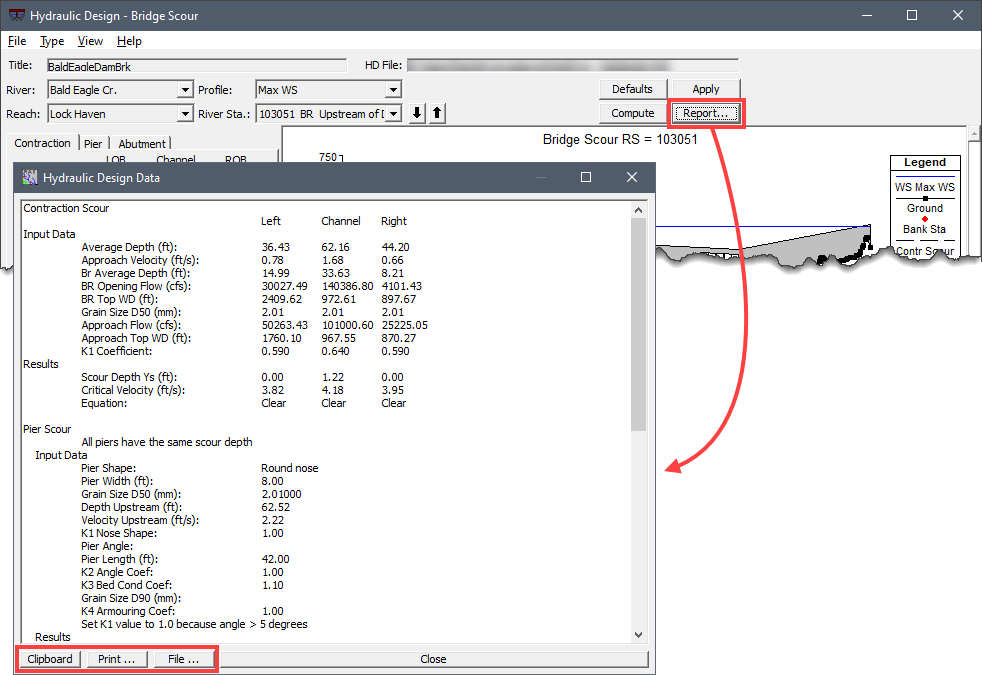
Furthermore, on clicking the [Report…] button, the software will generate a detailed report showing all the input data, computations, and results, as shown below. The software allows the user to send the table to the default printer using the [Print …] button, copy the table to the clipboard using the [Clipboard] button, and save the table to a file using the [File …] button.


CivilGEO G2 Reviews
4.8/5.0 Rating, Over 230 Reviews

GeoHECRAS is recognized as the top Civil Engineering Design Software with an average of 4.8 out of 5.0 rating from over 230 real user reviews on G2.


We use cookies to give you the best online experience. By agreeing you accept the use of cookies in accordance with our cookie policy.
When you visit any web site, it may store or retrieve information on your browser, mostly in the form of cookies. Control your personal Cookie Services here.


